Radiation ConversationWelcome to our continuing Radiation Conversation II. It succeeds Radiation Conversation I with its 2,777 informative and lively comments that became so numerous and lengthy that the page slowed loading considerably. Comments from April 1. 2014 to present have been moved here to Radiation Conversation II.
Radiation Conversation I began September 19, 2011 after we had to continue this forum in a new post after 2,433 comments posted on EnviroReporter.com’s Radiation Station which began March 16, 2011.
All new Radiation Conversation comments take place here!
This is a really valuable space for sharing observations and concerns about radiation, especially with so much misinformation floating around online. It’s clear that monitoring real data like background levels and trends from reliable stations is far more helpful than panic or speculation. Understanding how wind patterns and multiple detectors work together to confirm events is the kind of practical info that empowers people rather than scares them. And while it’s important to stay aware of nuclear issues globally, it’s also worth keeping in mind what credible science says about exposure levels and real health risks so we don’t accidentally spread fear. Thanks to everyone here for keeping the conversation grounded and informative!
This is false impression and, frankly, a pretty dumb one. The IAEA team “had not observed any Russian military deployment inside the Zaporizhia nuclear power plant” BECAUSE PUTIN’S INVADERS EVACULATED IT BEFORE DETONATING IT AT THEIR OPTION.
The IAEI looks daft for actually thinking this malarkey and then serving it up publicly. Most observers we’ve read aren’t that stupid, thank goodness. The only hope, at this point, is that the Ukrainians can find and disable any left explosives before they blow up the largest nuclear complex in Europe, courtesy of war criminal and soon-to-be-deposed Putin.
30th June 2023 – IAEA saw no evidence Moscow planning attack on Zaporizhia nuclear plant, but ‘anything can happen’ (9 minutes 26 secs)
Extract:
The Director General of the International Atomic Energy Agency Rafael Grossi spoke to FRANCE 24 from Vienna and stated that his teams had not observed any Russian military deployment inside the Zaporizhia nuclear power plant, despite Ukrainian authorities claiming that Moscow was preparing to attack the plant.
Russia and Ukraine are presently both accusing the other of planning to orchestrate a major nuclear event.
The Ukrainian’s are claiming that Russian’s have have placed mines in the Zaporizhzhia Nuclear plant spent fuel cooling pools and is presently evacuating staff in preparation for blowing up the facility.
The Russians claim that the Ukrainians have secretly collected nuclear material from one of the Ukrainian nuclear reactors, and that this will enable them to make a dirty bomb, or nuclear bomb.
“In the fog of war the truth is the first casualty!”
Let us to all pray that is madness is averted.
There will be no winners if an event like this were to occur. It would also have serious health affects on multiple future generations in multiple countries as the radiation will spread far and wide. The nuclear plant site and surrounding landscape would also become so contaminated it would become another radioactive exclusion zone, just like the Ukraine Chernobyl Nuclear Power Plant exclusion zone, created after it’s reactor 4 melted down in 1986.
Link to Chernobyl Nuclear Power Plant radiation monitoring stations.
The SaveEcoBot site link has been added under the Ukraine and Belarus country headings on EnviroReporter’s International list of Radiation Monitoring Stations. You will also find other radiation monitoring system links listed under the Ukraine and Belarus country headings there. The local monitoring stations on SaveEcoBot measure background radiation levels in Nano Sievert per hour nS/hr. Most of the local background stations in Ukraine and Belarus outside the Chernobyl exclusion zone are presently showing around 100 to 200 nS/hr. Thirty seven years after the Chernobyl reactor 4 meltdown, the exclusion zone is still showing very high background radiation levels. The highest level being 5300 nSu/hr.
If you are new to this, 100 to 200 nS/hr will be the present local background reference level for you on SaveEcoBot.
If you see levels increasing above this on multiple monitoring sites in Ukraine and Belarus near each other, then it likely means a significant nuclear event has occurred, and you will need to start looking for live surface wind direction and weather patterns so you can determine whether a radioactive cloud is heading in your direction. This will help you make a decision on whether to evacuate or shelter in place. Links to live wind and weather monitoring resources are also provided on the EnviroReporter’s International list of Radiation Monitoring Stations page.
You need to learn how to use the wind, weather and radiation monitoring systems before a major nuclear event occurs. Otherwise you will be fumbling around in the dark, trying to figure out how everything works.
If it is headed outside the boarders of Ukraine and Belarus you can then go to EnviroReporter’s “International list of Radiation Monitoring Stations”, to look up other countries radiation monitoring stations.
In the present world environment, owning a Geiger counter and knowing how to use it, could be a potential life saver. If you have questions about how to use a Geiger counter, or how to test food for radiation, please leave questions in the EnviroReporter radiation conversation comment section here.
Also feel free to share your knowledge on the subject.
Get a feel for your Geiger Counter. Knowing what is the average background level you would expect for your local area is important. You need to build up a knowledge base of your local weather and local background radiation levels. Then you have a baseline from which to work.
I have provided a screenshot below from the Khmelnytskyi monitoring station in Ukraine. It is showing a increase in local background Gamma dose. This is not a huge increase, but an increase was detected.
This increase in background level seems to be confined to the local area at present. I have not been able to find any other regional monitoring stations showing an increase like this during this period of time.
“A colossal explosion was heard at the main weapons and ammunition storage facility supplied by NATO in Khmelnytskyi, western Ukraine. Repeated large detonation explosions occurred after being hit by the missiles, as the depots stockpiled very large quantities of fuel and ammunition for Ukrainian forces’ planned offensive operation.”
I was investigating this massive explosion in real time (video report below), and keeping an eye on the European Ukraine radiation monitoring stations just in case there had been a nuclear component to these explosions. There may have been British depleted uranium anti tank munitions stored there.
At the time nothing above normal background levels were showing up in any of the EU monitoring stations located in Ukraine. I would pop back every now and then to see if there were any significant detections.
Around 7.30 pm my time I found the entire country wide Ukrainian monitoring system had gone down. At around 8pm, all stations came back online again, showing no changes in background levels. Fishy?
This explosion created a massive 3.4 magnitude seismic event at ground level! See screenshot below.
There maybe a significant radioactive event happening that is being covered up.
Can’t say until we have more evidence.
Colossal explosion heard at NATO supplied ammunition facility in Khmelnytskyi (2 minutes 30 secs)
Extract:
A colossal explosion was heard at the main weapons and ammunition storage facility supplied by NATO in Khmelnytskyi, western Ukraine. Repeated large detonation explosions occurred after being hit by the missiles, as the depots stockpiled very large quantities of fuel and ammunition for Ukrainian forces’ planned offensive operation.
On 10/6/2022 the New York Times reports: “A day after the Kremlin announced that it would “nationalize” the Zaporizhzhia Nuclear Power Plant it has seized in Ukraine, the United Nation’s top atomic energy official said on Thursday that he could not recognize any change of ownership of the plant, which he described as unlawful and destabilizing. And he said a nuclear accident there is “a very, very clear possibility.”
Here is a basic guide to quickly find out if a significant radiological event is occurring in Europe or Ukraine.
The link I provide below takes you to the EURDEP radiation monitoring web site.
Extract:
“EUropean Radiological Data Exchange Platform () network for the exchange of radiological monitoring data between participating countries almost in REAL TIME. Monitoring information are collected from automatic surveillance systems in 39 countries. These data reflect essentially the natural radiation background, if NO radiological events occur.”
The EURDEP site link I have provided will take you to their advanced map radiation monitoring page. When you first go to this page scroll down the page and click on the blue button that says, “Open the map, I understand and consent”. If a box appears asking you to allow cookies, you must allow cookies if you want to see the map, and all their radiation monitoring stations.
The radiation monitoring station location dots on the map are colour coded. You can zoom in and out of the map with your mouse wheel. The different colours indicate the radiation level range that is presently being detected at that monitoring location. Purple being the highest and light aqua is the lowest levels being detected.
Once the map view opens you will see a box on the top right of the map area. This box contains layered coloured rows, you will also see a number to the right of each row. This indicates the number of radiation monitoring stations in their system detecting at that level of radiation.
Place your mouse cursor over the coloured bar showing the radiation levels you are interested in, and click.
Once you do this it will filter out all the other monitoring stations on the map that are not in this detection range.
You can use this feature to quickly filter and see what are the highest radiation detections across Europe and Ukraine.
At present there is only one radiation station that is detecting radiation in the 300 to 500 nSv/h range and zero stations in the levels above it. This is a site located in Belarus which was significantly contaminated by fallout from the Chernobyl nuclear reactor meltdown in 1986. Zoom in and you will see that this monitoring station is located just north of the Ukraine border.
If you see more than that one monitoring station showing at this level, you will know there is potentially a major nuclear event in progress.
Note: All monitoring systems are subject to malfunctions at times. Two or more monitoring stations in close proximity indicating an increase in background level is more statistically an indication of a genuine event.
If you click on the monitoring station location dot, a chart will pop up, showing you the radiation levels over time.
If you do see a significant detection, knowing the location’s wind direction at the time will be very important, particularly if you live in Europe.
Wind direction is an important factor in determining where the radiation will go.
The Nullschool 3D Earth wind map service allows you to see wind direction worldwide at different heights. You can rotate the map by holding down your mouse on the map, and dragging. If you use your mouse scroll wheel you can zoom the map location in and out.
If you click on the “Earth” item at the lower left corner of the Nullschool map page, a menu will pop up, that allows you to select different wind height data.
The Russians keep shelling the Zaporizhzhia nuclear power plant in eastern Ukraine, like they did five times today, Thursday August 11, 2022.
This is the largest nuclear reactor in Europe and one of the ten largest in the world. Should it be destroyed, the consequences are going to be massive.
“This is a serious hour, a grave hour and the IAEA [International Atomic Energy Agency] must be allowed to conduct its mission to Zaporizhzhia as soon as possible,” the agency’s chief said at an emergency meeting of the UN security council Thursday night.
EnviroReporter.com recognized the need for accurate US RadNet radiation information being available 24/7/365 soon after the still-ongoing triple meltdowns began at Fukushima Japan March 11, 2011. Millions have seen EnviroReporter.com radiation monitoring ever since because it’s easy and free to use.
There are 142 EPA RadNet stations across America monitoring gamma and beta radiation levels and gamma exposure rates displayed. As of August 11, 2022, there are 483 live graphs continuously streaming though some stations can cut out for periods of time.
Gamma Gross Count Rate and Gamma Gross Count Rate by Channel Range as well as Gamma Exposure Rate and Beta Air Filter Results are graphed continuously courtesy of the U.S. Environmental Protection Agency. EnviroReporter.com organized this vital data for ease of use.
Should the “grave hour” become the unthinkable, know that the radiation from any kind of meltdown, fire, explosion or any combination therewith, the air plume would blow over eastern Ukraine but mostly Russia first.
But what glows around goes around and soon enough it could reach North America. That’s when to turn to EnviroReporter.com’s RadNet Air Monitoring.
Florida local TV stations are on the internet. You can watch them, commercials and all, in California or even in Story City, Iowa.
Gavin Newsom is running personal, self promotional advertisements on local Florida television stations. We’ve seen 6 of them so far, and estimate that there are at least 3 variations, which represents a lot of cash outlay in terms of production costs.
In each of the ads, a smiling active Gavin directs his comments to Florida voters, telling them that the Florida elected officials are doing bad things. On his commercials Gavin Newsom promotes California and invites Floridians to move there.
Obviously, Gavin Newsom is really promoting himself, because he doesn’t mention a single Florida Democrat candidate or ask that people vote for them to make people’s lives better in Florida. The focus is just on Gavin’s smiling face.
Its crystal clear that Gavin Newsom is going to take a shot at running for President in 2024. I am betting Boeing has orally promised to make contributions to him.
Boeing panders to whoever is in office, and donated $1 Million to the Democratic Party committee which was sponsoring the Biden/Harris inaugural ball, after the inaugural ball, even after it was cancelled. Boeing did that after having been loyal supporters of Trump when he was in office.
Gavin Newsom has to understand, loudly and clearly, that whatever primary he will be in, his opponents, the local press and local voters are going to hear about his making a sweetheart deal with Boeing, so they [Boeing] don’t have to clean up their toxic mess at Santa Susana Field Lab which has been instrumental in making children and adults sick with cancer.
The Santa Susana Field Lab and the affected people living and dying within 5 miles of it are what stands in the way of Gavin Newsom’s quest for the Presidency.
By the time the Democratic Primary season ends in 2024, the whole of the U.S. electorate will know Gavin Newsom is in Boeing’s pocket and his deal-making in California is killing children as well as adults.
EnviroReporter.com will continue its unique, award-winning work covering the Santa Susana Field Laboratory, aka Rocketdyne, and its associated issues including Runkle Canyon, Brandeis-Bardin and Ahmanson Ranch, which was as good as protected as parkland once our “Rocketdyne Ranch” cover story hit the stands in December 2002. The 2,783 acre “Upper Las Virgenes Open Space Reserve” has thousands of ancient oaks, rolling savannahs, red-legged frogs and mountain lions. The bucolic place has hiking trails, mountain biking, horseback riding, picnicking and even a splendid ranch house for weddings. What you won’t find, however, are the 3,050 luxury homes stopped by our reporting and the community. It’s the perfect staycation destination and you Californians own it in perpetuity!
June 3, 2022
2:40 pm PDST INT RSSMC DUST AGGREGATE FROM 3 HEPA FILTER MACHINES: 55.3 CPM OR 47.9% ABOVE BACKGROUND^^ which is negligible and a substantial drop since the last measurement in identical conditions just over two months ago on March 30, 2022.
2:00 pm PDST INT RADIATION STATION SANTA MONICA CALIFORNIA OFFICE BACKGROUND: 37.4 CPM^^
Monthly milestone radiation readings at EnviroReporter.com‘s Radiation Station Stats and Special Radiation Station Tests show no indications of additional airborne radiation resultant of Russia’s invasion of Ukraine, though that is to be expected considering no significant nuclear event has been detected.
There are at least two factors to remember when nothing unusual is detected in this case. First, the source. EnviroReporter.com‘s 11 years of extensive radiation testing across the United States numbers over 10,000. Our Eat Me! food and drink monitoring has checked thousands of consumables for telltale beta radiation with an Inspector Nuclear Radiation Monitor.
The RadNet Air Monitoring has testing for beta and gamma radiation across America and really keeps a close eye on the big picture of possible radioactive events impacting the country regardless of their source or national origin. There are 142 EPA RadNet stations, with 483 live graphs, organized here testing for Gamma Gross Count Rate and Gamma Gross Count Rate by Channel Range as well as Gamma Exposure Rate and Beta Air Filter Results that are live-graphed continuously courtesy of the U.S. Environmental Protection Agency.
EnviroReporter.com‘s organization of these data makes it easier to monitor the radiation situation with current normal conditions, and how they look on the graphs, versus anything extraordinary and/or disastrous that may happen in the future. This is an invaluable resource in case of nuclear emergency.
March 30, 2022
9:35 pm PDST INT RSSMC DUST AGGREGATE FROM 3 HEPA FILTER MACHINES: 95.9 CPM OR 2.3 TIMES BACKGROUND^^
9:20 pm PDST INT RADIATION STATION SANTA MONICA CALIFORNIA OFFICE BACKGROUND: 41.3 CPM^^
February 21, 2022
6:45 pm PT INT RSSMC DUST AGGREGATE FROM 3 HEPA FILTER MACHINES: 92.3 CPM OR 2.4 TIMES BACKGROUND^^
6:25 pm PT INT RADIATION STATION SANTA MONICA CALIFORNIA OFFICE BACKGROUND: 38.5 CPM^^
January 17, 2022
2:15 pm PT INT RADIATION STATION SANTA MONICA RAIN: 44.9 CPM^^ or normal background
2:00 pm PT INT RADIATION STATION SANTA MONICA OFFICE BACKGROUND: 43.5 CPM^^
December 30, 2021
2:30 pm PT INT RSSMC DUST AGGREGATE FROM 3 HEPA FILTER MACHINES: 74.7 CPM^^ OR 1.7 TIMES BACKGROUND WHICH IS LOW
2:00 pm PT INT RADIATION STATION SANTA MONICA RAIN: 44.3 CPM^^ – Normal background thereby not contaminated by external event(s)
1:45 pm PT INT RADIATION STATION SANTA MONICA CALIFORNIA OFFICE BACKGROUND: 43.1 CPM^^
The U.S. Department of Energy has undertaken another profoundly dishonest operation, in shipping “hot” nuclear waste to the Nevada Test Site, which is something forbidden under the Federal law the late Senator Harry Reid got enacted and which is still in effect:
It’s worth noting that the U.S. 9th Circuit Court of Appeals has opined in the SB 990 case that the Secretary of Energy is the Federal regulator in charge of nuclear waste from reactor meltdowns, which is what happened at Santa Susana Field Lab and is what happened at Idaho Falls. Even the radioactively contaminated dirt is classified as “nuclear waste” under the Secretary of Energy’s jurisdiction, according to that opinion, which the U.S. Supreme Court sustained without hearing a case.
Former Governor of Michigan, Corporate Democrat, Harvard Law Grad Jennifer Granholm, she of the immaculate bleached blond hairdo which is so phony at her advanced age, is the Secretary of Energy these days, even though from her resume it appears she had no experience for that job other than being a loyal Biden supporter.
Such a person we can all admire, Jennifer Granholm. She shafts the sick and dying kids around the Santa Susana Field Lab by not ordering Boeing to remediate the radioactive waste, and she also allows her dishonest employees to mislabel nuclear waste and deliver it to Nevada, where Federal law bars her from disposing of it.
And Even More Unbelievable, the DOJ Lead Criminal Prosecutor on the Boeing Case Mentioned in Earlier Links Has Become a Partner in the Huge Law Firm Representing Boeing in the Case She Prosecuted:
Follow-up to comment on JDSupra news story and court opinion on conduct of Boeing Directors and senior officers:
News about Deferred Prosecution Agreement Boeing reached with Trump Administration DOJ’s Criminal Division, coincidentally as announced by DOJ on the day after the Capitol Riot:
One can assume that Boeing’s executives and lawyers were anxious to “get the deal done” to avoid the potential criminal prosecution carrying over into the Biden Administration.
Even more important news about families of victims in the 2 Boeing 737-Max crashes asking a Federal court to set aside the Deferred Prosecution Agreement which DOJ entered into with Boeing:
The families’ request for a set-aside of the non-prosecution agreement brings to light the fact that the dollar amount of the “fine” paid by Boeing is remarkably similar to the amount Sherwin Alumina’s Officers & Directors Insurance policy paid to settle the breach of fiduciary duty case as described in my other December 2021 comment.
BOEING’S SHAREHOLDERS RECOVER BIG BUCKS FROM THE OFFICERS & DIRECTORS LIABILITY INSURANCE COMPANY FOR THE BOEING BOARD OF DIRECTORS
The online lawyer magazine JDSupra tells the tale of a lawsuit filed on behalf of Boeing’s shareholders/owners against the members of Boeing’s Board of Directors for allowing a climate of abject recklessness on aircraft safety issues which caused the two disastrous crashes of Boeing’s 737-Max airliners and grounded the production of the company’s most valuable cash income producing product line. According to JDSupra the Directors were portrayed in a highly unflattering light in the case. The members of the Board of Directors were covered by Officers & Directors Insurance, which is purchased by corporations to protect their shareholders from events of Director misconduct.https://www.jdsupra.com/legalnews/boeing-s-board-agrees-to-237-5-million-3235085/
The case settled recently for $237.5 Million which will be paid by the insurance company to the shareholders, as theoretical compensation for the Boeing Board of Directors’ errors and misconduct which led to decreases in value of Boeing stock owned by the shareholders. Because the money will be paid under a Settlement Agreement the members of Boeing’s Board of Directors will admit no liability for wrongdoing or negligence, and none will immediately lose their seats on the Board as a direct consequence of the lawsuit or its settlement.
What was particularly interesting about the JDSupra article is that it disclosed and linked to a formal opinion written by a judge of the Delaware Chancery Court which is the court with jurisdiction to rule on misconduct and negligence by the Boards of Directors and corporate officers of most of America’s large corporations, which are fairly uniformly incorporated in Delaware. (In Delaware Chancery Court judges are called “Chancellors” and “Vice Chancellors” but the title doesn’t change their judicial role in terms of issuing binding opinions.) The judge’s opinion is a real eye-popper and can be read here: https://courts.delaware.gov/Opinions/Download.aspx?id=324120 Because the case settled, the lawyers for the Boeing Directors won’t have the opportunity to erase or invalidate the judge’s opinion.
Readers of Enviroreporter who follow the travails of the people who live around the Santa Susana Field Lab might recognize the alleged conduct by the Boeing Board of Directors in the article, and as recounted and characterized by the Delaware Chancery Court judge’s Opinion and might think the allegations and characterizations have a familiar ring to them.
In the third in a continuing series of groundwater remediation lawsuits which the Whittaker-Bermite Community Advisory Group in Santa Clarita got rolling, by intensely lobbying their local water agencies to “sue the polluter” way back in 1999-2000, on FRIDAY 12/4/21 a U.S. District Court jury in LA rendered a $75 Million money damages verdict against Whittaker Bermite Corp. (a subsidiary of the British industrial giant Meggitt) payable to Santa Clarita Valley Water Agency, the drinking water provider in the Santa Clarita Valley of California. What did Whittaker do? Leaked VOCs into the ground water and refused to pay to remediate them starting 21 years ago when the first lawsuit was filed. There is yet more litigation to be done by the water agency’s lawyers (Nossaman Guthner) on that case, to try to get even more money out of Whittaker’s insurance company or Whittaker themselves, to pay for the cost of “cleaning up the source of 50+% Santa Clarita’s drinking water” but the verdict shows progress. What is fascinating is that the jury members were young, and they “totally got it” in terms of who should pay to clean-up environmental contamination.
Just like with Rocketdyne, justice for the public takes a long time, but it does happen if people are persistent. Take heart about that point, and share the victory in terms of feeling good!
Las Virgenes Open Space Preserve Officially Opens 18 Years Ago Today!
The place formerly known as Ahmanson Ranch opened as permanent open-space parkland 18 years ago on December 1, 2003. Our Ahmanson Ranch Investigation, which began in LA Weekly, intensified in the Ventura County Reporter, doggedly pursued in Los Angeles CityBeat/ValleyBeat and carried on, with more news to come in 2022, by EnviroReporter.com, resulted in a 2,783 acres of prime, publicly-owned rolling hills with thousands of oaks. We stopped 3,050 luxury homes, two golf courses, and 400,000 square feet of commercial space valued at $2 billion and instead left a legacy of land for mountain lions, red-tail hawks and red-legged frogs.
In 2002, my father Leo Benedict Collins II, was diagnosed with a fatal cancer which he bravely chose not to nuke with radiation or chemicals in order to get the most out of life at home. I knew in my heart that Ahmanson Ranch was going to fold like a house of gooey radioactive cards polluted with perchlorate as I had just started reporting on it. I told my father to hang on because I was going to get that ranch for him and he had to live to see it. He did. My father died the night before the park opened on November 30, 2003. My Pops had to be the first official visitor and he was.
Today, his spirit imbues the place, especially at oak tree number 246, a special spot overlooking the open space where we’ve chosen to rendezvous. My father’s gift to you is this miraculously-won wonderland, where you can hike, bike and even get married at the lovely ranch house. Eighteen years is still young for a massive park, but the timelessness of the place transcends and offers a portal into a better space we all can enjoy.
November 24, 2021
5:45 pm PT INT RSSMC DUST AGGREGATE FROM 3 HEPA FILTER MACHINES: 164.2 CPM OR 4.4 TIMES BACKGROUND^^
5:30 pm PT INT RADIATION STATION SANTA MONICA CALIFORNIA OFFICE BACKGROUND: 37.5 CPM^^
November 23, 2021
12:55 pm PDST INT RSSMC DUST VACUUM ONLY: 49.6 CPM OR 49.6 OR BACKGROUND^^
12:40 pm PT INT RADIATION STATION SANTA MONICA CALIFORNIA OFFICE BACKGROUND: 43.1 CPM^^
[From Michael Collins: To answer Another Simi Mom, rhetorically yet realistially, everything.EnviroReporter.com‘s coverage began in 1998 of the worst partial nuclear reactor meltdown in U.S. history which happened above Simi Valley at the Santa Susana Field Laboratory’s Sodium Reactor Experiment in 1959. Our reporting on this site, commonly known as Rocketdyne led to the creation of adjacent Ahmanson Ranch as preserved open space in 2003.
Now comes the film version which will bring this story to massive audiences from MSNBC Films with their first documentary feature film called In the Dark of the Valley.
The documentary’s trailer takes tragedy and makes art and sense of it for all sorts of folks who will be entertained and outraged.
Here’s what MSNBC Films has to say about their documentary:
A Southern California mother discovers that the Santa Susana Field Lab, the site of one of the largest nuclear accidents in U.S. history, is located only 7 miles from her home. Concealed from the public eye for 20 years and never fully cleaned up, she grapples with the idea that the site may be responsible for exposing her daughter and community to cancer-causing radioactive waste. The feature documentary, directed by Nicholas Mihm, airs Sunday, November 14th at 10 p.m. ET on MSNBC.
The Chinese people should be made aware of what their totalitarian government is getting into. Would translated, dubbed or subtitled versions of this potent and illuminating film benefit the Chinese people? Would, say, 150 translated copies of this piece be distributed on DVD there every year for 15 years? The power of the Internet puts that decision in your hands, not the iron fists of the Chinese government.
Look at what EnviroReporter.com has done since it began 15 years ago. Gifting the Chinese people the terrifying truth of nuclear power gone wrong would be the greatest present one could give this august and ancient peoples. It worked here. It can work there.]
October 4, 2021
5:35 pm PDST INT RADIATION STATION SANTA MONICA RAIN: 41.6 CPM^^ or normal background
5:20 pm PDST INT RADIATION STATION SANTA MONICA OFFICE BACKGROUND: 41.0 CPM^^
August 20, 2021
12:55 pm PDST INT RSSMC DUST AGGREGATE FROM 3 HEPA FILTER MACHINES + VACUUM DUST/DEBRIS: 69.3 CPM OR 65.8% ABOVE BACKGROUND.^^
12:40 pm PDST INT RADIATION STATION SANTA MONICA CALIFORNIA OFFICE BACKGROUND: 41.8 CPM^^
Texas legislators are, once again, being hypocrites. Two nuclear power plants are located in Texas, but apparently even spent fuel rods from those reactors are just too dangerous for Texan sensibilities:
20th June 2021 – As Chinese Nuclear Incident Unfolds, Expert Falls Off Building & Dies
Extract:
Ministry of Ecology and the Environment, responsible for news around nuclear power plants, also said no leak into the environment had occurred. “At present, monitoring results of the radiation environment around the Taishan Nuclear Power Plant show that there is no abnormality in the radiation level around the nuclear power plant,” the statement said.
The housings of about five of the more than 60,000 fuel rods in the Number One reactor are estimated to have been damaged, accounting for less than 0.01 percent of the total number, far lower than the assumed maximum damage proportion of 0.25 percent in the design for the reactor, it said.
With the jet stream able to transport radioactive particles and gases far from their source, people around the world are continuing to keep their eye on whatever is unfolding at the nuclear power plant. While China admitted that a leak of radioactive gas did make it into the environment in April, they say no radioactive gas or matter has escaped into the environment in this latest incident. During April 9 incident, the Taishan facility leaked what officials described as a “small amount” of radioactive gas. The Chinese National Nuclear Safety Administration said that event was a “Level 0” event that lacked safety significance.
Nevertheless, scientists continue to track wind movement for any potential cloud of suspicious gas rising from the nuclear power plant.
Current Leak at Nuclear Power Plant in China (Not Japan):
This is a situation to watch closely, in no small part because governments have a strong tendency NOT to be truthful with the public about health and safety risks members of the public face:
14th June 2021 – Exclusive: US assessing reported leak at Chinese nuclear power facility
Extracts:
The company, mainly owned by Électricité de France (EDF), a French utility company, then submitted an operational safety assistance request on June 3, formally asking for a waiver that would allow them to address an urgent safety matter, to the Department of Energy, warning American officials that the nuclear reactor is leaking fission gas.
Framatome reached out to the US government for assistance, the document indicates, because a Chinese government agency was continuing to increase its limits on the amount of gas that could safely be released from the facility without shutting it down, according to the documents reviewed by CNN.
“If they do have a gas leak, that indicates some of their containment is broken,” Rofer said. “It also argues that maybe some of the fuel elements could be broken, which would be a more serious problem.”
Comment:
China has hardly any publicly available monitoring stations available on the Internet, so unless the radioactive gas release flows in an easterly direction offshore, it may be hard to get any publicly reliable detection information.
For those who are interested, you could keep an eye on the situation by using the list of International monitoring stations located here.
Note: The Hong Kong monitoring station in this list does not appear to be working anymore, as the last readings were in late November 2018.
Taiwan does have a very good publicly available radiation monitoring system, so if there was any offshore release that headed in their direction, their system would very likely detect it.
The COVID-19 pandemic led to a surge in rollerskating popularity in 2020, which is fantastic. Now, just in time for Summer 2021, EnviroReporter.com shares the first of three inline skating articles that explore the world of 1) the best recreational skate path in Los Angeles; 2) some of the most insane and challenging long distance skate “jaunts” in Southern California; and 3) where to find the best downhill skate slaloms in the Southland.
There is nothing more liberating after a punishing pandemic than a sixty mile inline speed skate on a “jaunt.” This is extreme long distance speed skating on beautiful routes throughout Southern California that are nearly as fun to imagine as to actually skate. Check out “ROLL ON!”
Long distance speed skater Derby knows the dangers of going down. Hard. That’s why she wears protective gear and knows which hills to slalom. You will too reading “BEST STREET SKATING SLALOMS”
May 25, 2021
2:15 pm PDST INT RSSMC DUST AGGREGATE FROM 3 HEPA FILTER MACHINES + VACUUM DUST/DEBRIS: 68.9 CPM OR 67.2% ABOVE BACKGROUND.^^ Did the May 15, 2021 Pacific Palisades Fire impact this reading? Unlikely.
2:00 pm PDST INT RADIATION STATION SANTA MONICA CALIFORNIA OFFICE BACKGROUND: 41.2 CPM^^
May 10, 2021
4:00 pm PDST EXT INTERSECTION RUNKLE HAUL ROAD/ALBERTSON FIRE ROAD: 60.5 CPM^^
2:30 pm PDST EXT RUNKLE CANYON PARK – SOUTH PARKING LOT: 48.3 CPM^^
Below is a story of seemingly left wing political behavior in Texas. The politics in the story is very obnoxious to me, having traveled throughout rural Texas and read their little local newspapers which spew right wing politics while at the same time ranting about the risk to Texans of the transport of high level nuclear waste on U.S. 20 anywhere near Texans’ beloved Dallas/Fort Worth or their holyland, the area where the Permian Oil Basin is located, surrounding Midland/Odessa.
I’ve been to the dry desert county in West Texas where storage of spent nuclear fuel rods is proposed. Geographically, it’s closer to San Diego than to Houston and the Sabine River forming East Texas’ border. It’s called Andrews County and is due east of the far southeast corner of New Mexico where WIPP is located and where parts for nuclear bombs are manufactured every day. That’s where the proposed nuclear waste disposal site in Texas is proposed, as referred to in the newspaper story linked above.
I find it more than hypocritical that even though Texas has two fully operating nuclear power reactors, and even though Texas politicians are the most obnoxiously “business friendly” folks you’re ever going to meet, in the minds of Texas politicians every part of Texas must be held sacrosanct from being spoiled by the disposal of Texas’s own nuclear garbage, let alone anyone else’s.
As shown in the article linked above, Texan politicians and the state’s large land/ranch/farm owners would much rather Texas’ own high level nuclear waste be disposed of “somewhere else”, such as in Nye County Nevada, where local politicians and business people would rather “make a buck” by putting their own people a physical risk of harm from shipment of high level nuclear waste from all over the USA.
The article linked above from a “mainstream” Texas newspaper owned by Hearst illustrates that while there are many Texans who support “Texit” it’s unlikely the Texit politicos and zealots will be willing to bear the burden of “nationhood” and store Texas’ own nuclear waste from their own nuclear power plants.
12th April 2021 – Japan Decides To Dump One Million Tons Of Radioactive Fukushima Water Into The Pacific; IAEA Approves
Extract:
But wait… we thought that “scientists” said it was safe: does China and South Korea practice a different “science” – one where a million tons of radioactive water getting dumped into the ocean is actually – gasp – dangerous.
Could it be that we have two “scientific” camps, one of which is motivated by things far more mundane than the scientific method to reach its conclusion. Things such as money?
Of course, for Japan which prints trillions of said money every months, it’s not a concern, and that’s music to the “scientists” ears. Suga said the IAEA and other third parties will be involved in the plan, ensuring it is carried out with transparency. We can only assume that the “third parties” will also receive copious amounts of money to find that nothing is wrong here.
There is much more than radioactive tritium in that water!!!
23rd October 2020 – Greenpeace Warns ‘Potential Damage to Human DNA’ at Risk With Japan’s Plan to Dump Fukushima Water Into Ocean
Extracts:
According to the report,
If the contaminated water is discharged to the Pacific Ocean, all of the carbon-14 will be released to the environment. With a half-life of 5,730 years, carbon-14 is a major contributor to global human collective dose; once introduced into the environment carbon-14 will be delivered to local, regional, and global populations for many generations.
Contrary to the understanding of the Japanese government, water that contains large quantities of radioactive carbon-14 (as well as the other radioactive isotopes including strontium-90 and tritium) can only be described as contaminated.
Comment:
It is important for the health of the whole planet that this radioactive contaminated water must be prevented from being released into the Pacific Ocean. The Japanese government want to use the already stressed Pacific Ocean as a cheap dump for the environmental disaster waste they are responsible for. They have been running a public relations campaign for years now claiming that this radioactive water only contains tritium, when in fact it contains a radioactive soup of different harmful isotopes.
Tritium is much more dangerous than they want the public to know!!!
04.12.2011 – Radioactive Berkeley: No Safe Dose
Extracts:
The video also expressed a public concern over children visiting the Lawrence Hall of Science to exposure to tritium emissions from the Lawrence Berkeley National Laboratory’s (LBNL) National Tritium Labeling Facility.
Comment:
This video brings up a lot of independent research on the biological effects of radioactive Tritium releases. That Tritium is something to be very concerned about.
Despite having 2 operating nuclear power plants called Comanche Peak Nuclear Power Plant and South Texas Nuclear Generating Station, officials of the State of Texas are proposing to outlaw disposal of high-level nuclear waste in their state. Property owners in Andrews County Texas have proposed using naturally occurring subterranean caves for that purpose. Andrews County is due east of and directly adjoining Hobbs, NM which has several nuclear processing and storage facilities.
March 10, 2021
1:50 am PST INT RADIATION STATION SANTA MONICA RAIN: 41.5 CPM^^ or normal background
1:15 pm PST INT RADIATION STATION SANTA MONICA OFFICE BACKGROUND: 42.8 CPM^^
March 3, 2021
11:00 am PST INT RADIATION STATION SANTA MONICA RAIN: 57.4 CPM^^ or 26.2% ABOVE BACKGROUND
10:45 am PST INT RADIATION STATION SANTA MONICA OFFICE BACKGROUND: 45.5 CPM^^
January 28, 2021
7:30 am PST INT RADIATION STATION SANTA MONICA RAIN: 45.3 CPM^^ or normal background
7:15 pm PST INT RADIATION STATION SANTA MONICA OFFICE BACKGROUND: 44.7 CPM^^
POSTED MARCH 8, 2021
19th February 2021 – Water leaks indicate new damage at Fukushima nuclear plant
Extract:
Cooling water levels have fallen in two reactors at the wrecked Fukushima nuclear plant since a powerful earthquake hit the area last weekend, indicating possible additional damage, its operator said Friday.
Tokyo Electric Power Co. spokesman Keisuke Matsuo said the drop in water levels in the Unit 1 and 3 reactors indicates that the existing damage to their primary containment chambers was worsened by Saturday’s magnitude 7.3 quake, allowing more water to leak.
Meanwhile, the Tokyo High Court on Friday held the government as well as TEPCO accountable for the 2011 nuclear disaster, ordering both to pay about 280 million yen ($2.6 million) in compensation to more than 40 plaintiffs forced to evacuate to Chiba, near Tokyo, for their lost livelihoods and homes.
Comment:
After nearly ten years the government and TEPCO have been found accountable. The victims are still suffering, and the disaster is ongoing! In my opinion, that is extremely poor compensation for all the pain and suffering those people have been through, because of this disaster. Plus there are still large numbers of victims who have not been compensated at all!
2nd January 2021 – Fukushima Radiation Levels: ‘Worse’ than Previously Thought
Extracts:
A massive amount of radioactive materials “attached to shield plugs of the containment vessels in the No. 2 and No. 3 reactors,” according to Japan’s Nuclear Regulation Authority (NRA).
The finding poses an “extremely serious” challenge to the shutdown process NRA has been attempting at the site, part of an overall decommissioning of the plant.
December 14, 2020
11:30 am PST INT RADIATION STATION SANTA MONICA DUST AGGREGATE FROM 3 HEPA FILTER MACHINES + VACUUM DUST/DEBRIS: 79.9 CPM^^ OR 78.8% ABOVE BACKGROUND
11:15 am PST INT RADIATION STATION SANTA MONICA OFFICE BACKGROUND: 44.7 CPM^^
November 13, 2020
4:00 pm PST INT RADIATION STATION SANTA MONICA DUST AGGREGATE FROM 3 HEPA FILTER MACHINES + VACUUM DUST/DEBRIS: 70.1 CPM^^ OR 68.9% ABOVE BACKGROUND
2:35 pm PST INT RADIATION STATION SANTA MONICA OFFICE BACKGROUND: 41.5 CPM^^
October 12, 2020
2:30 pm PDST INT RADIATION STATION SANTA MONICA DUST AGGREGATE FROM 3 HEPA FILTER MACHINES + VACUUM DUST/DEBRIS: 58.6 CPM^^ OR 37.6% ABOVE BACKGROUND
2:05 pm PDST INT RADIATION STATION SANTA MONICA OFFICE BACKGROUND: 42.6 CPM^^
September 7, 2020
7:50 pm PDST INT RADIATION STATION SANTA MONICA DUST AGGREGATE FROM 3 HEPA FILTER MACHINES + VACUUM DUST/DEBRIS: 51.3 CPM^^ OR 29.9% ABOVE BACKGROUND
7:30 pm PDST INT RADIATION STATION SANTA MONICA OFFICE BACKGROUND: 39.5 CPM^^
July 20, 2020
6:10 pm PDST INT RADIATION STATION SANTA MONICA DUST AGGREGATE FROM 3 HEPA FILTER MACHINES + VACUUM DUST/DEBRIS: 44.5 CPM^^ or background
5:55 pm PDST INT RADIATION STATION SANTA MONICA OFFICE BACKGROUND: 42.6 CPM^^
July 6, 2020
1:40 pm PDST INT RADIATION STATION SANTA MONICA DUST AGGREGATE FROM 3 HEPA FILTER MACHINES + VACUUM DUST/DEBRIS: 45.1 CPM^^ OR 19.3% ABOVE BACKGROUND
1:20 pm PDST INT RADIATION STATION SANTA MONICA OFFICE BACKGROUND: 38.3 CPM^^
June 29, 2020
9:30 am PDST INT RADIATION STATION SANTA MONICA DUST AGGREGATE FROM 3 HEPA FILTER MACHINES + VACUUM DUST/DEBRIS: 54.2 CPM^^ OR 31.8% ABOVE BACKGROUND
9:15 am PDST INT RADIATION STATION SANTA MONICA OFFICE BACKGROUND: 41.1 CPM^^
June 23, 2020
12:45 pm PDST INT RADIATION STATION SANTA MONICA DUST AGGREGATE FROM 3 HEPA FILTER MACHINES + VACUUM DUST/DEBRIS: 47.7 CPM^^ OR BACKGROUND
12:30 pm PDST INT RADIATION STATION SANTA MONICA OFFICE BACKGROUND: 43.6 CPM^^
Disclaimer: This is an amateur volunteer run service. Human error can provide incorrect information, and equipment malfunction can produce false readings. Do not rely on, or take action upon information presented on this web site, without further research.
A serious emergency situation, at around 1 pm (12 noon CET) on December 10th, in Block 2 of the the Olkiluoto nuclear power plant on the western coast of Finland resulted in a reactor shutdown. The plant operator Teollisuuden Voima reported that the radiation levels within the nuclear power unit have increased, but no radioactivity has leaked out.
This short animation of Northern and Southern Hemisphere air circulation shows why we can get detections so far south.
October 2020 day average background chart. (Month Average 109 cpm)
October saw rather volatile swings in local background levels. This is our storm season, and when storms pass through during this time of the year, local area radon levels tend to increase. These radon increases occur when we get northern tropical air flows off the Pacific Ocean. I have set up a local live Radon detector, and I can see all this happening in real time, as the storms pass through the area.
A page has been set up on the Sunshine Coast Computer Club Inc., web site so members can view the local live radiation monitoring station information. This local live radiation monitoring station is publicly available.
Disclaimer: This is an amateur volunteer run service. Human error can provide incorrect information, and equipment malfunction can produce false readings. Do not rely on, or take action upon information presented on this web site, without further research.
23rd October 2020 – Greenpeace Warns ‘Potential Damage to Human DNA’ at Risk With Japan’s Plan to Dump Fukushima Water Into Ocean
Extracts:
According to the report,
If the contaminated water is discharged to the Pacific Ocean, all of the carbon-14 will be released to the environment. With a half-life of 5,730 years, carbon-14 is a major contributor to global human collective dose; once introduced into the environment carbon-14 will be delivered to local, regional, and global populations for many generations.
Contrary to the understanding of the Japanese government, water that contains large quantities of radioactive carbon-14 (as well as the other radioactive isotopes including strontium-90 and tritium) can only be described as contaminated.
Comment:
It is important for the health of the whole planet that this radioactive contaminated water must be prevented from being released into the Pacific Ocean. The Japanese government want to use the already stressed Pacific Ocean as a cheap dump for the environmental disaster waste they are responsible for. They have been running a public relations campaign for years now claiming that this radioactive water only contains tritium, when in fact it contains a radioactive soup of different harmful isotopes.
Disclaimer: This is an amateur volunteer run service. Human error can provide incorrect information, and equipment malfunction can produce false readings. Do not rely on, or take action upon information presented on this web site, without further research.
Disclaimer: This is an amateur volunteer run service. Human error can provide incorrect information, and equipment malfunction can produce false readings. Do not rely on, or take action upon information presented on this web site, without further research.
Disclaimer: This is an amateur volunteer run service. Human error can provide incorrect information, and equipment malfunction can produce false readings. Do not rely on, or take action upon information presented on this web site, without further research.
This short animation of Northern and Southern Hemisphere air circulation, shows why we can get detections so far south.
June 2020 day average background chart. (Month Average 107 cpm)
June average monthly background levels here are showing the usual seasonal variation. We see background levels drop here at this location in the southern hemisphere, during the winter months. The reason for this is that more seasonal winds start coming from the southern ocean air circulation, rather than from the tropics.
Disclaimer: This is an amateur volunteer run service. Human error can provide incorrect information, and equipment malfunction can produce false readings. Do not rely on, or take action upon information presented on this web site, without further research.
One year after the fatal accident with a nuclear-powered missile in the White Sea, Russia’s weapon designers say a test launch for the Poseidon nuclear powered underwater drone will take place this fall. We don’t know yet.
What we know:
While iodine-131 is only measured in the north, in the Kirkenes area and at Svalbard, Swedish and Finnish radiation authorities inform about other isotopes blowing in the skies over southern Scandinavia.
“We found 0,9 microBq/m3 at Svanhovd and 1,3 microBq/m3 at Viksjøfjell.”
Finland’s Radiation and Nuclear Safety Authority (STUK) detected on June 16 and 17 small amounts of the radioactive isotopes cobalt, ruthenium and cesium (Co-60, Ru-103, Cs-134 and Cs-137).
All these isotopes indicate that the release comes from a nuclear-reactor. Iodine-131 has a half-life of 8 days, and given the small amount measured in the north, this isotope could be gone before the radioactive cloud reached the southern parts of Finland and Sweden a week after the first measurements in the north.
They say the radionuclides came from the direction of Western Russia.
27th June 2020 – Sensors detect rise in nuclear particles on Baltic Sea, global body says
Extracts:
VIENNA (Reuters) – Radiation sensors in Stockholm have detected higher-than-usual but still harmless levels of isotopes produced by nuclear fission, probably from somewhere on or near the Baltic Sea, a body running a worldwide network of the sensors said on Friday.
One of its stations scanning the air for radionuclides – telltale radioactive particles that can be carried long distances by the wind – detected unusually high levels of three radionuclides earlier this week: caesium-134, caesium-137 and ruthenium-103.
Comment:
The detections were on the 22nd and 23 of June. We are just hearing about it now, four days later!
This free community resource was created after the Fukushima nuclear catastrophe, so people could quickly locate International radiation monitoring stations, in the event of a major nuclear accident. It is regularly updated and includes a lot of private as well as government monitoring stations.
Two new smartphones have just been sanctioned for exceeding the SAR level: the Xiaomi Redmi 7 and the Gigaset plus. This is a new advance in our alert action!
However, we have been waiting since last October for the Government to deliver on its promise to update the excessive SAR levels of several hundred mobile phone models. We demand that the commitments made following the recommendations of the French National Health Agency (ANSES) be fulfilled.
The Covid19 crisis does not justify such a delay. The Phonegate scandal is also a real health emergency!
See here the list of the 23 smartphones sanctioned to date:
Large numbers of mobile phones in use are emitting microwave frequency radiation way above the regulatory limit, when placed against the body. For safety reasons it would be wise to check if you are, or a family member is using one of these mobile phone models.
Independent scientific experts around the world have been saying for decades that the SAR’s regulatory limits are already set far to high to protect public health, and particularly children!
25th May 2020 – Withdrawal of the Razer Phone 2: not seeing the forest for the trees!
Extracts:
Since then, in two years, thanks to our action, 23 different smartphone models controlled by ANFR have been found to have SAR levels for the head and body above the regulatory limit of 2 W/kg during ANFR inspections. Four have been withdrawn from the French market. The others have only had their SAR level “updated” (reduced by updating).
However, tests conducted by both ANFR and the journalist Sam Roe for the Chicago Tribune have shown that the local body SAR level is multiplied by a factor of 3 to 4 when measured either at direct skin contact or at 2mm. That of the Razer Phone 2 could reach over 10 W/kg at direct contact with the skin.
“that the representative of the European Commission is hiding behind a staggering technocratic cynicism. His non-reaction shows the extent to which the mobile telephony industry lobbies have knowingly silenced the European authorities. We demand that this new health scandal, Phonegate, be treated with seriousness and a sense of responsibility. The health of hundreds of millions of Europeans citizen is at stake”.
Disclaimer: This is an amateur volunteer run service. Human error can provide incorrect information, and equipment malfunction can produce false readings. Do not rely on, or take action upon information presented on this web site, without further research.
May 18, 2020
8:45 am PST INT RADIATION STATION SANTA MONICA RAIN: 41.7 CPM^^ or normal background
8:15 am PST INT RADIATION STATION SANTA MONICA OFFICE BACKGROUND: 42.7 CPM^^
It is very likely that large numbers of people around the world are now suffering from vitamin D deficiency, after being confined to their homes for months. Even before the pandemic, large numbers of people were already vitamin D deficient.
Below is a link to a recent medical management protocol for COVID-19, released by the Eastern Virginia Medical School (EVMS) in the US. It points out that vitamin D deficiency could be a significant contributing factor leading to a serious outcome if one were to contract COVID-19. Also, on page three, there is a list of suggested supplements that may have a role in the prevention / mitigation of COVID-19.
EVMS CRITICAL CARE COVID-19 MANAGEMENT PROTOCOL
Developed and updated by Paul Marik, MDChief of Pulmonary and Critical Care Medicine Eastern Virginia Medical School, Norfolk, VAMay 5th, 2020
Extracts Page 3:
Prophylaxis
While there is very limited data (and none specific for COVID-19), the following “cocktail” may have a role in the prevention/mitigation of COVID-19 disease. While there is no high-level evidence that this cocktail is effective; it is cheap, safe and widely available.
• Vitamin C 500 mg BID and Quercetin 250-500 mg BID [1-5]
• Zinc 75-100 mg/day (acetate, gluconate or picolinate). Zinc lozenges are preferred. After 1 month, reduce the dose to 30-50 mg/day.[1,6-9]
• Melatonin (slow release): Begin with 0.3mg and increase as tolerated to 2 mg at night [10-13]
• Vitamin D3 1000-4000 u/day [14-20]
• Optional: Famotidine 20-40mg/day [21]
Extract Page 12:
Furthermore, Vitamin D insufficiency exacerbates the cytokine storm and likely increases the risk of death.
Document:
This EVMS document also contains information on suggested treatments if an infected person progresses into a more serious condition, where they need medical care.
(Note: If you are currently taking prescribed medications any self-medication should not be used without your doctor’s knowledge and approval. Non prescribed medications may have unwanted side effects, change the way prescription medicines being used work in your body, interact with alcohol and other drugs or treatments, Always check with your doctor first — especially if you have any health conditions.)
May 11, 2020
6:20 pm PDST INT RADIATION STATION SANTA MONICA DUST AGGREGATE FROM 3 HEPA FILTER MACHINES + VACUUM DUST/DEBRIS: 42.5 CPM^^ OR BACKGROUND
6:00 pm PDST INT RADIATION STATION SANTA MONICA OFFICE BACKGROUND: 44.5 CPM^^
May 4, 2020
2:30 pm PDST INT RADIATION STATION SANTA MONICA DUST AGGREGATE FROM 3 HEPA FILTER MACHINES + VACUUM DUST/DEBRIS: 57.3 CPM^^ OR 35.5% ABOVE BACKGROUND
2:10 pm PDST INT RADIATION STATION SANTA MONICA OFFICE BACKGROUND: 42.3 CPM^^
Disclaimer: This is an amateur volunteer run service. Human error can provide incorrect information, and equipment malfunction can produce false readings. Do not rely on, or take action upon information presented on this web site, without further research.
The Coronavirus pandemic and worldwide economic collapse is breaking the “just in time” supply lines for food growing, processing and delivery in many countries. All the indications are that food inflation and shortages are on the way. If you took notice of my previous article on earth changes, pointing to worldwide crop losses, that were occurring before Covid-19, you would have already set up a home garden. Your locality or country may be spared the worst of this, even so in the present world environment it would be very advisable to have a garden or microgreen system up and running, to supplement your families food requirements. If you are just getting started there are articles below that can help you, even if you are finding it difficult sourcing seeds at present.
Here is a recent article pointing to food inflation and food shortages. This is just one of numerous recent articles on this subject.
19th April 2020 – Meat Prices Suddenly Surge As Food Processing Plants Shut Down, With 1000s Of Tons Left To Spoil
Extracts:
The real takeaway here is that the supply chain for American staples was badly damaged by the outbreak, with the damage more extensive and stubborn than government officials have really acknowledged. Two months on, and millions of Americans are still having trouble finding toilet paper and sterilizing wipes. A comprehensive list of products in perpetual short-supply would be quite lengthy, at this point.
If closures like these continue, it could add further strain on the supply chain. Everywhere you look, you see experts talking about an overabundance of food thanks to the closure of restaurants, which has resulted in unprecedented levels of food waste. But sadly, thanks to the way our food distribution is set up, if there’s no way to process the products, package them and then distribute them to markets around the country, due to staff in lock down, then the food will spoil before it’s eaten.
Bottom line: Thanks to the surprising complexity of food supply chains, there’s a scenario where farmers are dumping milk and other product, factories and farms are closing or rolling back activity, causing the number of products getting to the shelves to fall, leading to instantaneous upward pressure on prices.
Today the ABC in Australia has published an excellent article on planning a vegetable patch that produces all year round. Gardening is a great way to get fresh air and exercise. It is productive and a cost saving activity you can do during the lock down. Gets you away from all those device screens and is also excellent for the mind, body and soul.
Planning a vegetable patch that produces all year round.
For those off you who are new here or who haven’t yet started a garden, microgreens are a very quick and efficient way to grow nutritious food. You can get a crop in a week to ten days instead waiting a month or more to get a crop from a home garden. It also takes up very little space. You can also use specialized indoor lighting to grow them if you need to. Here is some basic practical information to get you started.
10th April 2020 – Terrified Atomic Workers Warn That the COVID-19 Pandemic May Threaten Nuclear Reactor Disaster
Extracts:
Of critical importance: every 18-24 months each reactor must shut for refueling and repairs. Itinerant crews of 1000 to 1500 technicians travel to 58 sites in 29 states, usually staying 30-60 days. They often board with local families, or in RVs, hotels, or Air B&Bs.
Industry-wide the pandemic has brought working conditions to the brink of collapse. At Pennsylvania’s Limerick Generating Station, workers say they are “terrified” that the plant has become a “breeding ground…a complete cesspool” for the coronavirus. “I’m in a constant state of paranoia,” one technician told Carl Hessler, Jr., of MontcoCourtNews.
The industry is now using the coronavirus pandemic to rush through a wide range of deregulation demands. Among them is a move to allow radioactive waste to be dumped into municipal landfills.
Comment:
The Covid-19 pandemic is going to affect nuclear power plant safety worldwide. As nuclear workers become infected and taken out of the workforce all those countries with operating nuclear reactors will be facing the similar staffing and maintenance problems. Let’s pray and hope that governments around the world are capable of making very good decisions on how to deal with skilled nuclear worker shortages.
Disclaimer: This is an amateur volunteer run service. Human error can provide incorrect information, and equipment malfunction can produce false readings. Do not rely on, or take action upon information presented on this web site, without further research.
10th April 2020 – Chernobyl fires: Radiation fears as firefighters struggle to contain blazes in radioactive zone
Extracts:
A senior environmental official, Egor Firsov, said at the weekend that radiation in the area was detected at 16 times higher than normal background levels.
A 27-year-old resident of a settlement near the exclusion zone is under investigation on suspicion of having started at least one of the local fires.
Comment:
Fires in the Chernobyl nuclear plant fallout contamination zones are always of concern, because they often release large amounts of radioactive fallout contamination back into the atmosphere.
These recurring fire events place the firefighters and local communities at risk of being exposed to significant radiation exposure.
The fires in the contaminated forests around the damaged Chernobyl nuclear power plant are still not under control. The Ukrainian civil protection agency said that the fire spread to the surrounding grass areas. Three planes and three helicopters are in the air to help fight the fire. https://www.sciencedirect.com/science/article/pii/S0160412014002608?via%3Dihub
After the meltdown at the Chernobyl nuclear power plant in 1986, large amounts of radioactivity leaked out. The area directly around the nuclear power plant was hardest hit. The pine trees standing there, caught some of the radioactive particles and built them into their wood. Thats the problem now. A study from 2014 came to the conclusion that If around half of the forest in the exclusion zone burned down, we would have a renewed radioactive precipitation.
Two forest fires broke out on Saturday and spread over 250 acres in a forested area near the Chernobyl power plant. Firefighters in Ukraine are battling to extinguish the forest fires.
1. It was found that dry heat disinfection (heating at 70 ℃ for 30 minutes) had the least effect on damaging the filtering mechanism, and the filtering effect could be maintained above 95%.
2. The disinfection method of spraying alcohol on the mask will destroy the electrostatic absorption of the mask, causing filtering efficiency of the mask lowering below 95%.
3. Other methods such as steamer damp heat method and high-pressure high temperature sterilization methods also made the filtering efficiency of the mask lower than 95%.In addition, high temperature and high-pressure method makes the mask seriously deformed.
4. The new coronavirus is sensitive to ultraviolet rays, and ultraviolet disinfection does not affect the filtration efficiency of respirators. However, the inactivation effect of viruses in mask fibers, which cannot be directly observed, is unknown. Therefore, it is not recommended.
How to make your own mask: Hong Kong scientists reveal temporary solution for those unable to get protective gear because of panic buying and price-gouging
I’m very happy to see stats at RSSM still active during the coronavirus emergency. And, it’s also encouraging that radiation levels are going in the downward direction. Hopefully, all are well at RSSM. I have been self-isolating these past 10 days due to mild symptoms. Looks like I either have something else or it’s just a mild case. In any event, having read the advice on this website for the past six years, I feel adequately prepared for the current emergency. Not so much in terms of hand sanitizer or toilet paper mind you, but I am ready to bunker-up for an extended time for emergencies in general. Thank you to Michael Collins and Enviroreporter.com for keeping us informed and helping us to get ready for whatever may be coming our way. Stay safe and do try to stay indoors as much as possible.
March 23, 2020
6:00 pm PDST INT RADIATION STATION SANTA MONICA DUST AGGREGATE FROM 3 HEPA FILTER MACHINES + VACUUM DUST/DEBRIS: 53.2 CPM^^ OR 1.4 TIMES BACKGROUND which is considerably less than the previous period’s reading. This is due in part to the sealing of RSSM in light of the Coronavirus pandemic reducing outside particulates and the exterior reduced human activity which has greatly improved the air and diminished the dust. The radiation above background is just one sixth (1/6) that of the last assessment March 6, 2020.
5:40 pm PDST INT RADIATION STATION SANTA MONICA OFFICE BACKGROUND: 37.8 CPM^^
If implemented early, Social Distancing can potentially significantly lower the fatality rate off patients and medical staff during a pandemic.
13th March 2020 – Coronavirus fears prompt health officials to ask Australia’s leaders to ban events with more than 500 people.
Extract:
A senior West Australian doctor has called for all schools to be closed soon and for there to be no crowds allowed at events as the coronavirus spreads, declaring he wants his colleagues to stay alive. Coronavirus claims Coast event as others hang in balance
WA Australian Medical Association (AMA) president Andrew Miller posted on social media: “You want to go to the footy? I want my colleagues to stay alive.”
Why, in this article, are these doctors saying they want their colleagues to stay alive?
This is why?
Look to Italy as an example. They have one of the best hospitals systems in the world. Their hospitals are well equipped, and they were prepared. The Italian public were also told everything was fine. They had two cases a month and a half ago.
On the 30th January 2020, had two Chinese tourists who tested positive for COVID-19.
By 24th February 2020, Italy had 229 confirmed cases and 6 fatalities.
On the 8th March 2020, Italy lock down a region with a population of 16 million people. By this time the number of confirmed cases had risen to 6,387 and deaths had risen to 366.
By 9th March 2020, Italy went into whole country lock down.
On 10th March 2020, there were 10,149 confirmed cases and 631 deaths.
Their hospitals systems are now completely overloaded because the viruses infection rate is exponential. Their staff are exhausted. They can’t treat all the patients. In situations like this, medical staff contract the virus. If you look around the Internet, top Italian medical doctors are telling everyone please don’t make the same mistakes we made.
If you don’t implement social distancing early in an outbreak, a country’s hospital systems can become totally overwhelmed very quickly. This means the fatality rate will increase by a factor of five to ten times or more.
If you implement social distancing in the very early stages of the outbreak, the hospital system has a chance. It spreads the load of infected patients over a longer period of time. This means that the hospitals and staff have a better chance to treat everyone effectively.
Social distancing means a lot more people and medical staff end up surviving the contagion, because many more people were able to get good medical care. See chart below.
During a pandemic you don’t need to wait for a government directive to implement proper social distancing, start implementing it immediately. The sooner social distancing is implemented, the more lives will be saved. Watch this 6.29 minute video. This is what we all need to do. Our personal actions can potentially save a lot of lives.
16th March 2020 – Why fighting the coronavirus depends on you
March 12, 2020
12:20 pm PST INT RADIATION STATION SANTA MONICA RAIN: 47.7 CPM^^ or normal background
12:00 pm PST INT RADIATION STATION SANTA MONICA OFFICE BACKGROUND: 42.0 CPM^^
Three robust High Efficiency Air Particle (HEPA) filter air-cleaning and negative ion generating machines have kept EnviroReporter.com‘s Radiation Station Santa Monica air clean and refreshing since the advent of the ongoing triple meltdowns in Fukushima Japan in 2011 as we wrote in Eat Me! that year. One of our machine removes “99.97% of as small as 0.3 microns contaminant particles like pet dander, mold, viruses, bacteria and pollen,” according to a review of the Honeywell 17000-S Air Purifier. “The HRF-AP1 pre-filter has Activated Carbon filter in it. This will both help adsorb VOCs, gases, odors and trap larger particles such as dust, lint, fibers, pet hair & fur.”
EnviroReporter.com‘s air cleaners ‘harvest’ much of the dust and debris that we test for radiation (by vacuuming it off first). The air cleaners also remove viruses like the Coronavirus (COVID-19) making them potentially very effective in rooms in buildings where air is circulated and shared. Aston An added benefit is that HEPA machines filter out the radiation we regularly test for and find, as shown below. This latest test finds the dust/debris sample testing at 230% of background, which is actually a decrease from the previous period’s testing. The following reading is below the California Highway Patrol’s limit of 3.0 times background before a substance is considered hazardous requiring HAZ-MAT protocols.
March 6, 2020
1:00 pm PST INT RADIATION STATION SANTA MONICA DUST AGGREGATE FROM 3 HEPA FILTER MACHINES + VACUUM DUST/DEBRIS: 79.1 CPM^^ OR 2.3 TIMES BACKGROUND
12:40 pm PST INT RADIATION STATION SANTA MONICA OFFICE BACKGROUND: 35.0 CPM^^
This recent study shows how very important regular hand washing with soap and water is in preventing infection, and preventing the spread of a global pandemic!
There should be way more up front and visible public education on the importance of hand washing. Watch the educational video Germ Smart, how to wash your hands properly in the post below.
23rd December 2019 – Hand‐Hygiene Mitigation Strategies Against Global Disease Spreading through the Air Transportation Network
Abstract Extracts:
Centers for Disease Control and Prevention (CDC) and World Health Organization (WHO) consider hand hygiene as the most efficient and cost‐effective way to limit disease propagation.
Here, we use epidemiological modeling and data‐driven simulations to elucidate the role of individual engagement with hand hygiene inside airports in conjunction with human travel on the global spread of epidemics. We find that, by increasing travelers engagement with hand hygiene at all airports, a potential pandemic can be inhibited by 24% to 69%.
It is my opinion, as the Coronavirus virus spreads around the World, a number of governments will hide the true infection numbers. They will do this to shield their economies against the resulting economic shock that would result by them revealing the true numbers. This could work if the infected numbers remain manageable.
If they lose control, and the infection numbers dramatically increase all of a sudden, you could find your everyday life turned upside down. Within a a very short period of time large parts of your country, towns or districts could be placed under quarantine.
This may not happen in your location. Lets hope it doesn’t. If it does, having the proper knowledge, skills and equipment on hand will greatly improve your family’s chances of of avoiding infection. Do research, bookmark, printout, and download instructional information that will provide your family with the necessary knowledge and skills.
Example, lets start with preventing infection, your family’s first line of defense!
As the Coronavirus spreads Worldwide large numbers of people are purchasing, goggles, gloves, masks, sanitizers and disinfectants etc.
That maybe a great idea, but next to useless exercise if you don’t know how to sanitize, or use the equipment correctly!
The skills provide in the instruction videos below could significantly improve your family member’s chances of avoiding infection.
It is better for all the members of your family to practice and master these techniques now, than wait until the last minute. Remember, for this to work, all the family members will need to work together as a well oiled team.
Don’t just rely on the information presented here, do more research, as there is much more you will need to know.
Firstly and most importantly keep your hands away from your face!
You think you have been washing you hands correctly all these years? Well sorry to say the vast majority of you haven’t been!
Germ Smart – How To Wash Your Hands
I would also suggest that you stop wearing hand jewelry, watches, false nails or nail varnish, plus keep your nails as short a possible. Doing this will significantly improve the effectiveness of using this hand washing technique.
With the potential for COVID-19 to infect through the eyes, it will be import to use whatever eye protection you have available, goggles, wrap around safety glasses, sunglasses, ordinary glasses etc.
Again, I would also suggest that you also stop wearing hand jewelry, watches, false nails and keep your finger nails as short a possible. These sharp items can puncture the gloves.
Obviously, most of you will not be wearing a full PPE kit. It is still very important to know in what order and how to remove the equipment that you are wearing.
Cleaning and Sanitizing (Food Preparation Areas)
How to Properly Disinfect Surfaces to Kill Germs
This is a commercial product video, I have put it in this list because it provides important information.
Look around your environment for those surfaces that are frequently touched by people. They are the surfaces that will need to be sanitized often. Some surfaces can be damaged by some cleaning and sanitizing chemicals, particularly electronic devices, so do your research first before applying!
With just about everyone addicted to their mobile phone, it would be a very good idea to learn how to sanitize it properly. These devices can be a significant vector in the spread of a contagion. Use speaker phone, texting and avoided placing it on your head or face. Stop using it, or limit its use to absolutely essential calls if possible.
If you touched the outside of the Phone Soap device with your hands as you placed the phone into the device, you will then need to also sanitize the outside of the Phone Soap device, and your hands before removing the phone. There are a number of other phone and tablet sanitizing systems out there that are based on wipes and cloths, that you could research.
Toilet Seat
Put the toilet lid down before flushing the toilet. This will help contain potential aerosol contaminated water droplets from entering the home, or business environment.
This Reuters article provides detailed information on the likely source of the recent 60x background level radiation detection in Moscow. The report is in English.
11th December 2019 – Russians protest over plans to build road near Soviet-era radioactive waste site
Extracts:
The 34-km (21-mile) road, which city authorities say is safe and will help ease traffic, is set to pass the Moscow Polymetal Plant and a fenced-off site where it disposed of radioactive substances decades ago.
“The thing is, the presence of this nuclear waste dump and its danger are not being acknowledged by the people in charge of construction,” she said. “But it’s obviously not safe for the people living here.”
February 19, 2020
12:45 pm PST INT RADIATION STATION SANTA MONICA DUST AGGREGATE FROM 3 HEPA FILTER MACHINES + VACUUM DUST/DEBRIS: 101.1 CPM^^ OR 2.4 TIMES BACKGROUND
12:25 pm PST INT RADIATION STATION SANTA MONICA OFFICE BACKGROUND: 41.9 CPM^^
February 2020 – Moscow recorded a 60-fold excess of radiation levels in the area of the new highway. Ministry of Emergencies denies everything Evgenia Malyarenko, Natalya Telegin
Extracts:
Local residents and activists who are on duty on the slope of the Moscow River, where authorities are planning to build a new expressway – the Southeast Chord, recorded five surges in radiation over the past weekend in this area. They reported this to Open Media. The highest level – 18.06 microsievert per hour – the FSUE Radon sensor on the slope showed on the evening of February 9. The corresponding video on his Facebook page was published by the municipal deputy from the Pechatniki District Sergey Vlasov. He noted that the recorded indicators are 60 times higher than the norm.
A radiation repository in the construction area of the new highway New Highway – the Southeast Chord, which, according to city authorities, should connect the Enthusiasts Highway and the Warsaw Highway, is being built in the south of the capital near the Kolomenskoye Park. The project received wide publicity last summer, when activists found that the construction zone of the chord passes through a radioactive repository.
Comment:
Sixty times background is a very significant detection!
Quote:
“After that, the leadership of Radon arrived on the slope urgently, the parliamentarian said. Representatives of the enterprise suggested that such jumps were caused by “electrical interference”, the deputy explained. Later, the director general of the Radon Federal State Unitary Enterprise Alexey Luzhetsky explained officially the failure of high radiation rates in the capital. “Since the sensor is still in setup mode, the readings may be confused.”
Was the detection equipment malfunctioning?
This type of radiation detection equipment is already calibrated and tested, before it is located at a site.
Article: (In Russian, so you will need to use Google translate.)
I have an acquaintance in Santa Clarita named Carl Goldman. He and his wife Jeri own a local radio station. They are passengers on the Diamond Princess, the ship which is quarantined in Yokohama. Carl has been writing a daily diary which is posted on his radio station’s website, telling his friends what is happening with the quarantine.
Traveling with the Goldmans are a couple with the last name Jorgenson. They used to live in Santa Clarita. I don’t know them. Apparently on Friday Mrs. Jorgenson (also named Jeri) was taken away by Japanese government officials because she “tested positive” for the new corona virus. Her husband did not test positive, so he is being shipped home to the USA today, for quarantine here.
Incredibly, the Japanese government is sending the latest coronavirus patients to a hospital in Fukushima!
8th February 2020 – What is known about the institute where the radioactive release occurred
Extracts:
The Research Institute of Atomic Reactors (SSC RIAR) is located in the Ulyanovsk Region in the city of Dimitrovgrad, which residents themselves call the “atomic capital.”
According to experts from the Business Online publication, the greatest danger to the Middle Volga region is the BOR-60 fast neutron reactor operating in NIIAR. And one of the main dangers lies in its coolant, which is sodium.
So, the summer of 1997, when an increased release of radioactive iodine-131 began at one of the NIIAR facilities, lasting almost three weeks. Moreover, on some days, the limit level for the emission of iodine-131 in the RIAR exceeded 15-20 times. Local residents continue to sue the university so far and require official documentation of what happened.
In April 2000, an emergency occurred at the VK-50 reactor, which threatened to turn into a “Chernobyl” catastrophe: one of the three emergency protection cassettes spontaneously plunged into the active zone due to a break in the lower thermal insulation of the actuator that fell on the emergency protection working body. The Gosatomnadzor inspection then suspended the VK-50 reactor.
In 2011, information on radiation emissions at the institute was already appearing on the network. Concerned residents called the city hall, saying that an accident had occurred at the RIAR base. But then the press service of the institution told Interfax that there was no accident.
In 2017, RBC wrote about the contamination of part of Russia with the radioactive isotope ruthenium-106. Then Europe suffered from it, which also received a dose of ruthenium. Experts argued that the production of ionizing radiation sources based on ruthenium-106 is in Dimitrovgrad.
On February 3, 2020, in Dimitrovgrad, on the territory of the Research Institute of Atomic Reactors (SSC RIAR), radioactive pollution of snow was recorded. Now the background radiation level is also normal, according to the institution. Journalists investigating this case found that minor pollution with radium-226 is present only at site No. 1 of the institute itself, where the release occurred. Radium-226 is formed during the decay of uranium. The half-life of radium-226 is 1,600 years.
Comment:
With this type of history, this site is just an accident waiting to happen!
“Now the background radiation level is also normal, according to the institution. Journalists investigating this case found that minor pollution with radium-226 is present only at site No. 1”
Which Journalist, and what news organisation do they represent?
This appears to be the usual nuclear industry propaganda, that is disseminated to calm the population.
Article: (In Russian, so you will need to use Google translate)
Disclaimer: This is an amateur volunteer run service. Human error can provide incorrect information, and equipment malfunction can produce false readings. Do not rely on, or take action upon information presented on this web site, without further research.
4th February 2020 – In Dimitrovgrad, radiation leaks occurred. Residents bought up drugs with iodine
(Below is a Google translation of this report.)
Extacts:
There is information that yesterday there was a slight pollution of the snow due to the leakage of a radioactive substance. However, employees of the enterprise report that the radiation level is not exceeded. Yesterday, city residents were asked not to leave their homes. Today, due to an emergency, some of the employees in RIAR did not go to work, Khvorov described the situation.
The Ulyanovsk media also reported that yesterday, due to the leakage of radioactive substances at RIAR, the children were not allowed to leave the city on time. According to official data, now the radioactive background in RIAR itself and beyond does not exceed the norm.
Comment:
Here is the google map location of Dimitrovgrad in Russia, zoom out to see the world map.
January 2, 2020
8:45 pm EST INT SOUTHWEST MICHIGAN ROOM FIRST FLOOR SNOW SAMPLE: 38.4 CPM^^
8:30 pm EST INT SOUTHWEST MICHIGAN ROOM FIRST FLOOR BACKGROUND: 44.1 CPM^^
11:00 am EST INT SOUTHWEST MICHIGAN ROOM FIRST FLOOR BACKGROU 36.0 CPM^^
December 30, 2019
8:45 pm EST INT SOUTHWEST MICHIGAN ROOM FIRST FLOOR SNOW SAMPLE: 95.0 CPM^^ OR 120.9% OVER BACKGROUND
8:10 pm EST INT SOUTHWEST MICHIGAN ROOM FIRST FLOOR BACKGROUND: 43.0 CPM^^
7:00 pm EST INT SOUTHWEST MICHIGAN ROOM FIRST FLOOR BACKGROUND: 45.2 CPM^^
December 29, 2019
10:25 pm EST INT SOUTHWEST MICHIGAN ROOM FIRST FLOOR RAIN SAMPLE: 54.2 CPM^^ OR 21.8% OVER BACKGROUND
10:10 pm EST INT SOUTHWEST MICHIGAN ROOM FIRST FLOOR BACKGROUND: 44.5 CPM^^
The location of the radiation monitoring equipment used for the December 2019 radiation report below, is not located anywhere near the major fires affecting the East Coast of Australia.
At present the smoke from those fires have not affected this location.
Disclaimer: This is an amateur volunteer run service. Human error can provide incorrect information, and equipment malfunction can produce false readings. Do not rely on, or take action upon information presented on this web site, without further research.
This article describes the Russian missle and nuclear warhead combination which crashed into the White Sea in northwest Russia earlier this year, releasing radiation into the sea and air and killing Russian nuclear scientists and technicians. While it’s intellectually satisfying to have the mystery of the nuclear accident and radiation release solved by a formal press release, the details of the nuclear weapon delivery system are sobering to say the least.
On Thursday the19th of December 2019, the floating nuclear power plant Akademik Lomonossow was put into operation as the first of its kind in the Russian Far East. The facility, designed and built in Russia, symbolically illuminated the central Christmas tree in the city of Pewek, Russia. The Russian group Rosenergoatom, which operates the nuclear power plant, described the commissioning as a historic event not only for the Russian, but also for the global atomic energy industry. This is reported by RIA Novosti. Akademik Lomonossow is not only the first floating but also the northernmost nuclear power plant worldwide. According to Rosenergoatom, the thermal power plant has a high safety factor. It is equipped with two KLT-40S reactors, which are used in nuclear icebreakers. Together they can generate up to 70 MW electrical energy and 50 Gcal / h thermal energy. This is said to be able to supply electricity to a city with around 100,000 inhabitants. https://ria.ru/20191219/1562573532.html Let’s pray it stays afloat.
Potential 110 Times Regulatory Limit Exposure For Children!
Supreme Court Rejects Cell Phone Industry Challenge To Berkeley Ordinance
Extracts:
“The court agreed that our precious First Amendment guarantees that we have the right to know that cell phones emit radiation and that levels can be exceeded when phones contact the body. Astonishingly, the industry argued that compelling them to provide information about tested distances set for large adults denied their right to keep this information hidden as part of their right to free speech.
Investigations at FCC accredited labs by the Chicago Tribune, the law firm of Fegan Scott, and CBC Broadcasting, as well as tests of hundreds of phones by the French government disclosed that the Berkeley advice may well understate exposures. Some of the most popular smartphones emit up to 11 times as much radiation as permitted under outdated FCC radiation exposure guidelines when tested against the body.”
Extract from page two of a research article, link below:
“The use of cell phone in children is dangerous due to the closer proximity of the mobile phone to their brain compared to adults; the average RF exposure from its use is higher by a factor of 2 in a child’s brain and by a factor of 10 in the bone marrow of the skull.
Brain and bone marrow have a higher conductivity in children than in adults and receive a higher energy deposition from RF sources. With age, the bone marrow progressively incorporates more fat, and the bone itself increases in thickness, hardens, and loses water over time, thus making the tissues less vulnerable.”
The statement of 11 times the radiation exposure limit if used against the body, in the Berkeley Ordinance article, is for an adult sized body. This means the child dose equivalent above the regulatory limit would be much much greater, because their body size and head size is smaller than an adults.
Extrapolating from the information provided in the research paper, it would mean that the brains of children, using some of the most popular smartphones, would potentially be exposed to,
an equivalent of 11 X 2, or 22 times above the regulatory limit for their brains,
and
11 X 10, or 110 times greater for their skull bone marrow!
Every parent should be socked by this revelation!!
Research Article Link: (The full article can be downloaded as a PDF if you click the download PDF button, at the top left of the page, under the article heading.)
EnviroReporter.com’s 2019 Death Valley Radiation Roundabout
November 28, 2019
11:45 am PST INT STOVEPIPE WELLS DEATH VALLEY NATIONAL PARK RAIN: 74.1 CPM^^^ OR 1.9 TIMES PRIOR BACKGROUND
11:30 am PST INT STOVEPIPE WELLS DEATH VALLEY NATIONAL PARK BACKGROUND: 37.6 CPM^^^
November 27, 2019
1:10 pm PST EXT FURNACE CREEK DEATH VALLEY NATIONAL PARK HEADQUARTERS PARKING LOT BACKGROUND: 34.9 CPM^^
12:55 pm PST EXT FURNACE CREEK DEATH VALLEY NATIONAL PARK HEADQUARTERS PARKING LOT RAIN: 100.8 CPM^^ OR 2.9 TIMES SUBSEQUENT BACKGROUND NEAR THE CALIFORNIA HIGHWAY PATROL’S THRESHOLD OF THREE TIMES BACKGROUND TO INITIATE HAZARDOUS MATERIALS PROTOCOLS.
This hot rain reading pales in comparison to rains we sampled and tested in situ in Death Valley in 2013 where we found rain sizzling at up to 31.5 times background as reported in Boreas Storm Packs Radioactive Punch. That said, 2.9 times background is hot indeed. According to documentation reported on by EnviroReporter.com, the California Highway Patrol considers any material or situation over 3.0 times background to be the triggering level for a hazardous materials incident.
11:30 am PST INT STOVEPIPE WELLS DEATH VALLEY NATIONAL PARK: 42.2 CPM^^^
EnviroReporter.com’s 2019 Fall Sonoran Desert Badlands Radiation Detection Tour
October 30, 2019
EXT/INT SOUTHERN CALIFORNIA – Santa Ysabel, Ramona, San Pasqual Battlefield, Vista, Agra, San Onofre, Fountain Valley, Signal Hill, Carson, Santa Monica – NO RADIATION ABOVE BACKGROUND DETECTED
October 29, 2019
EXT/INT SOUTHERN CALIFORNIA – Vallecito, Mortero Wash, Anza-Borrego State Park – NO RADIATION ABOVE BACKGROUND DETECTED
October 28, 2019
EXT/INT SOUTHERN CALIFORNIA – Oasis, Sonoran Desert badlands, Agua Caliente, Sweeney Pass, Sonoran Desert – NO RADIATION ABOVE BACKGROUND DETECTED
October 28, 2019
EXT/INT SOUTHERN CALIFORNIA – Julian, Banner, Scissors Crossing, Great Southern Overland Stage Route, Sonoran Desert – NO RADIATION ABOVE BACKGROUND DETECTED
October 27, 2019
EXT/INT SOUTHERN CALIFORNIA – Los Angeles, Industry, Pomona, Chino Hills, Alberhill, Terra Cota, Temecula, Radec, Wynola – NO RADIATION ABOVE BACKGROUND DETECTED
October 27-30-7, 2019
EnviroReporter.com’s 2019 Fall Sonoran Desert Badlands Radiation Detection Tour
This short animation of Northern and Southern Hemisphere air circulation, shows why we can get detections so far south.
November 2019 day average background chart. (Month Average 110 cpm)
In the warmer months more tropical air flows to this location compared to the colder months. This November, our spring, we saw a small increase in local background levels compared to the winter months. Spring and summer up ticks in local background have become the new normal here since Fukushima. For comparison, this July’s month average was 107 CPM. http://sccc.org.au/wp-content/uploads/2019/11/Caloundra-local-average-background-radiation-levels-November-2019.jpg
Disclaimer: This is an amateur volunteer run service. Human error can provide incorrect information, and equipment malfunction can produce false readings. Do not rely on, or take action upon information presented on this web site, without further research.
Hello,
My name is Carolyn Tyler, and I firstly want to thank you for your dedication to this issue of environmental toxins.
I lived in Northridge, six miles from the SSFL and Rocketdyne, from 1956 to 1975. I lost five members of my family to cancer, and my one remaining family member (middle sister) has survived thyroid and breast cancers, starting when she was 20 in 1971. So far, despite testing with high levels of cesium, thallium, cobalt, vanadium, and rubidium in my system, I thankfully remain cancer-free.
When I first read about the meltdown in 1959, I was stunned, but it explained the cancer in my family (grandmother, mother, father, sister, niece, and brother-in-law) , and my neighbors’ families all around me. When I received my heavy-metal toxicity tests in 2014, I discovered that I also had extremely high levels of MANGANESE in addition to the radioactive isotopes, which stymied my doctors, since this element only stays in the body through inhalation of vapor or dust during welding or mining.
Through diligent sleuthing, one immunology researcher I met at a detox clinic in Bangkok found a third source of environmental manganese poisoning–rocket testing. He asked about my lifelong severe and chronic depression, which was noted in my chart, and said that “treatment-resistant chronic and severe depression, bipolar II”, along with Parkinsonism, dementia, and a host of other neurological disorders are associated with high levels of manganese, which migrates from the lungs to the brain. He recommended 2-5 years of intense chelation therapy using EDTA and zeolite clay solution to remove the heavy metals which included lead, arsenic, mercury, as well as the radiation. I added daily infrared sauna treatments, and was down to normal levels by 2016. As the doctor suggested, I weaned myself off antidepressants and have been depression-free for almost four years. This is clear proof to me that my depression was caused by toxic chemicals from Rocketdyne, since there was no other source or opportunity for exposure.
I am hoping you can help get the word out to people who lived in the Valley during the exposure years who may be suffering neurological problems and autoimmune disorders needlessly. I don’t think anyone else has figured out that particulate fallout from spent rocket fuel causes neurological problems including depression–at least I have not found anything online suggesting this, so this is very important news.
Please feel free to write to me with comments or questions at: carolyntyler@gmail.com, and please join my Facebook group: San Fernando Valley Secrets: What You Don’t Know CAN Hurt You for updates and info on how to get help.
Sincerely, Carolyn Tyler
20th October 2019 – Russia covered up explosion of Skyfall nuclear superweapon
Extracts:
“The explosion was caused by the Skyfall experiencing a criticality accident, an uncontrolled nuclear reaction that released a burst of radiation while Russian personnel retrieved it from the seafloor,” Mr. DiNanno said in an interview with The Washington Times.
The blast was set off after the fuel in the missile reactor was no longer cooled by seawater.
In the interview, Mr. DiNanno revealed further details about the incident. As part of the cover-up, he said, Moscow cut off the data gathered by a Russian nuclear monitoring station near the blast. That information is supposed to go to the International Monitoring System, a technical group based in Vienna that operates as a unit of the Comprehensive Test-Ban-Treaty Organization.
“From what I understand, the actual radiation cloud was not dangerous per se,” Mr. DiNanno said.
Here we have a reported nuclear criticality event that sent a radioactive cloud over populated areas in Russia.
“The reactor exploded Aug. 8 off the coast of the northern Russian town of Nenoska, killing seven Russians on a barge in the White Sea as they were overseeing the recovery of a sunken Skyfall.”
There was a twenty times background radioactive cloud detection at the distance of around 30k or 18 miles from Nemoska, in the Russia city of Severodvinsk at the time. This indicates that a significant amount of airborne radioactive contamination was released.
Beta radiation in west Los Angeles Basin air doubles in half the time of last testing period.
October 17, 2019
6:35 pm PDST INT RADIATION STATION SANTA MONICA DUST AGGREGATE FROM 3 HEPA FILTER MACHINES + VACUUM DUST/DEBRIS: 77.7 CPM^^ OR 82.4% ABOVE BACKGROUND
6:20 pm PDST INT RADIATION STATION SANTA MONICA BACKGROUND: 42.6 CPM^^
A Federal task force issued its report on 10/11/19 concerning the F.A.A.’s failure to adequately supervise Boeing and its new 737 MAX airliner. As we’ve seen so often with respect to Rocketdyne aka Santa Susana Field Lab, Boeing simply crushes its regulators.
This short animation of Northern and Southern Hemisphere air circulation, shows why we can get detections so far south.
September 2019 day average background chart. (Month Average 110 cpm)
There has been a slight increase in month average background level for September. This seasonal variation in local background levels has become a normal trend here since Fukushima. As we get more tropical air flows at this location in the warmer months, the local background increases, and then drops back down again in winter.
Disclaimer: This is an amateur volunteer run service. Human error can provide incorrect information, and equipment malfunction can produce false readings. Do not rely on, or take action upon information presented on this web site, without further research.
The “Western Governors Association” has complained to the U.S. Department of Energy about DOE employees making final plans for shipping nuclear waste across the country without getting input from each State’s employee/experts on that topic:
September 25, 2019
11:40 am PDST INT RADIATION STATION SANTA MONICA DUST AGGREGATE FROM 3 HEPA FILTER MACHINES + VACUUM DUST/DEBRIS: 65.8 CPM^^ OR 37.4% ABOVE BACKGROUND
11:30 am PDST INT RADIATION STATION SANTA MONICA BACKGROUND: 47.9 CPM^^
Throughout its 40+/- year history of involvement with the Rocketdyne property in Ventura County south of Simi Valley, the parent company of the property owner, Boeing, has been managed with a culture of arrogance and impunity which extended to the Rocketdyne property which Boeing renamed the “Santa Susana Field Lab” when it sold the rest of the Rocketdyne company to unrelated investors.
As Californians too many of us separated our ire at the owner of the Santa Susana Field Lab from our willingness to fly on Southwest Airlines, which flies an all Boeing fleet. In 2018 I flew on a brand spanking new Boeing 737 MAX 8 without any fear at all. I sat at the front of the cabin and was able to overhear a discussion between 3 Southwest Flight Attendants about the “new” internal features of the latest Boeing planes purchased by Southwest in comparison to earlier versions of the 737. Obviously those Flight Attendants had no idea there was anything wrong with the new 737 MAX 8.
After the new Boeing 737 MAX 8’s were grounded by the FAA, in comment sections at the bottom of the Washington Post’s news stories on the new 737 MAX 8, I would spot comments clearly written by airline pilots and aeronautical engineers which were emphatic in their criticism of Boeing’s senior managers. I would roll my eyes and say to myself “What they are seeing in the design and manufacturing of airliners is, in a sense, the same as what we have been seeing Boeing’s managers, officers and directors decide and do with the Santa Susana Field Lab and the “allegation” that radioactive fallout spread from the Field Lab property throughout the communities surrounding it continuing after 2000.
So far, the “national press” has not made any connection at all between alleged “regulatory capture” of the FAA by Boeing in connection with the FAA airworthiness certification process and the regulatory capture by Boeing of the California DTSC, Los Angeles Regional Water Quality Control Board (which is supposed to regulate L.A. and Ventura County property owners) and other California State agencies, as well as EPA, NASA and U.S. Dept. of Energy, all in connection with radioactive contamination on and around the Santa Susana Field Lab.
On September 18, 2019 “The New Republic” published the important report by Maureen Tkacik, linked below, about the relationship between Boeing and FAA and Boeing’s management arrogance. See:
That story of Boeing’s management decision making concerning the Boeing 737 MAX 8, as described in The New Republic story, is going to seem very familiar to Californians who follow the Santa Susana Field Lab story. Well down in The New Republic story the author and editors say “Indeed most of the Boeing response to the MAX disasters involved disseminating a kind of misinformation and doubt that makes the crashes look more complex than they really are.”
Conducting a disinformation campaign concerning a big problem. No surprise there.
After the second Boeing 737 MAX 8 crash, I spent some time looking at Boeing’s Income Statements and Balance Sheets which they had filed with the U.S. Securities & Exchange Commission. Those official financial records showed that at the time of the second crash Boeing was sitting on more than $1 Billion in cash. Of course they have some sort of liability insurance as well, though I haven’t found the amounts of the policy limits or deductibles. Since I’m familiar with the shorthand thinking of air and rail disaster plaintiff’s lawyers I figured that Boeing had more than enough cash and insurance to litigate their way through two airplane crash lawsuits, the thought that Boeing might be financially endangered by the occurrence of the the two crashes didn’t cross my mind.
Then came the grounding of the 737 MAX 8 airplanes, all of them.
In some jurisdictions, but not all, when there is a lawsuit between a large corporation and the family of a human being who was killed by the corporation’s negligence, the lawyers for the plaintiffs can explore through document production demands, document production subpoenas to third parties, written questions and “demands for admissions” which the defendant company must answer, and deposition testimony of the company’s line employees and management as well as independent witnesses, about what other negligent or wrongful acts the company’s senior management has been accused of engaging in during the recent past. A lot of that wrongful acts/repeated negligence evidence is used in connection with punitive damage claims relating to a defendant corporation’s “course of conduct” over many years and analogous circumstances.
If I were Boeing’s lead lawyer, I would advise their Board of Directors to pay and settle all of the claims of the families of the dead arising out of the two 737 MAX 8 crashes NOW. I would advise Boeing’s Board of Directorss to pay and settle, RIGHT NOW, all of the money claims of domestic and foreign airlines for their money damages arising out of the “defects in the 737 MAX 8s causing them to be considered by a jury to be defective products”, leading to the U.S. and foreign governments grounding of all of the 737 MAX 8s the airlines recently purchased. Making those settlements immediately would “shut the door” to statute and judge-compelled discovery concerning the Boeing Board of Director’s and managements policies in analogous circumstances.
I would advise Boeing’s Board of Directors to make those payments and settlements RIGHT NOW, even if Boeing’s liability insurance carriers are/were/would refuse to allow the settlements under the terms of Boeing’s insurance policies. I would advise immediate settlement even if those insurance companies would “deny coverage” if the settlements were made without the insurance companies consenting to the settlements. I would advise Boeing’s Board of Directors to ay those settlement amounts to minimize Boeing shareholders’ long term risk arising out of a 19+ year course of regulatory-capture conduct by the corporation’s senior management.
Boeing’s course of conduct in dealing with California and Federal agencies regulating the Santa Susana Field Lab and in dealing with the FAA concerning the Boeing MAX 8 appear to be nearly identical. https://www.youtube.com/watch?v=ewLM0zkoXFM
If the national/world press and the plaintiffs’ lawyers examining the crashes and grounding of the “new” Boeing 737 MAX 8s focus on Boeing’s long history of regulatory captures, such as the ones involving the Santa Susana Field Lab, “Katie Bar the Door”.
This short animation of Northern and Southern Hemisphere air circulation, shows why we can get detections so far south.
August 2019 day average background chart. (Month Average 108 cpm)
The last few months have been relatively quiet, with relatively low background levels. This has been the historical norm for the cooler winter months here.
Disclaimer: This is an amateur volunteer run service. Human error can provide incorrect information, and equipment malfunction can produce false readings. Do not rely on, or take action upon information presented on this web site, without further research.
More news from Arctic Russia near Finland. The nuclear accident there this summer might NOT have occurred during the testing of a nuclear powered missile. It may turn out that the missile was test fired, ended up at the bottom of a bay in the White Sea, and that the scientists who died from primary exposure to radionuclides were NOT exposed during the test firing.
Instead there’s a possibility the scientists were exposed as part of efforts by the Russians to pull the test missile up from the bottom of the White Sea. That news was reported by 3 reporters from Radio Free Europe. See:
Rachel Maddow has become interested in the stories about the nuclear accident at the White Sea. If you go on the internet and look for MSNBC’s broadcast of her show on 9/5/19 calling attention to the work of those 2 reporters you’ll find her discussion of the nuclear accident about 15 minutes into her show.
“According to three of the doctors, including both senior sources, one of the doctors flown to Moscow was found to have Caesium-137 — a radioactive isotope that is a byproduct of the nuclear fission of uranium-235 — in their muscle tissue. One of the sources said the affected doctor had told him so directly, though he was not informed about the amount or concentration of the isotope found. …….Last Friday, Aug. 9, the Baza news outlet, which has close ties to Russia’s security services, reported that men injured during the blast had been brought to a Moscow clinic for radiation sickness treatment. The outlet published a video of a convoy of police cars and ambulances travelling through the Russian capital.
13th August 2019 – Deadly Explosions Aside, Kremlin Says Putin’s Nuclear-Powered Missile Far Ahead Of US Technology
Quote:
“The maximum reported level of radiation would be harmless and on a par with a dental x-ray, according to Jonathan Cobb, a spokesman for the World Nuclear Association. ”
The radiation release was from a large explosion. This means that people exposed to this radioactive cloud as it passed through their area, would have breathed in radioactive contaminated dust and gases. Some of this material would also have been deposited as dust!
The external radiation dose levels reported do not represent the real health risks to the exposed populations. In a radioactive cloud event like this, the microscopic radioactive material potentially breathed in, is far more dangerous than any detected external dose level would indicate!
The 20x background detection only informs us that a significant radioactive cloud passed through. Other downwind communities would also have been exposed to this hazardous airborne radioactive material. Also, the toxic chemicals released from this type of explosion would add a significant multiplier of toxicity to this exposure.
By way of disclosure, I am 1/4 Norwegian. My great grandparents moved from Norway to Iowa in 1866. I have no relatives who are from Finland or Russia. My husband’s paternal grandparents emigrated from Brody and Sambir, in the Austrian Crown Province of Galicia (which had a Tsarist Russian eastern border) around 1905. All of the relatives who were left behind in 1905 died at the hands of the Soviets and the Third Reich. Today both of those small cities are in Western Ukraine, near the much larger formerly Austrian city of Lviv, Lwow, Lvov, Lemberg, all of them being west of Chernobyl. Neither of us, or our children are employed or politically active in any manner having to do with Russia or Ukraine. However my grandson Oleksei, age 7, does have a beautiful blond Russian girlfriend at his elementary school in Las Vegas, which has a reasonably large Russian and Ukrainian immigrant population, and from time-to-time a good Russian restaurant.
THE MOOD OF THE RUSSIAN/SOVIET PEOPLE DURING A NUCLEAR ACCIDENT
I was alive during the Chernobyl nuclear emergency. I took particular interest in the trials and tribulations of the ordinary Soviet people who lived near that nuclear power plant, or down-river heading towards Kiev. If you are interested in experiencing the mood of ordinary Soviet people in the aftermath of the accident and the meltdown, I suggest finding the novel called “Chernobyl Murders” written by Chicago based Ukrainian Michael Beres. Beres’ book is very atmospheric and moody. It tells the story of a woman scientist and her Kiev resident boyfriend as they try to avoid being herded into a displaced persons camp for the residents of Pripyat. Towards the end of the story, the Soviet law enforcement officials stop to have a good meal in a foreign cuisine at a Polish restaurant in Sambir, the same beautiful little Austrian-style city where my inlaws lived in 1904.
Also read Martin Cruz Smith’s novel “Wolves Eat Dogs” which is set in the forest surrounding Chernobyl and Pripyat many years after the nuclear accident. Cruz Smith is famous for writing “Red Square” and other succeeding books with the same character, a Soviet/Ukrainian policeman Arkady Renko, the son of a famous ethnic Ukrainian General in the Soviet Army who led a major group of Soviet forces during World War II. Cruz’s books about Ukraine and Russia are very moody and cosmic.
WHAT HAS LEAKED OUT ABOUT THE RUSSIAN GOVERNMENT’S RESPONSE TO THE EMERGENCY
As to the current status on the ground in the area around this 2019 accident site, the Russians are proceeding much like the Soviets did in the days after the Chernobyl accident. The first responders, including medical personnel, have been flown to Moscow for specialized medical treatment at one or more hospitals with medical experts on nuclear accidents. Many first responders quickly died, in Moscow, in the days after the Chernobyl accident.
The area around the nuclear accident site in 2019 has been cordoned off by Russian government officials. Russian scientists in the appropriate nuclear discipline are investigating what happened while others are trying to figure out what to do with the raw radioactive materials which have been released into the White Sea at Dvina Bay, onto the soil and trees in Karelia and into the ambient air.
Two days ago, Russian officials told the residents of the village nearest to the nuclear accident site, Nenoksa, that they were going to be evacuated “just for a few hours”. However the evacuation was cancelled a few hours later. Perhaps the village residents understand what happened to the residents of Pripyat and the villages immediately around and downstream from Chernobyl: They were told they had to evacuate “just for a few days”, but they were never allowed to return to their apartments and cottages to “get their stuff”.
USING MAPS TO UNDERSTAND WHAT IS GOING ON WHERE IN TERMS OF LOCAL HISTORY BEFORE AND AFTER THIS 2019 NUCLEAR ACCIDENT
Take a look at the map posted at the bottom of my August 14 comment on Radiation Conversation II below. I read in Al Jazeera online last night (8/14/19) that the Russians are trying to keep people and boats away from Dvina Bay which is the SOUTHERN-MOST bay which is part of the White Sea. Dvina Bay is also the southern shoreline where the White Sea – Baltic Canal begins. According to Al Jazeera the Russian government has “closed” Dvina Bay for at least a month.
Dvina Bay is the part of the White Sea where Russian nuclear scientists were conducting their experiment on a “platform” floating in the sea, a distance away from the shoreline. The explosion which killed the 7 scientists happened on the platform, which was near a little Russian village called Nenoksa on Dvina Bay’s south shore. (When I ran a search for Nenoksa through Google Maps, the program put up a map showing the village location. If you choose “satellite” while looking at Nenoksa you can see that the surrounding land is barren but not snow covered at this time of the year.)
Nenoksa is the village which the Russian government had decided to evacuate before they changed their minds. The New York times speculated that what was left of the nuclear reactor which was on that platform fell into the White Sea after the explosion, along with the Russian scientists. We can’t see the particular spot where all of them and what remained of their experiment can be said to have fallen into Dvina Bay in particular, but we know it is offshore from Nenoska.
While you’re looking at Nenoksa on Google Maps, also look for Severodvinsk, a small city with about 134,000 people. That’s where the Russian government has set up operations to deal with the consequences of the rocket explosion which occurred some time during daylight around August 8, 2019.
Al Jazeera also reported that the dead scientists had been taken to Sarov, the city where their families reside and where the main nuclear weapons research facility in Russia is located. Sarov is in the Russian region called Nizhny Novgorod Oblast, which is a long, long way away from Dvina Bay. Knowing that long distance one can conclude that the Russian scientists thought it was far too dangerous to test the missile/rocket near Sarov or other populated areas in Russia
Also take a look at the map of the area of Russia where this latest nuclear accident occurred,on the map from Wikipedia Commons in my other comment below. You’ll see Finland’s current eastern border. The vast majority of the land on the Russian side of that border, going all the way to the White Sea is called “Karelia”. It’s the same Karelia which was part of Finland in 1940, populated by so many Finns that they represented 1/3 of the Finnish economy that year.
However, in 1940 the Soviet Army invaded Karelia on the pretext that it was needed to stage Soviet troops to protect Leningrad (formerly and now St. Petersburg) from invasion by the Germans. The Finnish Army put up a good fight, using modern weapons like machine guns, trying to fight off the Soviet military. (There’s a good history of the Winter War on Wikipedia.) The Finns lost in what is now called the “Winter War” in 1941.
At that time of the Winter War, there was a dramatic exodus of Karelian Finns towards Helsinki, because they didn’t want to live under Soviet rule. After World War II the Soviets did not give Karelia back to the Finnish people and their government. While the Soviets tried to repopulate Karelia with their own people, the population of Russian Karelia is much lower today than it was in 1940, which is a good thing in terms of a large group of Finns not living smack-dab-up-against the part of the White Sea where the 2019 nuclear accident occurred. Unfortunately, in Karelia and Finland the winds often blow from the north east, meaning that the “Down Winders” from this latest nuclear accident are likely to be Finns as well as Russian residents of Karelia.
That down wind risk in 2019 is nothing new for Finns, Swedes, Norwegians, Danes and the Sami people of Lapland, all of whom have lived down wind, since the late 1940’s, from the Soviet/Russian version of the Nevada Nevada Test Site, called the Novaya Zemlya Test Site, located on the gigantic, two-island, mountainous Novaya Zemlya Archipelago, which is crescent shaped, gigantic “arc”island located in the part of the Arctic Ocean called the Barents Sea, to the north east of Norwegian and Russian Lapland, and not too far, as the wind blows, from Karelia.
The Novaya Zemlya Archipelago looks remote, almost uninhabited and cold, given its location in part of the Arctic Sea. The archipelago was first land-surveyed by Russians in 1930 and a Russian village settlement was built in the 1870’s.
The archipelago is made up of two main islands: Yuzhny Island to the south and the much larger Severny Island to the north. The seas around Novaya Zemlya were the sites of serious naval battles during World War II, far too interesting to write here. See Wikipedia for a quick summary of what happened is the sea there.
Severny Island is where the Russians’ outdoor nuclear test site is located on the west side of the island on the Sukhoy Nos Peninsula, which adjoins Mityshikha Bay, part of the Barents Sea. Unlike the treatment of the Pai people, the Navajo and the southern Utah Mormon down-winders, the Soviet government was gracious enough to move-out the local indigenous people, called the Nenets, in 1957, before the Russian outdoor nuclear tests began. By western intelligence at least 224 nuclear bomb tests occurred at the Novaya Zemlya Test Site on Severny Island. (Of those 224 nuclear bombs explosively tested, 2 were American nukes. Wouldn’t it be interesting to learn the details of that Russian-American joint experiment.)
The Novaya Zemlya Test Site is where, as part of experiments and military training, some of those 224 nuclear bombs were detonated in the open air, including the largest outdoor nuclear bomb explosion in history-to-date called the Tsar Bomba, which was exploded on October 30, 1961, nine (9) miles inland from Mityushikha Bay.
Other outdoor and underground nuclear bomb detonations and other nuclear experiments occurred throughout Severny and Yuzhny Islands through the 1990’s.
In September 1961 the Soviets shot 2 “propelled nuclear warheads” TOWARDS the Novaya Zemlya Test Site, which covers most of the two islands. Those nuclear warheads were shot from two places on the Soviet mainlands: (1) one called Salekhard (on the Russian mainland) and (2) one from a military airfield called Vorkuta Sovietsky which was located in the Komi Republic of the Soviet Union, located due south of Novaya Zemlya. It is said that after those two tests, the launch missile was moved by the Soviets to Cuba.
Interpreting the Russians’ actions in 2019, some in the nuclear industry suspect that the test missile which exploded in Dvina Bay was being tested there, rather than on Novaya Zemlya, as an attempt to obscure what the scientists from Sarov were doing. I doubt that is true.
While the Winter War of 1940-1941 caused great sorrow among Finns, at least in 2019 Finnish citizens are not living along Dvina Bay where the accidental ‘nuclear’ explosion occurred.
Ultimately it will be interesting to see if the Russians create a new Exclusion Zone in Karelia like the exclusion zones which exist around Chernobyl in modern day Ukraine encircling the former city of Pripyat, where the Chernobyl nuclear power plant and accident were located, and the exclusion zone encircling Fukushima Japan. Clearly the Finnish government and its people will be very unhappy, if the new exclusion zone extends all the way into Finland’s current sovereign territory.
If you’re the praying kind, say a prayer for protection of the health of the people of Scandinavia and Karelia.
Seven people died at the incident Nyonoksa. “Five representatives of nuclear power company Rosatom, and two people from the Russian Armed Forces, reportedly lost their lives while working with technical support of the isotope power source in a liquid propulsion system.”
It’s tough to write a comment for Americans concerning a significant event in modern Russia without starting with a geography and history lesson. Likely 99% of Americans have no clue where Lake Ladoga is in Russia, just as 99% of Russians have no idea where Lake of the Ozarks is here. Fortunately Wikipedia Commons has published a map of the Baltic area of Russia which we are free to copy and study. It is located below.
Early in the Russian people’s history Russia was essentially landlocked, with no access to navigable seas in Winter. In 1697 Tsar Peter I toured western Europe for 18 months. Among other things, Tsar Peter realized that European sovereigns with access to the sea for a navy and commercial shipping were substantially more affluent than rulers of landlocked countries.
Until 1703 the entire U shaped eastern coast of the Gulf of Finland (on the map below) was occupied by Swedes who were call Ingrians. On May 1, 1703 Tsar Peter’s army captured control of Ingria’s most strategic places, the Swedish fortress of Nyenschantz and the City of Nyen on the Neva River. The 40,000 Swedish Ingrians had no way to physically get back to Sweden where they would have been safe in the hands of the Swedish king. As a result Tsar Peter I turned those captured Swedes into serfs and worked them to death building the grand city of St. Petersburg 3 miles in from the Gulf of Finland (Part of the Baltic Sea) under the supervision of German and Dutch engineers he hired. Tsar Peter I designated St. Petersburg as the capital of Russia.
The Baltic Sea coast City of St. Petersburg was nurtured, improved and embellished by subsequent Tsars who kept it as the Russian capital. Access to the sea, and to world trade through the Baltic Sea allowed affluent Russian businessmen to increase their wealth through world trade.
After Tsar Nicholas II was deposed in 1917, the Bolsheviks led by Vladimir Lenin took control in the October Revolution,and Lenin moved Russia’s capital back to Moscow.
Historically Russia has had seaports on its northern coast abutting the Arctic Sea. However the winter weather being what it is, during his tenure as leader of the Soviet Union prior to World War II, Joseph Stalin decided to have Soviet laborers dig and build a ship canal from the White Sea (on the map below) to the Baltic Sea. The route chosen took advantage of naturally occurring lakes and rivers, and passed near urban Leningrad before entering the Baltic Sea. That “White Sea – Baltic Canal” was completed in 1933 and Soviet ship traffic began.
According to Russian author Aleksandr Solzhenitsyn that White Sea-Baltic Canal was constructed by forced labor of 126,000 Soviet gulag prisoners thousands of whom died during the construction process. The route of that White Sea-Baltic Sea Canal is shown on the red line on the map above. The Soviet/Russian people paid a very high price to create their White Sea – Baltic Canal.
History has proven that the bad consequence of man-made canals is that they allow unstoppable movement of chemicals, marine life and plants from one body of water to another.
That’s why the Great Lakes now have lampreys, a snake shaped garbage fish from the Atlantic who swam up the St. Lawrence Seaways canals and locks, and who feed by attacking fish of economic and sporting value like lake trout.
Canals connecting formerly disconnected bodies of water, like the Great Lakes and the canals and rivers that are located in the Great Lakes states are at risk of being invaded by the huge nuisance fish called the Asian carp. The carp got into the Mississippi River and have entered a man made canal connecting the Mississippi to Lake Michigan at Chicago. A massive effort is continuously being made in Congress and on the Great Lakes to stop the Asian carp from populating the lakes and killing off traditional lake fish.
In the late 1960’s fresh water chemists conducted extensive water tests from the Niagara River, attempting to determine the kinds of industrial chemicals in that drinking water source, and those chemicals’ locations of origin. The fresh water chemists found a cornucopia of chemicals identified as having traveled from as far away as Chicago and Milwaukee’s industrial areas as a result of the “natural” flow of water.
As we know from Enviroreporter’s extensive writing on water contamination in the Pacific Ocean near California, and in its fish used as human food, radionuclides are found in the fish and in the water which can be identified as being consistent with water run-off from the melted down nuclear reactors at Fukushima, Japan which sit at the edge of the Pacific Ocean.
On August 8, 2019 news reporting started to appear in the West indicating that there had been a nuclear accident next to or on the White Sea, near Arkangel’sk, shown on the map below. Later news stories indicated that the accident was caused when a large rocket, fueled by a nuclear reactor inside it, had exploded on a barge or dock in the White Sea.
That’s where the White Sea-Baltic Canal presents a big risk to the health and safety of Russian people, if radionuclides in the water of the White Sea enter the canal and head for the lakes and rivers forming the canal leading to the Baltic Sea. On route, those hypothetical radionuclides will contaminate the lakes and rivers incorporated into that canal. Worst case, radionuclides which have traveled through that canal will enter the Baltic Sea.
Russia’s neighbors around the Baltic Sea, Finland, Sweden, Denmark, Germany, Poland, Latvia, Lithuania and Estonia will not be very happy if they discover Fukushima style reactor melt down radionuclides contaminating their beloved and economically important Baltic Sea and its fish.
On August 13th the New York Times speculated that the nuclear reactor could have fallen into the White Sea and that the Russian government may plan to try to retrieve it in no small part to protect the waters of the White Sea from nuclear contamination like the seawaters off Fukushima.
Below is the map location of Nyonoksa and Severodvinsk in Northern Russia. Reportedly Nyonoksa is where the Russian experiment rocket exploded. Severodvinsk, where the 20x background detection occurred, is east of Nyonoksa. This indicates that the wind direction was westerly, at the time of the explosion.
The Russian press have played down the event, stating in one article that Finland’s monitoring system did not detect anything, thus implying that the event was insignificant.
“The claims of a radioactive cover-up have not been supported on the ground, and neighboring Finland has not registered any deviations from normal levels.”
The detection evidence indicates that the wind was heading Westward away from Finland. A twenty times background, at the distance of around 30k or 18 miles between Nyonoksa to Severodvinsk, indicates that a significant radioactive release occurred.
With several days of delay, the Russian authorities have revealed some details of the nuclear accident that occurred at a military base on the White Sea. At least five people lost their lives, with atomic radiation of up to 2.0 microsieverts per hour. The accident occurred on a platform in the sea. Rosatom said his employees had been tasked with running the “isotopic energy source” for a rocket that was being tested on the platform Some questions remained unanswered. For example, the authorities did not clarify whether Rosatom’s confirmed five deaths by its own employees must be supplemented by two deaths from specialists who were announced by the army shortly after the disaster. In addition, there were varying levels of atomic radiation levels – leading to panic buying of iodine tablets in the affected region. While normal background is around 0.11 µSv/h (microsivert per hour), the levels measured at the monitor on the Lomonosov Street near Lake Teatralnoye peaked at 2 µSv/h, nearly 20 times higher gamma radiation than normal.
Disclaimer: This is an amateur volunteer run service. Human error can provide incorrect information, and equipment malfunction can produce false readings. Do not rely on, or take action upon information presented on this web site, without further research.
Below is a link to a National Academy of Sciences published article on a significant leak of Ruthenium 106 into the environment in September 2017 “from” the multi-purpose Russian nuclear site called “Mayak” which is located in the countryside outside of the City of Ozyorsk, Oblast (State) of Chelyabinsk, Russia.
Where is Ozyorsk Russia? It is just 150 km south southeast of the City of Ekaterinburg, where the last Tsar and his family were executed at Ipatiev House in July 1918.
Ozyorsk and Ekaterinburg are far east of Moscow in the Ural mountain region, and due north of Kazakstan.
A cloud of Ruthenium 106 is said to have been released at Mayak in September 2017. In the Soviet era, Mayak was also the site of a major nuclear accident called the “Kyshtym Disaster” in 1957.
The cloud which traveled to Europe in 2017 was made up of Ruthenium 106, a byproduct of nuclear fission with a half-life of 374 days. During the “reprocessing” of “spent” nuclear fuel, the isotopes of Ruthenium 106 usually are separated from the radioactive plutonium and uranium taken from nuclear power reactors and kept in long-term storage with other radioactive waste byproducts.
July 29, 2019
4:15 pm PDST INT RADIATION STATION SANTA MONICA DUST AGGREGATE FROM 3 HEPA FILTER MACHINES: 69.8 CPM^^ OR 78.5% ABOVE BACKGROUND
4:15 pm PDST INT RADIATION STATION SANTA MONICA BACKGROUND: 39.1 CPM^^
2019 MICHIGAN RADIATION DETECTING TOUR – July 2, 2019 to July 20, 2019
July 2-3: LAX to O’Hare to Kalamazoo Airport, Michigan- Food + Environment test normal for radiation
July 4: Kalamazoo-area home and vicinity- Food + Environment test normal for radiation
July 5-6: Grand Haven, Michigan- Food + Environment test normal for radiation
July 7-10: Mears, Michigan – Food + Environment test normal for radiation
July 10-13: St. Ignace, Michigan (Upper Peninsula including Sault Ste. Marie, Michigan and Sault Ste. Marie, Canada) – Food + Environment test normal for radiation
July 13-16: Traverse City, Michigan – Food + Environment test normal for radiation
July 16-20: Southwest Michigan home and vicinity – Food + Environment test normal for radiation
July 20: Kalamazoo Airport to O’Hare to LAX – Food + Environment test normal for radiation
In Majak’s Russian nuclear facility in the southern Urals, a serious nuclear accident was believed to have occurred in September 2017, according to an international team of experts from 47 leading institutes. This reports the “Frankfurter Allgemeine Sonntagszeitung”. She refers to a report published by 69 scientists under the leadership of radio-ecologist Georg Steinhauser from the University of Hanover and French atmospheric researcher Olivier Masson in the American journal Proceedings of the National Academy of Science (PNAS). PNAS is one of the world’s leading science journals.
The accident, to which the researchers now allude, had led to a sudden appearance of the radioactive isotope ruthenium-106 in the atmosphere in large parts of Central and Eastern Europe.
Disclaimer: This is an amateur volunteer run service. Human error can provide incorrect information, and equipment malfunction can produce false readings. Do not rely on, or take action upon information presented on this web site, without further research.
60th Anniversary of Nuclear Meltdown Near Los Angeles to Be Commemorated July 13
Community event will call for the promised full cleanup of the Santa Susana Field Laboratory and include a memorial in honor of workers and community members harmed by exposure to the site’s contamination
On Saturday, July 13, community members who live near the Santa Susana Field Laboratory (SSFL) will hold an event to commemorate the 60th anniversary of the site’s partial nuclear meltdown and to rally in support of its long overdue cleanup. The event will take place from 10 a.m. – 12 p.m. at Rancho Tapo Community Park, 3700 Avenida Simi, Simi Valley, CA at the pavilions near the ballpark.
SSFL is a former nuclear reactor and rocket-engine testing facility located in the hills above the Simi and San Fernando Valleys. On July 13, 1959, power began to rise rapidly in the core of the Sodium Reactor Experiment (SRE). Operators barely managed to shut it down, but a few hours later, without determining the cause of the incident, inexplicably started it up again and let it run for 10 more days. By the time the SRE was finally shut down, a third of its fuel had experienced melting. Because it had no containment structure, radioactivity was released directly into the environment.
The SSFL meltdown was kept secret for two decades, until it was discovered by UCLA students and their instructor, Dan Hirsch, who brought it to public attention. Hirsch, now retired director of the Program on Environmental and Nuclear Policy at UC Santa Cruz and President of the nuclear policy organization Committee to Bridge the Gap, said a lack of candor and disregard for public safety has characterized much of the site’s operations.
“The Atomic Energy Commission issued a news release weeks after the accident merely saying that a ‘parted fuel element’ had been observed,” said Hirsch. “They didn’t admit that 13 out of 43 fuel rods melted, or that they’d intentionally vented radioactivity into the air for weeks. This kind of reckless continued for decades, with little concern for workers and nearby communities. Such disregard continues to this day, with the contamination still not cleaned up.”
SSFL remains contaminated with dangerous radionuclides including strontium-90, cesium-137, plutonium-239 and toxic chemicals such as trichloroethylene (TCE), perchlorate, dioxins and heavy metals. Federally-funded studies indicate increased cancers among site workers, elevated cancer rates in the nearby community associated with proximity to SSFL, and that contamination migrates off of the site over EPA levels of concern.
“Exposure to contaminants that are known to exist at SSFL can cause cancers and leukemias as well as developmental, genetic, neurological, and immune system disorders,” said Dr. Robert Dodge, President of Physicians for Social Responsibility-Los Angeles, a public health advocacy group that has worked for a full SSFL cleanup for over 30 years.
In 2010, the California Dept. of Toxic Substances Control signed agreements with the U.S. Dept. of Energy and NASA to fully clean up their parts of SSFL by 2017. The Boeing Company, which owns most of the site, is similarly bound by a 2007 Consent Order to have completed cleanup by 2017. However, the promised SSFL cleanup has not even begun, and the parties responsible for the contamination are now pushing to leave about 98% of the contamination not cleaned up.
“Since when do polluters get to decide how much of their mess they clean up?” said Marie Mason, Simi Valley resident and co-founder of the Rocketdyne Cleanup Coalition, which has been fighting for full cleanup since 1989. “They don’t, it’s illegal. But the SSFL cleanup has been one broken promise after another, and all the while contamination comes off that hill and into our neighborhoods. Just last fall, the Woolsey Fire started at and burned most of the site, risking increased exposures to SSFL’s pollution. It’s got to get cleaned up.”
Newer activists like Melissa Bumstead, a West Hills resident whose daughter has twice survived a rare leukemia and who has mapped over 50 other rare pediatric cancers near SSFL, are bringing fresh energy and new voices into the cleanup fight. Bumstead’s Change.org petition has now been signed by over 650,000 people and she is hoping the July 13 event will help galvanize the community to fight for the full, promised cleanup.
“As we look back at the meltdown anniversary, we also have to look forward and get more people involved in fighting for the cleanup. Rock the Cleanup will be a family friendly event, with informative speakers, games, and fun activities like rock-painting, We’ll use those rocks to create memorials to those harmed by SSFL. We have seen some positive steps from our elected officials recently, but more – many more – people have to speak out if we are ever going to get the 100% cleaned up that we were promised.”
Parents vs. SSFL is a grassroots group of concerned parents and residents who demand compliance with cleanup agreements signed in 2010 that require a full cleanup of all radioactive and chemical contamination at the Santa Susana Field Laboratory.
The Rocketdyne Cleanup Coalition, or RCC, is a community-based alliance dedicated to the cleanup of the Santa Susana Field Laboratory (SSFL), commonly known as Rocketdyne.
Physicians for Social Responsibility-Los Angeles (PSR-LA) works to protect public health from nuclear and environmental threats and has worked for the full cleanup of SSFL for over 30 years.
The Committee to Bridge the Gap is a non-profit nuclear policy organization focusing on issues of nuclear safety, waste disposal, proliferation, and disarmament.
Denise, many congratulations on being awarded the prestigious “Bill Mitchell Grassroots Activist Award” from the Alliance for Nuclear Accountability.
Well deserved!
Our superb editor and website maven, Denise Duffield, is an amazing person who really rocks the house, this time in Washington D.C. lobbying for the full – and promised – cleanup of the Santa Susana Field Laboratory and spearheading the Back from the Brink campaign to abolish nuclear weapons in all its many facets. Adding to her many accomplishments is her being awarded the prestigious Bill Mitchell Grassroots Activist Award from the Alliance for Nuclear Accountability for her superb work, past present and future! Here’s to the best editor (and wife for that matter) this journalist will ever have!
Disclaimer: This is an amateur volunteer run service. Human error can provide incorrect information, and equipment malfunction can produce false readings. Do not rely on, or take action upon information presented on this web site, without further research.
May 24, 2019
7:45 pm PDST INT Radiation Station Santa Monica California BACKGROUND- 38.4 CPM^
7:30 pm PDST INT Radiation Station Santa Monica California – RSSMC dust from 3 HEPA filters: 66.5 CPM^ which is 73.2% above subsequent background
May 22, 2019
3:05 pm PDST INT Radiation Station Santa Monica California THUNDER LIGHTNING THEN RAIN– 62.0 CPM^ OR 35.4% ABOVE BACKGROUND
2:50 pm PDST INT Radiation Station Santa Monica California BACKGROUND – 45.8 CPM^
May 18, 2019
10:30 pm PDST INT Radiation Station Santa Monica California RAIN- 40.6 CPM^ below background
9:30 pm PDST INT Radiation Station Santa Monica California – 42.7 CPM^
This short animation of Northern and Southern Hemisphere air circulation, shows why we can get detections so far south.
April 2019 Report. (Month Average 108 cpm)
As we move into the cooler months here in the Southern hemisphere, the month average background levels decrease. This seasonal variation in background happens every year as we get more southern ocean air flows in the cooler months. In the warmer months we get more tropical air flows.
Disclaimer: This is an amateur volunteer run service. Human error can provide incorrect information, and equipment malfunction can produce false readings. Do not rely on, or take action upon information presented on this web site, without further research.
April 29, 2019
12:30 am PDST INT Radiation Station Santa Monica California RAIN- 41.5 CPM^ below background
12:20 am PDST INT Radiation Station Santa Monica California – 45.2 CPM^
EnviroReporter.com‘s 2019 Radiation Station Santa Monica California Spring Cleaning
April 13, 2019
7:15 pm PDST INT Radiation Station Santa Monica California BACKGROUND- 41.0 CPM^
7:00 pm PDST INT Radiation Station Santa Monica California – RSSMC Spring Cleaning dust from 3 HEPA filters and vacuumed in-structure dust and fine particulate matter: 56.1 CPM^ which is 36.8% above subsequent background
April 7, 2019
EXT/INT SOUTHERN CALIFORNIA – Santa Ysabel, Ramona, San Pasqual Battlefield, Vista, Agra, San Onofre, Fountain Valley, Signal Hill, Carson, Santa Monica – NO RADIATION ABOVE BACKGROUND DETECTED
April 6, 2019
EXT/INT SOUTHERN CALIFORNIA – Vallecito, Mortero Wash, Anza-Borrego State Park – NO RADIATION ABOVE BACKGROUND DETECTED
April 5, 2019
EXT/INT SOUTHERN CALIFORNIA – Oasis, Sonoran Desert badlands, Agua Caliente, Sweeney Pass, Sonoran Desert – NO RADIATION ABOVE BACKGROUND DETECTED
April 5, 2019
EXT/INT SOUTHERN CALIFORNIA – Julian, Banner, Scissors Crossing, Great Southern Overland Stage Route, Sonoran Desert – NO RADIATION ABOVE BACKGROUND DETECTED
April 4, 2019
EXT/INT SOUTHERN CALIFORNIA – Los Angeles, Industry, Pomona, Chino Hills, Alberhill, Terra Cota, Temecula, Radec, Wynola – NO RADIATION ABOVE BACKGROUND DETECTED
This short animation of Northern and Southern Hemisphere air circulation, shows why we can get detections so far south.
March 2019 Report.
We finally received around 300mm of rain in March, decent rain after an exceptionally dry period.
Towards the latter part of March, around when the rain started, a number of very short detection spikes showed up in the 24 hour charts.
Below are examples of a couple of the larger spike detections.
It is normal to occasionally get background spikes, three times background or less. These detections were less than three times background, so are probably not anything to be concerned about.
Disclaimer: This is an amateur volunteer run service. Human error can provide incorrect information, and equipment malfunction can produce false readings. Do not rely on, or take action upon information presented on this web site, without further research.
A noteworthy KCRW news feature by veteran Jenny Hamet has hit the airwaves and online. “Families affected by cancer want state officials to lead cleanup of Santa Susana” has heartbreaking interviews and provides an excellent introduction to the sordid environmental history of the Santa Susana Field Laboratory. Boeing, NASA and the Dept. of Energy all declined taped interviews but issued grandiose statements despite estimates that they will leave 98% of the radioactive and chemical contamination at the future “Glow in the Dark Park.” SSFL cleanup activists are a fearless and inspiring lot in this most capable multimedia piece.
March 20, 2019, 2019
9:55 am INT Radiation Station Santa Monica California RAIN SAMPLE: 46.7 CPM^^ OR 16.2% ABOVE NORMAL BACKGROUND RADIATION
9:40 am INT Radiation Station Santa Monica California BG: 40.2 CPM^^
March 5, 2019, 2019
10:50 pm INT Radiation Station Santa Monica California RAIN SAMPLE: 43.0 CPM^^ OR NORMAL BACKGROUND
10:35 pm INT Radiation Station Santa Monica California BG: 45.3 CPM^^
This short animation of Northern and Southern Hemisphere air circulation, shows why we can get detections so far south.
Note: As of 2019, day local background average will now be charted in Counts Per Minute (CPM), not uSv/hr. The new monitoring equipment now being used is a SBT-10 pancake probe, it generally averages 110 CPM. This is around ten times greater CPM sensitivity than the old GammaScout Geiger counter that was previously used for background monitoring here.
January 2019 Report.
It was a hot, dry, and sometimes humid January here. We generally get significant rain in January, and January is usually the start of our wet season. This January ended up being the driest on record, with an insignificant 0.4mm of rainfall. There are no radiation events to report, all calm and stable.
Disclaimer: This is an amateur volunteer run service. Human error can provide incorrect information, and equipment malfunction can produce false readings. Do not rely on, or take action upon information presented on this web site, without further research.
15th January 2019 – “Nuclear: Dangerous, A Failed Technology” – Former Nuke Regulatory Chief Greg Jaczko Goes Rogue
Extracts:
Greg Jaczko, the former Chair of the Nuclear Regulatory Commission, has published an explosive new book: Confessions of a Rogue Nuclear Regulator. In it, he gets honest with the American people about the dangers of nuclear technology, which he labels “failed,” “dangerous,” “not reliable.” He particularly comes down against nuclear as having any part in mitigating the problems of climate change/global warming.
In this extended Nuclear Hotseat interview, Jaczko brings us inside the NRC’s response to Fukushima, the “precipice” on which nuclear safety balances, his own growing doubts about how safe nuclear reactors are in the United States, and how, ultimately, it was that concern with safety that probably brought him down.
Comment:
I can not see how anyone could call multiple nuclear meltdowns and explosions at Fukushima, a controlled cold shutdown of the nuclear reactors. Another fairy tale put forward by the nuclear industry to make it appear to the public that they have the situation under control at Fukushima.
The nuclear industry is spreading a fairy tale on the Internet and in main stream media, that no one has died from, or contracted cancer, as a result of Fukushima.
“There were 2,202 disaster-related deaths in Fukushima, according to the government’s Reconstruction Agency, from evacuation stress, interruption to medical care and suicide; so far, there has not been a single case of cancer linked to radiation from the plant.
That is prompting a shocking reassessment among some scholars: that the evacuation was an error. The human cost would have been far smaller had people stayed where they were, they argue.”
————————————————
FACT, a huge number of thyroid cancers, injuries and fatalities have resulted from the Fukushima nuclear catastrophe. Here we have a large list of reports from independent sources that do not have a financial interest in nuclear. These reports tell the true story, not an industry created fairy tale!
HOT HOLIDAY MIDWEST SNOW RADIATION DEFIES EXPLANATION
Defying explanation, EnviroReporter.com detected hot snow in Southwest Michigan at 5.7 times natural radiation background over the holidays that wasn’t from radon progeny, the likely ‘burps’ of periodic nuclear power plant gas releases or radioactive remnants from coal-fired plants on Lake Michigan. This extremely high reading, the highest taken in any media since EnviroReporter.com began measuring Midwest radiation in 2010, would seem to come from an extremely short-lived isotope we can’t identify with a half-life of about 84 minutes. This head-scratcher leaves us little to impart to our readers other than to say it is unlikely anyone made snow cones out of this hot frozen precip so there seems little to worry about from a public health perspective.
January 2, 2019
5:00 pm EST Southwest Michigan 1st floor room SNOW: 91.9 CPM^ or 143% OVER BACKGROUND
4:45 pm EST Southwest Michigan 1st floor room background: 37.9 CPM^
2019
December 31, 2018
11:25 am EST Southwest Michigan 1st floor room RAIN: 61.7 CPM^ or 70.9% OVER BACKGROUND
11:10 am EST Southwest Michigan 1st floor room background: 36.1 CPM^ December 29, 2018
9:50 pm EST Southwest Michigan 1st floor room FRESH SNOW FROM SECOND SNOW OF DAY/NIGHT: 67.9 CPM^ or 76.8% ABOVE BACKGROUND
9:20 pm EST Southwest Michigan 1st floor room background: 38.4 CPM^
10:30 am EST Southwest Michigan 1st floor room NEW & OLD SNOW: 37.4 CPM^ or background
9:50 am EST Southwest Michigan 1st floor room NEW SNOW: 33.7 CPM^ or background
9:35 am EST Southwest Michigan 1st floor room background: 32.8 CPM^ December 28, 2018
7:40 pm EST Southwest Michigan 1st floor room SNOW: 211.4 CPM^ or 5.67 TIMES BACKGROUND, NEARLY DOUBLE THE CALIFORNIA HIGHWAY PATROL’S THRESH HOLD OF THREE TIMES BACKGROUND TO INITIATE HAZARDOUS MATERIALS PROTOCOLS.
7:25 pm EST Southwest Michigan 1st floor room background: 37.3 CPM^
5:35 pm EST Southwest Michigan 1st floor room SLEET: 70.9 CPM^ or 92.1% OVER BACKGROUND
5:30 pm EST Southwest Michigan 1st floor room background: 36.9 CPM^
12:30 pm EST Southwest Michigan 1st floor room background: 37.6 CPM^ December 27, 2018
6:15 pm EST Southwest Michigan 1st floor room RAIN: 40.6 CPM^ or background
6:00 pm EST Southwest Michigan 1st floor room background: 39.0 CPM^ December 26, 2018
4:20 pm EST St. Joseph Michigan 6th floor room background: 32,8 CPM^
11:05 am EST St. Joseph Michigan 6th floor room background: 34.1 CPM^ December 25, 2018
11:35 pm EST St. Joseph Michigan 6th floor room background: 31.6 CPM^
More short duration background radiation spikes were detected here in December. The evidence below points to a couple of possible sources.
A. Cosmic ray burst?
At times during some of these detections the planetary Kp index levels were at near zero, or at zero levels. This means at these times there were very low solar wind levels and potentially high cosmic ray activity, pointing to a possible cosmic ray source.
B. Hot particle passing by the sensor or noble gases that were undergoing decay?
The wind maps below show that during each detection the surface wind was coming off the Pacific Ocean. In each instance, upper atmosphere high pressure system air was being draw down into the low pressure systems. This points to upper atmosphere radioactive contamination, possibly being drawn down to the surface.
2nd December
Originally suggested that this December 2nd spike was from a local fire event, the most recent evidence points to other possibilities.
Disclaimer: This is an amateur volunteer run service. Human error can provide incorrect information, and equipment malfunction can produce false readings. Do not rely on, or take action upon information presented on this web site, without further research.
4:55 pm INT RSSMC HEPA FILTER DUST FROM 3 MACHINES FOR 18 DAYS: 165.4 CPM^^ OR 4.39 TIMES BACKGROUND. Over 6 times higher on per day average than previous HEPA dust measuring period.
4:20 pm INT RSSMC BG: 37.7 CPM^^
Until the unit here became unreliable in mid September 2018, the GammaScout Geiger make of Geiger counter was used for local background monitoring. It was replaced with a different make and model of detection equipment, with different tube sensitivities.
Spike in Background
The chart screen shot below is from the Caloundra Australia monitoring station, from the 1st December to the 2nd December 2018.
This significant spike in background radiation level occurred just after midnight on the 2nd December.
Note: The chart vertical axis is in nSv/hr, so divide by 1,000 to get uSv/hr. The peak is close to 0.375 uSv/hr, Which is around three times the average background for this location.
There were major fires burning North of here at the time. This Nullschool wind map below shows the wind direction and particulate overlay at the time. The green dot on the map marks the approximate location of the detection.
Here are three possibilities that have been put forward for the source of this local spike in background.
Disclaimer: This is an amateur volunteer run service. Human error can provide incorrect information, and equipment malfunction can produce false readings. Do not rely on, or take action upon information presented on this web site, without further research.
I have exited the foothills of central California. Hopefully for cleaner air. I felt I had to exit as my friends all seemed to be getting ill from a lot of various stuff, like Valley Fever. Weakened immune systems is my guess.
The problem as I see it is that you can run but you can’t hide from the insidious spread of radioactive contamination and it’s potential damage to future generations of all living things.
December 5, 2018
6:55 pm INT RSSMC RAIN SAMPLE: 47.7 CPM^^ OR BACKGROUND
6:35 pm INT RSSMC HEPA FILTER DUST FROM 2 MACHINES FOR 26 DAYS: 75.5 CPM^^ OR 77.2% ABOVE BACKGROUND
6:05 pm INT RSSMC BG: 42.6 CPM^^
March 11, 2011 through June 2, 2017 and counting: EnviroReporter.com has produced more than 9,249 special tests and original reports including 3,045 measurements and analyses from nine affiliated Radiation Stations and 6,204 samples and radiation experiments from Radiation Station Santa Monica California. EnviroReporter.com has over 2,200,724 readers and 1,580,275 viewers along with the 24,369 people who have seen Radiation Station Glendale California‘s continuous online streaming. Over 213,751 viewers have watched 101 original videos on our YouTube channel. Thanks to you, we’ve received 7,847 comments and tens of thousands of Facebook ‘likes’ for our site, investigations and Facebook channel. Thank you for your continuing interest and support.
The living laboratory that is Death Valley has provided EnviroReporter.com a great place to test for radiation and this Thanksgiving holiday was no different. All air, water and food readings, documented here and in Eat Me! came in normal. That’s not always the case. Radioactive rains in the national park were staggeringly hot in 2013 as we exposed in Boreas Storm Packs Radioactive Punch:
The rare sustained precipitation tested over 31.5 times normal background radiation levels outside of the park’s visitor’s center in Furnace Creek November 23. Earlier in the day, rain radiation in Stovepipe Wells 24 miles northwest of Furnace Creek registered 29.7 times background. Boreas rain tested November 22 at the same Stovepipe Wells location in the morning came in at 4.6 times normal. Over 40 miles to the south that same day, the rain came in over 26.7 times the background of the area which is at 282 feet below sea level and called, appropriately enough, Badwater.
Luckily, the temperate 2018 radiation readings didn’t dampen the excitement of being in the hottest place on Earth.
November 25, 2018
10:05 am INT DEATH VALLEY STOVEPIPE WELLS [14′ above sea level] BG: 34.4 CPM^^
November 24, 2018
10:15 am INT DEATH VALLEY STOVEPIPE WELLS [14′ above sea level] BG: 36.6 CPM^^ November 23, 2018
11:30 am INT DEATH VALLEY STOVEPIPE WELLS [14′ above sea level] BG: 41.3 CPM^^
November 22, 2018
11:15 am INT DEATH VALLEY STOVEPIPE WELLS [14′ above sea level] BG: 39.8 CPM^^ November 21, 2018
11:40 am INT DEATH VALLEY STOVEPIPE WELLS [14′ above sea level] BG: 36.2 CPM^^
2018 13% above pre-Fukushima average
2017 32% above pre-Fukushima average
2016 22% above pre-Fukushima average
2015 12% above pre-Fukushima average
2014 14% above pre-Fukushima average
2013 25% above pre-Fukushima average
2012 19% above pre-Fukushima average
Monthly and yearly average charts from 2007 to 2018.
Disclaimer: This is an amateur volunteer run service. Human error can provide incorrect information, and equipment malfunction can produce false readings. Do not rely on, or take action upon information presented on this web site, without further research.
“The state agency says it will check out the air monitoring equipment around the defunct lab as soon as fire department officials allow access.”
I was there at 3:30PM Friday. The Fire department was not blocking access to anyone.
Then the claim we updated to state that over the weekend that the samples came back clean.
Let me get this right with you all. If the samples came up bad it was already too late. The fire had already burned to the coast and exposed everyone. Yet, many people returned to clean up the ash and mess shortly after.
So, if there was an issue, it would not of been prevented and if it was hidden exposure risk was actually increased.
Perhaps all those people with the money that were affected will care now?
1. Are you suggesting that if you can no longer smell it, then the possible toxic particles are no longer in the air?
2. If I hose down everything outside my house, that water still goes somewhere. So if I hose off the swingset for the kids, all of the water and possible toxic particles ends up in the dirt. What do you do about that? OR if I hose off a side of the house, all of those potentially toxic particles ends up in my driveway, etc. etc.
3. Are you suggesting that if I grow fruits/vegetables outside then I can simply wash it with warm warm to be safe? I was planning to never eat another lemon, orange, etc. from my trees. Am I being too cautious?
4. Who would I even contact to do testing on my property to check for all of the possible toxic contaminants that might be there?
@Noel Wauchope: Pure hooey. How can one discern no level of radiation unless sealed in a lead box? There is always background radiation, something the creators of this ‘all’s safe’ don’t seem to know. Do not trust statements like this.
There is an ongoing Woolsey Fire Contamination Coverup that EnviroReporter.com is in the process of exposing. Stay tuned.
The U.S. Department of Energy, its contractors and the California Department of Toxic Substances Control inspected the site on Sunday, Nov. 11 and determined that Area IV and the Northern Buffer Zone was untouched by the fire.
santa susana Officials: Santa Susana Nuclear Site Safe From Woolsey Fire
View of Area IV and DOE buildings which remain undamaged from fire. (DOE)
The Los Angeles County Department of Public Health also performed an assessment of the site and found “no discernible level of radiation in the tested area.”
@kat: Working backwards, we’ll address safety then length of threat. While we’re in the process of building a post-Rocketdyne Fire decontamination resource, a few quick ideas. If you can smell it outside still – and you probably can if within several miles of the burn – then wear an N95 mask outside (kids too). Avoid outside activity and kids stay inside. Clean up around house exterior and yards by hosing down everything from the top down to remove soot ONLY IF THERE IS PLENTIFUL WATER and there probably isn’t yet. Careful when sweeping to keep soot from cleanup clothes out of home/office. Drive with recirculation air ON and get car ionizer for air cleaning. Wash all fruit and vegetables grown and harvested outside in warm water and do it well. More on this to come so stay tuned but that will get you started.
“How long do all the toxic elements stay in the air?” is a good question. About 6-7 weeks tops HOWEVER this same dust get recirculated up into the air again and again. We wrote about the science of this in No Place to Hide – Fukushima Fallout Findings Widespread:
According to a 2007 University of Tennessee Department of Nuclear Engineering health physics report, “radioactive particulate matter is carried in air within dust particles.” Once a particle or aerosol is suspended in the air at any elevation it can be removed, altered or destroyed but can’t remain in the atmosphere indefinitely, according to Dr. James Dorsey of the University of Manchester where Dorsey earned a PhD in Atmospheric Physics in 2002. “Clearly the lifetime of any particular particle depends on its size and location,” Dorsey wrote. “Larger aerosol settle out of the atmosphere very quickly under gravity, and some surfaces are more efficient at capturing aerosol than others.”
&
In dry environments, where very small radioactive particles have no effective path to deposition over land or water bodies, nanoparticles join together in a process known as coagulation. These tiny particles, smaller than 100 nanometers, collide into each other due to forces that include electrostatic attraction, phoretic effects like that of heavier particles on lighter ones and transport of a particle due to temperature gradients where the particle moves from a high temperature to a low one. There is also Brownian diffusion which is the effect of thermal random motion on these particles.
Though complicated, these methods are how particles combine and fall to earth. Indeed, the drier the environment, the easier it is for particles to stick together because they don’t have to ‘squeeze’ the water molecules out first to join together. “In the kinetic regime, coagulation is always enhanced due to the absence of viscous forces,” according to Dorsey. That means Fukushima fallout would better bind with spewing aerosol trails better in drier climes like the desert than wet ones.
How long do all the toxic elements stay in the air? Does it eventually get blown all over the valley and somehow dissipate? Does it remain on everything it lands on,, the plants, streets, dirt, etc.? Trying to figure out how long a mask may be necessary and if everything getting hosed off around my house may help or if there is anything that can be done to make my house and yard safer for kids? Thanks.
@Crystal lane: Yes, for the region. Check out Los Angeles, CA RadNet readings. Note that the gamma graph reflects a significant bump during the fire days though that isn’t proof it was caused by the fire.
There will be a collection of potentially radioactive soot from downwinders for testing – keep an eye on EnviroReporter.com for further details.
Does anyone have any radiation readings downwind from the fire so we have some kind of definitive numbers to give to people for preparing them to do what they can do for protection ?
There is no one you can force to test the air. You can deduce that if we say it contains toxic fumes, it does, as do most wildfires especially one that just roared through Rocketdyne.
ONGOING UPDATES – SANTA SUSANA FIELD LABORATORY/ROCKETDYNE ON FIRE
It has burned before – SSFL in 2005
5:00 pm Thursday Nov. 8, 2018 MICHAEL COLLINS/ENVIROREPORTER.COM BREAKING NEWS:
KTLA’s coverage shows the fire above Brandeis-Bardin burning through Area III with Area IV catching fire. Wind is blowing strong to the southwest carrying toxic smoke towards Ahmanson Ranch, the 101 Freeway, Liberty Canyon, Conejo Valley, Santa Monica Mountains and Malibu, potentially. This is a very dangerous event. All people who can smell the smoke from this fire should get themselves, their children, and pets inside and immediately close windows and use filtered air conditioning if possible. Masks should be worn and extreme care dealing with ash and embers. This is not a drill – ACT NOW
3:00 pm Friday Nov. 9, 2018 MICHAEL COLLINS/ENVIROREPORTER.COM UPDATE:
Television coverage showed the fire sweep through Areas II, III and nuclear Area IV. Since it is called the “Woolsey Fire,” it suggests it started there and probably burned Area I too in its march to the Pacific Ocean. If you are fortunate enough not to have lost property in this disaster, and live anywhere near this area of the fire and can still smell smoke and/or char over the next few days, MASK UP with at least an N95 mask and be very careful cleaning up the soot and ash once the fire is over. Do NOT let kids do the dirty work considering the potential pollutants in this fire soot, ash and debris. YOU do it AFTER the fires are fully out.
THIS FIRE IS STILL ACTIVE IN THE SSFL AREA AND SIMI HILLS. Mask up, keep kids and pets inside, use HEPA filters in air conditioners or stand alones and OFFER HELP TO YOUR NEIGHBORS. N95 MASKS FOR EVERYONE ON YOU!
5:30 pm Friday Nov. 9, 2018 MICHAEL COLLINS/ENVIROREPORTER.COM UPDATE:
ACTIVE FIRE ATTACKING AREA I OF SSFL – Christina Walsh’s video from about an hour ago shows the fire going up “IEL fault canyons” which is at the Area I entrance to SSFL. This area has had massive contamination and, on fire, is especially dangerous. Area residents must AVOID SMOKE, FIRE, EMBERS AND ASH and use N95 masks.
6:10 pm Friday Nov. 9, 2018 MICHAEL COLLINS/ENVIROREPORTER.COM UPDATE:
Physicians for Social Responsibility-Los Angeles (PSR-LA), longtime advocates for the complete cleanup of the Santa Susana Field Laboratory, issued a Nov. 9, 2018 PSR-LA press release called Woolsey Fire Burns Nuclear Meltdown Site that State Toxics Agency Failed to Clean Up. The two-time Nobel Peace Prize winning group minced no words.
Dr. Robert Dodge, President of Physicians for Social Responsibility-Los Angeles, shares the community’s concerns. “We know what substances are on the site and how hazardous they are. We’re talking about incredibly dangerous radionuclides and toxic chemicals such a trichloroethylene, perchlorate, dioxins and heavy metals. These toxic materials are in SSFL’s soil and vegetation, and when it burns and becomes airborne in smoke and ash, there is real possibility of heightened exposure for area residents.”
Dodge said protective measures recommended during any fire, such as staying indoors and wearing protective face masks, are even more important given the risks associated with SSFL’s contamination. Community members are organizing a campaign on social media to demand that DTSC release a public statement revealing the potential risks of exposure to SSFL contamination related to the fire.
8:15 pm Thursday Nov. 8, 2018 MICHAEL COLLINS/ENVIROREPORTER.COM BREAKING NEWS:
Minutes ago, a fire flare up along Alpha Road in Area II was spotted by us on excellent KABC Eyewitness News coverage. We captured it via a screen shot save, below. What it shows is that a new flare-up is near the middle of SSFL which cannot be good. Also not good was what wasn’t in any of the video of briefly flying over part of the lab – fire engines.
EnviroReporter.com‘s Denise Duffield joined 2017 Nobel Peace Prize winner Beatrice Fihn of the International Campaign to Abolish Nuclear Weapons (ICAN) in thanking LA City Councilmember Paul Koretz for his leadership in introducing a resolution in support of the U.N. Treaty on the Prohibition of Nuclear Weapons which passed unanimously in August. And she brought her Nobel Peace Prize medal with her!
Los Angeles City Councilmember Paul Kortez, who has proven to be a remarkable and courageous leader, noted the historic occasion on Facebook:
“Beatrice Fihn, 2017 Nobel Laureate, brought her medal to City Hall this week to thank me for introducing a resolution this August that called upon our federal leaders to spearhead a global effort to prevent nuclear war by renouncing the option of using nuclear weapons first and ending the President’s sole, unchecked authority to launch a nuclear attack. In addition, it asks for a verifiable agreement among nuclear-armed states to eliminate their nuclear arsenals. I introduced the resolution that was also signed by Mayor Eric Garcetti on the same day that he honored Hiroshima A-bomb survivors. My Director of Environmental Affairs Andy Shrader and I were joined at City Hall by Denise Duffield of Physicians for Social Responsibility – Los Angeles and Rick Wayman, Deputy Director of the Nuclear Age Peace Foundation. — with Denise Duffield, Paul Koretz, Andy Shrader, Rick Wayman and Beatrice Fihn in Los Angeles City Hall.”
October 12, 2018
9:15 pm INT RSSMC SANTA MONICA CA RAIN SAMPLE FROM STORM: 47.4 CPM^^ or normal background with no radon progeny/daughters per usual.
9:00 pm INT RSSMC (Radiation Station Santa Monica California) BG: 45.1 CPM^^
For more Radiation Station Santa Monica California radiation test results:
This short animation of Northern and Southern Hemisphere air circulation, shows why we can get detections so far south.
The reference monitoring station’s GammaScout Geiger counter died on the 12th September 2018, RIP. The last full day average it recorded was on the 11th September 2018. The GammaScout was used as a reference up until now, because all the data recorded here prior to Fukushima was using a GammaScout.
Will be trialling different equipment for the local monitoring station, a SBT-10 pancake, using Theremino Geiger counter software. I worked out how to transfer the logged data for this new setup into the charts I created for the GammaScout logged data. Because this is completely different monitoring equipment, the long term data reference will not be as accurate.
September’s 2018 month average is based on the 29 days of collected data.
September average background here tends to vary a lot from year to year. September marks the seasonal change from winter to spring and wind direction at this location during this seasonal change can swing wildly between tropical to southerlies. The more tropical wind we get for September, the higher the background, the more Southerly, the lower the background.
Caloundra September month average, year comparisons.
2018 14% above pre-Fukushima average
2017 27% above pre-Fukushima average
2016 12% above pre-Fukushima average
2015 5% above pre-Fukushima average
2014 6% above pre-Fukushima average
2013 15% above pre-Fukushima average
2012 13% above pre-Fukushima average
Cairns September Report – A slight increase around the middle of the month, but otherwise close to average. The Cairns monitoring station has two GammaScout Geiger counters.
Disclaimer: This is an amateur volunteer run service. Human error can provide incorrect information, and equipment malfunction can produce false readings. Do not rely on, or take action upon information presented on this web site, without further research.
September 13, 2018
10:30 pm EDST Southwest Michigan 1st floor room: 34.3 CPM^
7:15 am EDST Southwest Michigan 1st floor room: 32.2 CPM^ Sept 2018 Midwest rad testing – dunes September 11, 2018
10:00 pm EDST Southwest Michigan 1st floor room: 37.1 CPM^
10:30 am EDST St. Joseph, Michigan 2nd story room ST JOSEPH RIVER MOUTH AT LAKE MICHIGAN WATER SAMPLE: 24.5 CPM^ OR BACKGROUND BETWEEN PALISADES NUCLEAR PLANT 20 MILES TO THE NORTHWEST ALONG THE LAKE SHORE AND D.C. COOK NUCLEAR POWER PLANT 10 MILES TO THE SOUTHWEST
8:05 am EDST St. Joseph, Michigan 2nd story room: 30.3 CPM^
September 10, 2018
11:40 pm EDST St. Joseph, Michigan 2nd story room: 36.9 CPM^
9:10 am EDST St. Joseph, Michigan 2nd story room LAKE MICHIGAN WATER SAMPLE: 28.7 CPM^ OR BACKGROUND UP CURRENT OF PALISADES NUCLEAR PLANT 20 MILES TO THE NORTHWEST ALONG THE LAKE SHORE. AND DOWN CURRENT OF THE D.C. COOK NUCLEAR POWER PLANT 10 MILES TO THE SOUTHWEST
7:25 am EDST St. Joseph, Michigan 2nd story room: 31.2 CPM^
September 9, 2018
10:35 pm EDST St. Joseph, Michigan 2nd story room: 35.6 CPM^
8:10 pm EDST St. Joseph, Michigan 2nd story room: 32.9 CPM^
7:45 am EDST Southwest Michigan 1st floor room: 34.0 CPM^ Sept 2018 Midwest rad testing – pier September 8, 2018
9:35 pm EDST Southwest Michigan 1st floor room RAIN SAMPLE: 30.3 CPM^ OR BACKGROUND WITH NO SIGN OF RADON PROGENY PER USUAL IN THIS AREA
9:15 pm EDST Southwest Michigan 1st floor room: 32.8 CPM^
11:20 am EDST Southwest Michigan 1st floor room: 31.8 CPM^
6:00 am CDST INT OHARE AIRPORT CHICAGO: 33.1 CPM^
September 7, 2018
11:45 pm INT TERMINAL 4 LOS ANGELES INTERNATIONAL AIRPORT: 45.7 CPM^
The historic flooding now occurring after hurricane Florence poses the most serious threat to the local nuclear plants. Brunswick is just one of a number of nuclear power plants in the area that could be affected.
Here is a list of International Radiation Monitoring Stations for those who want to monitor, and keep an eye on the situation. This list includes private as well as government run monitoring stations.
UNUSUAL EVENT DUE TO SITE CONDITIONS PREVENTING PLANT ACCESS
“A hazardous event has resulted in on site conditions sufficient to prohibit the plant staff from accessing the site via personal vehicles due to flooding of local roads by Tropical Storm Florence.”
Sent earlier today to EnviroReporter.com from the Nuclear Regulatory Commission:
Nuclear Regulatory Commission – Press Release
No: II-18-033 September 13, 2018
NRC Expands Nuclear Power Plant Monitoring During Hurricane Florence
The Nuclear Regulatory Commission will staff its incident response center in Atlanta around the clock beginning this evening as it expands its monitoring of Hurricane Florence and its effects on nuclear power plants and other NRC-licensed facilities.
The NRC will continue 24-hour staffing as conditions require. NRC staff members will continue to monitor the path of Hurricane Florence while remaining in contact with plant operators, NRC on-site inspectors, the NRC’s headquarters operations center and state emergency officials.
Duke Energy notified the NRC that the company is shutting down both units at the Brunswick nuclear plant south of Wilmington, N.C., as that site is facing hurricane-force winds, major storm surges and heavy rain. This week, NRC inspectors have reviewed storm preparations, including protection against the amount of rain and flooding that might be expected. NRC inspectors are on site at the Brunswick plant and will remain there through the storm.
Officials at the Global Nuclear Fuels plant near Wilmington have also notified the NRC that they have shut down operations and secured equipment in advance of the storm.
Other nuclear plants in the projected storm path have prepared for high winds and heavy rainfall. NRC inspectors also will remain at those sites as conditions require.
Sent earlier today to EnviroReporter.com from the Nuclear Regulatory Commission:
Nuclear Regulatory Commission – Press Release
No: II-18-032 September 12, 2018
NRC Preparing for Hurricane Florence
The Nuclear Regulatory Commission resident inspectors at nuclear plants in the Carolinas and Virginia are reviewing the plant operators’ preparations in advance of Hurricane Florence, currently projected to make landfall in the Southeast later this week.
The NRC is also sending additional inspectors to those plants and will activate its regional incident response center in Atlanta, to provide around-the-clock staff support during the storm.
Duke Energy’s Brunswick nuclear plant south of Wilmington, N.C., could face hurricane-force winds, major storm surges and heavy rain. Other plants near the storm’s projected path are also taking precautions.
Nuclear plant operators would declare an emergency if conditions are expected that would require that declaration.
Plant procedures require operators to shut down the reactor well before hurricane-force winds arrive on site. In preparing for Hurricane Florence, the staffs at Brunswick, Surry in southeastern Virginia, Harris near Raleigh, N.C., Robinson near Hartsville, S.C., and some other plants are working through their severe weather procedures, including ensuring that all loose debris and equipment have been removed or secured, and conducting walk-down inspections of important systems and equipment.
NRC inspectors are verifying that all preparations have been completed, and the plants’ emergency diesel generators are available with ample fuel if the storm affects off-site power.
The NRC has also been in touch with officials at the Global Nuclear Fuels-America facility near Wilmington, N.C., the research reactor at North Carolina State University in Raleigh and other NRC licensees in the area to verify their preparations for the storm.
From the NRC Region II incident response center in Atlanta, NRC staff members will monitor Hurricane Florence while remaining in contact with plant operators, NRC on-site inspectors, the NRC’s headquarters operations center, and state emergency officials in the Carolinas, Virginia and all potentially affected states.
The additional NRC inspectors will remain at the nuclear plant sites and the incident response center will remain staffed as long as conditions require.
2018 12% above pre-Fukushima average
2017 17% above pre-Fukushima average
2016 8% above pre-Fukushima average
2015 5% above pre-Fukushima average
2014 4% above pre-Fukushima average
2013 8% above pre-Fukushima average
2012 9% above pre-Fukushima average
Cairns August Report – “All pretty level, no significant peaks.” The Cairns monitoring station has two GammaScout Geiger counters.
Disclaimer: This is an amateur volunteer run service. Human error can provide incorrect information, and equipment malfunction can produce false readings. Do not rely on, or take action upon information presented on this web site, without further research.
6th September 2018 – Japan nuclear plant’s power restored after quake triggers Hokkaido blackout
Extracts:
Power was restored to a nuclear energy plant in Hokkaido, northern Japan on Thursday after a strong earthquake left it relying on emergency generators for 10 nervous hours, but it may be a week before lights are back on all over the major island.
In another echo of the 2011 disaster, Hokkaido’s situation was compounded by difficulties in receiving supplies from neighboring regions that remain dominated by separate utilities with their own grids.
Someone provided a Quantum Pendent to test, it uses Quantum Scalar Technology.
What is a Quantum Pendant you ask?
It is a wearable pendant around 5cm in diameter, made from specialized Japanese lava based compound and plant extracts like Hemp protein. Claims are that it protects the wearer from EMF radiation emitted by Wifi devices, cell phones, power lines etc., and has positive benefits for your health.
The Youtube video below, indicates there are fake versions of Quantum Pendants being sold.
There are a large number of different styles of Quantum Pendants being sold on the Internet, much more than referenced in this video. There is a lot of debate on the Internet over which versions are actually the fake version of the Quantum Pendant. We have no idea which product is the official version. Ebay prices varied wildly from hundreds of dollars to a couple dollars.
Below are the Pancake Geiger counter and Scintillator test results of the pendant that was provided for testing. Yes, you are supposed to wear this pendant to get the energy benefits! It turns out for some strange reason, that the person who provided it for testing doesn’t want it back, and said I could have it!
The Pancake Geiger result minus background was 2170 Counts Per Minute (CPM), or around eighteen times the local background here.
The scintillator Gamma radiation test result minus test chamber background was 230 CPM. The test chart shows the decay daughters of Thorium-232. This pendant does make an excellent peak calibration test source for the scintillator test equipment here.
In my opinion the one provided for testing was significantly radioactive! I can only say that the one provided for testing had radioactive material in it. Are other Quantum Pendants this radioactive? I have no idea, you would need to have them tested to find out.
Here is what the Australian Radiation Protection and Nuclear Safety Agency (ARPANSA), has to say about these pendants.
Anti-Proton tested one in 13 January 2013 and detected Uranium and Thorium decay daughters.
By the way, I definitely will not be wearing this pendant!
It has been put to good use. It is stored in a lead lined container and used for radioactive peak calibration of scintillator test equipment here.
Disclaimer: This is an amateur volunteer run service. Human error can provide incorrect information, and equipment malfunction can produce false readings. Do not rely on, or take action upon information presented on here without further research.
This short animation of Northern and Southern Hemisphere air circulation, shows why we can get detections so far south.
Spike in Background Levels in Tasmania 4th and 6th July, and Caloundra on the 7th July 2018
Very surprised to find this significant detection showing up on the Caloundra 24 hour chart for the 7th of July. There had been an up tick in background at the beginning of July compared to June 2018, but the 52% above day average detection was a shock. Wind direction at the time was from inland Australia, which was also very surprising. We had a very light short shower in the morning. The live Radon monitor here showed nothing significant, levels were relatively low, around 0.2 pCi/l.
We have looked around the World wind maps to try and determine the source of these significant background spikes, but have been unable to pinpoint a definitive source. One suggestion put forward is the possible venting of volatile radioactive gases from the Lucas Heights nuclear reactor in Sydney that were blown around in the local atmosphere.
I went to the Australian Nuclear Science and Technology Organization (ANSTO), monitoring station web site. Their monitoring station is located near Lucas Heights nuclear reactor in Sydney Australia. This was to see if their monitoring station had picked up any spikes in July background radiation levels. What I found was the notice below. A strange coincidence ????
Radiation monitoring
“The environmental radiation station will not be operational in July due to repairs and maintenance of the system.”
Interestingly there were reports of a breakdown at the Lucas Height nuclear reactor in late June 2018.
28th June 2018 – Breakdown at Lucas Heights nuclear reactor in Sydney sparks fears of medical supplies shortage
Extract:
The facility’s production of 10,000 doses of technetium-99m per week for Australian patients has come to a halt. The products are used in nuclear imaging and are a vital diagnostic tool used in scans for heart, lung and musculoskeletal conditions, cancer and many other medical conditions.
Engineers were not yet able to “physically attend to the conveyor” an ANSTO spokesman said, although they had been working on fixing the mechanical fault over the weekend.
A few days before the Caloundra detection, a contact in Tasmania informed me of spikes in their local background. Spikes in background in Tasmania were detected on two separate detectors. On the 4th July the Tasmanian wind direction source was also off the Australian mainland.
The Tasmanian monitoring station happened to have an air filter which was sent to me for testing and arrived a few day later.
Below is the Tasmania filter test chart minus background tested using new Theremino PMT adapter equipment. If there was anything present it is below the resolution of the equipment here. http://sccc.org.au/wp-content/uploads/2018/08/Tasmania-filter-test-110718-TV7.2-16c-161387.png
Caloundra Water Tank Filter test
Here is the latest Caloundra local water tank filter test of 45 grams of fine organic material minus background. The two prominent isotope peaks are for the isotopes of Lead-210, from Radon-222 decay, and Berryllium-7, from upper atmosphere spallation.
The Caloundra and Tasmanian filter tests did not show anything significant, which points to radioactive short life volatile gases passing through. The most likely source of short life volatile radioactive gases in Australia would be the Lucas Heights nuclear reactor in Sydney Australia. The circumstantial evidence points to venting occurring at the Lucas Heights facility, to fix the broken conveyor used in the production of Technetium-99m.
Other possibilities are,
Another source on the Australia mainland.
An event somewhere else in the World or at Fukushima.
A secret device test in Australia.
Were the Caloundra and Tasmanian detections just coincidental?
Any suggestions or relevant information regarding these detections are welcome.
————————————————————
July is winter here in the Southern Hemisphere. Since the Fukushima Nuclear Catastrophe in 2011, long term local data collection is showing an increase in winter local background levels.
2018 14% above pre-Fukushima average
2017 17% above pre-Fukushima average
2016 8% above pre-Fukushima average
2015 5% above pre-Fukushima average
2014 5% above pre-Fukushima average
2013 6% above pre-Fukushima average
2012 9% above pre-Fukushima average
————————————————————-
International Radiation Monitoring Station Updated
Sites that were no longer operating have been removed, and new monitoring stations added.
Disclaimer: This is an amateur volunteer run service. Human error can provide incorrect information, and equipment malfunction can produce false readings. Do not rely on, or take action upon information presented on this web site, without further research.
August 1, 2018
6:45 pm INT RSSMC CHECKING FOR BETA TESTING DUST AGGREGATE FROM 3 HEPA FILTER IONIZING AIR CLEANERS: 55.1 CPM^^ OR ONLY 27.3% ABOVE BACKGROUND in six weeks aggregate.
6:30 pm INT RSSMC BG: 43.3 CPM^^
“Government officials originally estimated it would take about 40 years and $50 billion to clean up the plant, decontaminate the surrounding area, and compensate the disaster’s victims. In December 2016, they more than TRIPLED that estimate to $188 billion. “We have never experienced a disaster as big as Fukushima,” Hiroshige Seko, the head of Japan’s Ministry of Economy…”
“Human beings couldn’t go into the heart of Fukushima’s reactors to find the missing fuel, though—at least not without absorbing a lethal dose of radiation.”
First documentation of melted fuel – July 2017
“Then, something startling appeared on the monitors.”
“What is that?” said Matsuzaki.
“Everyone began talking at once and pointing to what they saw on the screens: murky glimpses of what appeared to be stalactites of something dripping like candle wax from the bottom of the reactor pressure vessel. They’d found the first signs of the missing fuel.”
Spikes detected on Australian monitoring stations located in Tasmania and Caloundra.
Very surprised to find this significant detection showing up on the Caloundra 24 hour chart for the 7th of July. There had been an up tick in background at the beginning of July compared to June 2018, but the 52% above day average detection was a shock. Wind direct at the time was from inland Australia which was also very surprising.
A few days before the Caloundra detection, a contact in Tasmania informed me of spikes in his local background. These spikes in background in Tasmania were detected on two separate detectors. On the 4th July the Tasmanian wind direction source was also off the Australian mainland.
What is the source of these significant Australian winter detections?
Was there an event or release on the Australia mainland?
Has a significant unreported nuclear event occurred somewhere in the world?
Were these detections unrelated and just coincidental?
Suggestions and information related to these detections are welcome.
Disclaimer: This is an amateur volunteer run service. Human error can provide incorrect information, and equipment malfunction can produce false readings. Do not rely on, or take action upon information presented on this web site, without further research.
This short animation of Northern and Southern Hemisphere air circulation, shows why we can get detections so far south.
June is winter here in the Southern Hemisphere. The long term June data is showing a gradual increase in winter local background levels, since the Fukushima Nuclear Catastrophe.
2018 11% above pre-Fukushima average
2017 12% above pre-Fukushima average
2016 7% above pre-Fukushima average
2015 3% above pre-Fukushima average
2014 7% above pre-Fukushima average
2013 7% above pre-Fukushima average
2012 3% above pre-Fukushima average
Disclaimer: This is an amateur volunteer run service. Human error can provide incorrect information, and equipment malfunction can produce false readings. Do not rely on, or take action upon information presented on this web site, without further research.
Here are four significant factors that are now contributing to higher radiation detections during plane flights.
1. There was a significant amount of radioactive contamination blown into the upper atmosphere by the Fukushima nuclear catastrophe. When planes fly through this, some of the radioactive fallout cloud is sucked into the cabin of the aircraft.
Depending on wind pattens at the time of the catastrophe, flying in the Northern hemisphere between Japan and the USA was particularly hazardous. The radioactive particulate material getting into the aircraft was a significant risk to human health. It is still a risk, but just after Fukushima the risk was much greater. The Southern Hemisphere was not as severely affected by this new hazard.
This article by Michael Collins, EnviroReporter.com, documents a flight across America on December 23rd 2011.
2. Yes, it is normal to be exposed to greater amounts of radiation during flights at high altitudes, more so if the flight is closer to the poles. This is because at higher altitudes the earth’s atmosphere is much thinner and offers less protection from incoming solar and cosmic radiation. Look at this chart, Radiation verses Altitude, from Spaceweather.com. The radioactive particulate from Fukushima increases the risk.
3. A weaker Sun is now a third factor. The Sun is becoming far less radiant and is going into one of its quiet periods. Less Sun radiance means it’s heliosphere becomes much weaker. The heliosphere is a bubble-like region of space dominated by the Sun’s solar wind and magnetic field. It normally extends far beyond the orbit of Pluto. Plasma blown out from the Sun’s heliosphere acts as a shield, protecting the solar system and Earth from incoming intergalactic and galactic cosmic rays.
A much weaker heliosphere means more cosmic rays strike Earth’s upper atmosphere. Spaceweather.com have been conducting high altitude cosmic ray detection tests since 2015.
4. The Earth’s magnet field is weakening. The Earth’s magnetic field also acts as a protective shield against solar wind and storms, and cosmic rays.
The Earth’s magnetic field has weakened by 20% already, and appears to be weakening by around 10% per decade, plus this weakening may accelerate in the coming years.
Read the “Earth Changes” report on EnviroReporter.com, to gain a better understanding of the dynamic changes that are occurring to our planet’s environment.
Hi, recently I flew from Cairns, Australia to Brisbane and on to Auckland New Zealand and my geiger counter went from 12cpm at ground level up to 2,500cpm at cruising altitude on both legs of the flight. I turned on the counter a number of times during both flights and the reading continued to stay at 2,400 – 2,400 cpm. Once a lower altitude was reached coming in to land, the level dropped back to normal. Is this normal for radiation levels at 30,000 feet, or are there elevated atmospheric levels in the upper atmosphere because of Fukushima?
EnviroReporter.com friend and international nuclear relations expert Dr. Bennett Ramberg has a timely piece on the North Korea/USA summit in Singapore that should be required reading for those in the Trump Administration that can.
The following NBC News OpEd provides the most comprehensive published examination of how layered security assurances can promote a durable North Korea nuclear deal:
This short animation of Northern and Southern Hemisphere air circulation, shows why we can get detections so far south.
A nice quiet month without any significant background events. As most of the air flows here during this season come from a southerly direction, May local background levels were much lower than the summer months
2018 12% above pre-Fukushima average
2017 7% above pre-Fukushima average
2016 12% above pre-Fukushima average
2015 4% above pre-Fukushima average
2014 13% above pre-Fukushima average
2013 7% above pre-Fukushima average
2012 7% above pre-Fukushima average
Disclaimer: This is an amateur volunteer run service. Human error can provide incorrect information, and equipment malfunction can produce false readings. Do not rely on, or take action upon information presented on this web site, without further research.
May 30, 2018
8:15 am INT Radiation Station Santa Monica California SANTA MONICA CA RAIN SAMPLE: 36.6 CPM^^ or normal background.
8:00 am INT RSSMC BG: 42.9 CPM^^
May 29, 2018
6:00 pm INT Radiation Station Santa Monica California (RSSMC) CHECKING FOR BETA TESTING DUST AGGREGATE FROM 3 HEPA FILTER IONIZING AIR CLEANERS: 93.0 CPM^^ OR 2.4 TIMES BACKGROUND in seven weeks aggregate.
5:45 pm INT RSSMC BG: 38.9 CPM^^
From our friends at Fight for the Future who are behind the “RED ALERT FOR NET NEUTRALITY” campaign you’ve seen, and hopefully signed, on the pages of EnviroReporter.com:
“We won! The U.S. Senate just voted to overturn the FCC’s repeal of net neutrality!
Even better, your work helped win the votes of TWO undecided senators who swung our way at the last minute, giving us a 52-47 margin and huge momentum. That’s game-changing.
Now the fight moves to the House of Representatives—and with the FCC scheduled to end net neutrality on June 11th unless Congress stops them, the stakes are higher than ever…
Comcast, Verizon, and the rest of Big Cable thought sure they could beat us with all the millions they spent on lobbyists and campaign contributions.
But for months, the Internet has been on fire. You called. You rallied. You protested. You did whatever it took. You didn’t give up. And today, the Senate passed the resolution overruling Ajit Pai and restoring net neutrality in a historic upset!
The key to winning in the Senate was mobilizing so much grassroots pressure that it was impossible for undecided senators to ignore us. And that will be even more true in the House of Representatives, where every member is already looking ahead to November and trying to figure out how to keep their seats in what is predicted to be an incredibly close election…
No one thought we’d get this far, but this is just the first step. Now we need to pass the same resolution in the House of Representatives.”
This short animation of Northern and Southern Hemisphere air circulation, shows why we can get detections so far south.
This month the GammaScout Geiger Counter used for data logging local background, developed a fault. I managed to get it working again, but in the process lost some day average logging data, hence the gap in the chart.
April month averages tend to vary from year to year by a significant amount. As the Southern Hemisphere winter approaches, air flows here swing a lot between Northern Tropic air to Southern Ocean air flows. If we get more tropical air in April the background goes up. If there are more Southern Ocean air flows, the month average goes down. Since Fukushima, this has become a dynamic of the local background monitoring. If you look at the charts on the yearly average background page, link below, you can clearly see an annual winter background dip showing up in the year and month background charts.
2018 24% above pre-Fukushima average
2017 11% above pre-Fukushima average
2016 33% above pre-Fukushima average
2015 6% above pre-Fukushima average
2014 22% above pre-Fukushima average
2013 9% above pre-Fukushima average
2012 12% above pre-Fukushima average
Cairns April Report – Fairly level, without any spikes. (Cairns has two monitoring Geiger counters.)
Disclaimer: This is an amateur volunteer run service. Human error can provide incorrect information, and equipment malfunction can produce false readings. Do not rely on, or take action upon information presented on this web site, without further research.
May 5, 2018
10:20 pm INT RSSMC SANTA MONICA CA PACIFIC OCEAN SAMPLE FROM SANTA MONICA BAY IN PACIFIC PALISADES: 44.6 CPM^^ or normal background.
10:00 pm INT RSSMC BG: 39.3 CPM^^
When I see the sunrise at Fukushima I can’t help but see the beauty. Thanks to the Nuclear Power Industry that spectacular spot on our planet has been forever changed. No dollar value can be placed on that. 🙁
16th April 2018 – Out-of-control Sydney bush fire spreads towards nuclear reactor and army ammunition warehouse as residents in surrounding suburbs are told ‘it’s too late to leave
Extracts:
Out-of-control Sydney bush fire spreads towards nuclear reactor and army ammunition warehouse as residents in surrounding suburbs are told ‘it’s too late to leave.
A spokesman for the Australian Nuclear Science and Technology Organisation in Lucas Heights said there is no current threat to the reactor, but safety measures had been taken.
‘ANSTO always works with local emergency services, and the Rural Fire Service has advised no risk to ANSTO as a result of the fires in the vicinity of our Lucas Heights campus,’ said the spokesperson.
Article:
Below is a screen shot from the Australian Nuclear Science and Technology Organisation’s (ANSTO) local live radiation monitoring station at Endagine. Endagine is located East of the Lucas Heights nuclear reactor.
Here are notes from the ANSTO monitoring site page.
Gamma radiation is a penetrating form of short wavelength electromagnetic radiation, similar to X-rays.
The environmental radiation graph (above) shows measurements in nanoGrays (nGy) which are units of absorbed radiation dose commonly used in environmental monitoring. A nanoGray is one billionth (one thousand millionth) of a Gray.
A temporary rise in environmental gamma radiation is often detected when it rains. This occurs because rain affects the behaviour of naturally occurring radionuclides, such as the gas radon. These radionuclides can be absorbed by rain drops and temporarily concentrated near the ground. Also, radon naturally builds up in air spaces in the soil and can be released when rain soaks into the ground.
“Spikes” in the environmental radiation graph (above) may occur during the regular calibration checks (see below) of the instrument that are needed to ensure accurate data. Gaps appearing in either graph are usually associated with delayed radio transmission of data from Engadine.
West Los Angeles Basin dust over double background radiation due to beta rays
April 9, 2018
4:05 pm INT RSSMC CHECKING FOR BETA TESTING DUST AGGREGATE FROM 3 HEPA FILTER IONIZING AIR CLEANERS: 87.0 CPM^^ OR 2.1 TIMES BACKGROUND in five weeks aggregate.
3:40 pm INT RSSMC BG: 41.9 CPM^^
This short animation of Northern and Southern Hemisphere air circulation, shows why we can get detections so far south.
The stats are in, and March 2018 had the highest recorded March background ever recorded here, at 46% above average. What is creating these Southern Hemisphere increases? Fukushima atmospheric contamination? Increases cosmic rays? Radon releases, or combination of all off these?
Alert Caloundra 27th March 2018 – In the morning the GammaScout Geiger counter started to alarm on and off very quickly. One visual observation showed a spike of 0.625 uSv/hr. Looking at all the very short duration high detections I have been seeing recently, it suggests to me that I am detecting lots of hot particles in the atmosphere. If I didn’t have 60 second sampling and a 0.30 uSv/hr alarm setting in place, I would probably have missed these detections. They would have been hidden in the averages, because they are of such a short duration.
The 24hr 60 second logging chart shows numerous short duration peaks between 8.30 am and 11.30 am.
At the time we had one low pressure system sitting off the East coast plus another in North Queensland, look at the wind map link below. The wind map shows the local air mass at the time was coming off the Pacific Ocean. The main source appeared to be a high pressure system situated East of New Zealand. The air from it was being drawn into these two lows. This air flow was passing over this location at the time. My present theory is that contaminated air was drawn down from the upper atmosphere to the surface, by this high pressure system.
The wind direction at the time was South Easterly, off the Pacific Ocean! It was an overcast, but a fine day.
2018 46% above pre-Fukushima average
2017 38% above pre-Fukushima average
2016 39% above pre-Fukushima average
2015 33% above pre-Fukushima average
2014 31% above pre-Fukushima average
2013 32% above pre-Fukushima average
2012 24% above pre-Fukushima average
Year and month average local background radiation levels from 2007 to 2018.
Disclaimer: This is an amateur volunteer run service. Human error can provide incorrect information, and equipment malfunction can produce false readings. Do not rely on, or take action upon information presented on this web site, without further research.
Default Pacific USA time zone unless otherwise indicated
March 22, 2018
4:10 pm INT RSSMC SANTA MONICA CA RAIN SAMPLE FROM SECOND MAJOR BAND OF “PINEAPPLE EXPRESS” STORM: 42.1 CPM^^ or normal background with no radon progeny per usual.
3:00 pm INT RSSMC BG: 44.4 CPM^^
March 21, 2018
4:10 pm INT RSSMC SANTA MONICA CA RAIN SAMPLE FROM “PINEAPPLE EXPRESS” STORM: 38.5 CPM^^ or normal background with no radon progeny per usual.
3:50 pm INT RSSMC BG: 43.0 CPM^^
March 21, 2018
4:10 pm INT RSSMC SANTA MONICA CA RAIN SAMPLE FROM “PINEAPPLE EXPRESS” STORM: 38.5 CPM^^ or normal background with no radon progeny per usual.
3:50 pm INT RSSMC BG: 43.0 CPM^^
Well, it appears that my suspicions about this not being Californium were well founded.
21st March 2018 – “Nuclear” mystery solved in Ankara”
Extracts:
The mystery behind the seizure by Turkish police of a substance that had been believed to be the extremely rare nuclear chemical Californium in a poor area of Ankara has been solved after Turkey’s nuclear authority identified it instead as an organic resin, economy-focussed newspaper Dünya said .
Analysts were baffled when pro-government broadcaster NTV announced that 1.4 kg of Californium had been found in the Ankara suburb of Pursaklar, with some pointing out that that amount would represent around 4,000 years of global production of the element at present rates.
“Californium is known to be one of the most expensive materials on the earth due to its cost of transportation, limited availability, and expensive production process.”
“Only a handful of facilities are capable of producing Californium including the US Oak Ridge National Laboratory and the Research Institute of Atomic Reactors in Russia. As little as 0.25g of the element might be produced in a single year. This means that it is extremely scarce and has limited availability.”
If as little as 0.25g of the element might be produced in a single year, then 441 grams would take 1764 years to produce!
Another Quote:
“Thirdly it is an element that is not easily transported. Despite its microscopic size, Californium must travel in specialized heavy duty containers that prevent the release of radioactive material. You may think that a single gram of Californium could be carried in a small container? In reality, that single gram would require a huge shipping cask that is specifically designed and built to transport the element.”
In this article, they are showing multiple glass vials and a plastic bag of highly radioactive Californium, out in the open.
There is far more to this story than a first read would indicate!!!
“Usefulness came later, when bombarding plutonium-239 with single neutrons produced microgram-sized samples. More important than the increase in size was the change in isotopes. Early experiments produced californium-245, which has a seven minute half life. Californium-252, produced during the later experiments, has a half life of around two and a half years. During much of that time, a microgram-sized sample is giving off 170,000,000 neutrons per minute.
This makes it a very useful substance. Nuclear reactors work by getting neutrons shot into them, which causes some of the atoms to split, giving off more neutrons and perpetuating the reaction. The famous inanimate carbon rod can be used to soak up those extra neutrons, slowing the reaction down. When the reaction gets too slow, though, you need a neutron source to start it up. This is where californium-252 comes in. It’s a tiny, effective neutron emitter that can jump-start a nuclear reactor.”
I used Google translate to get the extracts from the Turkish article.
19th March 2018 – US $ 70 million nuclear material operation in Ankara
Extracts:
In an automobile search in Ankara, one kilogram of 441 grams of nuclear “californium”, worth 70 million dollars in market value, was seized.
Turkey Atomic Energy Agency (TAEK) to the authorities, security officials, “californium” substance is generated only in the United States and Russia.
Comment:
International smuggling and theft of nuclear material is a huge problem. Weight for weight some nuclear isotopes can be worth way more than gold. Who was going to purchase this californium, and what was it going to be used for?
EnviroReporter.com‘s prescient exposés over the years showing how vulnerable our aged and dangerous nuclear power plant should have been a wake-up call to toughen up standards and security. Now it may be too late with Russia having penetrated America’s critical and nuclear infrastructure according to today’s Ides of MarchU.S. U.S. Department of Homeland Security Computer Emergency Readiness Team (US-CERT) ALERT.
Alert (TA18-074A)
Russian Government Cyber Activity Targeting Energy and Other Critical Infrastructure Sectors
Original release date: March 15, 2018
Systems Affected
Domain Controllers
File Servers
Email Servers
Overview
This joint Technical Alert (TA) is the result of analytic efforts between the Department of Homeland Security (DHS) and the Federal Bureau of Investigation (FBI). This alert provides information on Russian government actions targeting U.S. Government entities as well as organizations in the energy, nuclear, commercial facilities, water, aviation, and critical manufacturing sectors. It also contains indicators of compromise (IOCs) and technical details on the tactics, techniques, and procedures (TTPs) used by Russian government cyber actors on compromised victim networks. DHS and FBI produced this alert to educate network defenders to enhance their ability to identify and reduce exposure to malicious activity.
DHS and FBI characterize this activity as a multi-stage intrusion campaign by Russian government cyber actors who targeted small commercial facilities’ networks where they staged malware, conducted spear phishing, and gained remote access into energy sector networks. After obtaining access, the Russian government cyber actors conducted network reconnaissance, moved laterally, and collected information pertaining to Industrial Control Systems (ICS)…[MORE]
EnviroReporter.com‘s work exposing these nuclear power plant vulnerabilities is more pertinent than ever. It is never too late to at least try to defend these ‘in-place nuclear weapons’ from Russia and other bad actors.
This short animation of Northern and Southern Hemisphere air circulation, shows why we can get detections so far south.
The month average for February 2018 was 49% above pre-Fukushima levels, the highest month average local February background on record. Late February also had three days that were 80%+ above average. This is the first time here we have had three days in a row at 80% above pre-Fukushima levels.
A contributing factor to the day average increases near the end of February would have been the 10 pCi/l + Radon spikes that were detected on the 23rd, 24th and 25th. The Radon spike detections were possibly a precursor to an up tick in earthquake and volcanic activity on the Pacific rim, as the surface wind was coming off the Pacific Ocean at the time.
Even so, the elevated Radon levels would not account for all the month day average background increases.
Caloundra February month average, year comparisons.
2018 49% above pre-Fukushima average
2017 42% above pre-Fukushima average
2016 41% above pre-Fukushima average
2015 30% above pre-Fukushima average
2014 40% above pre-Fukushima average
2013 39% above pre-Fukushima average
2012 37% above pre-Fukushima average
Year and month average local background radiation levels from 2007 to 2018.
Disclaimer: This is an amateur volunteer run service. Human error can provide incorrect information, and equipment malfunction can produce false readings. Do not rely on, or take action upon information presented on this web site, without further research.
[caption id="attachment_25592" align="aligncenter" width="770"] Santa Monica rain at background 3-14-18[/caption] March 14, 2018
12:20 am INT RSSMC SANTA MONICA CA RAIN SAMPLE: 44.3 CPM^^ or normal background.
12:05 am INT RSSMC BG: 42.5 CPM^^
🙁 3/11 March 11, 2011
I was watching CBS news tonight and they mentioned the 2011 Japanese Tsunami and gave about 20 seconds at the end to mention Fukushima’s Nuclear issues, except to say there were 3 ‘partial’ meltdowns and that the plants were still in cleanup that could take 30 to 40 years. [paraphrased]
Some may say “No news is good news”, but I have to wonder about that when it comes to Fukushima and other radioactive contamination disasters/debacles. (Being ‘fed’ misleading or inaccurate bias’ might also be included.)
IMO: I guess ‘No News’ is not ‘Fake News’, but it is ‘Negligent News’ regardless.
I remember the first day I found this site. I was searching for someone with a Geiger counter several days after the Fukushima meltdowns and I found the Ustream of EnviroReporter’s Inspector Detector. I quickly became fascinated by the implications of Fukushima. Not only understanding of radiation, but how the understanding/misunderstanding came about. I also found it odd that the mainstream media seemed to present a different picture of Fukushima and would ‘seem’ to control the broadcast feed making sure not to alarm the public.
The amount of IMPORTANT knowledge I have found here over the last seven years is immense when I think about it. There were a lot of page views during the first year and then it dropped off to what it is now. But what I know is this, it’s highly likely that another meltdown or radioactive disaster will occur sooner or later and people will again do research and come to this site. If they take the time to read through the historical archives here, at least a quick scan, they will learn quickly and be amazed.
Here’s just a few of things I’ve learned in 7 years.
1. Radiation in ANY amount is not good for you.
2. The Nuclear Industry has been a scam since it’s inception.
3. News and data/information regarding all things Nuclear are lopsided.
4. That governments have failed us and lied to us regarding Nuclear. (ongoing)
5. The planet is at grave risk and not enough people know about it, yet.
6. ‘Acceptable Risk’ is is a misnomer.
Thanks again to EnviroReporter.com for keeping the information coming.
“Capture a Dream, your life’s being run by modern MACHINES”
(press CC for Closed Caption to view the lyrics)
[ My latest original song. Feel free to share or comment. Thanks.]
Slighty elevated readings in rare rain on the border of the Sonoran Desert and the Coastal Ranges of Southern California:
March 4, 2017, 2018
9:00 am INT Building in Sonoran Desert: 44.2 CPM^^
12:25 am INT Building: 50.0 CPM^^ or 18.8% more than immediate prior background. This exceeds the Inspector’s +/- margin of error of 15%. While possible, it is unlikely that radon gas had much to do with the elevated reading as it was very windy and this part of California has low potential for significant radiation.
12:05 am INT Building in Sonoran Desert 40 miles north of Mexico BG: 42.1 CPM^^
February 27, 2017, 2018
12:25 am INT RSSMC RAIN SAMPLE: 38.1 CPM^^ or 16% less than normal background which can happen when radon-free rain water is tested.
12:05 am INT RSSMC BG: 45.3 CPM^^
Ever since Fukushima’s triple meltdown began March 11, 2011, EnviroReporter.com has recommended robust air filters. Here’s more evidence of why that’s a good recommendation:
February 26, 2017, 2018
6:25 pm INT Radiation Station Santa Monica California CHECKING FOR BETA TESTING DUST AGGREGATE FROM 3 HEPA FILTER IONIZING AIR CLEANERS: 143.3 CPM^^ OR 3.2 TIMES BACKGROUND in seven weeks aggregate. California Highway Patrol considers three times background for a toxic substance to be the threshold for initiating Hazardous Materials Protocols.
6:00 pm INT Radiation Station Santa Monica California BG: 44.4 CPM^^
10th February 2018 – Massive alert in Mexico after radioactive device stolen
Extracts:
Mexico’s interior ministry has issued an alert across seven states following the theft of a radioactive device.
The item in question is a nuclear densometer which is used in geotechnical engineering to measure density. It contains radioactive material and there are fears such material could be used to make a “dirty bomb.”
At the peak of this spike it was very humid, but not raining, and the local Radon monitor was in a wooden building with the door and some windows open. Under these environmental monitoring conditions, this is a very large spike in local Radon levels. The wind direction during the event was from the tropics.
Caloundra January month average, year comparisons.
2018 45% above pre-Fukushima average
2017 42% above pre-Fukushima average
2016 41% above pre-Fukushima average
2015 40% above pre-Fukushima average
2014 41% above pre-Fukushima average
2013 52% above pre-Fukushima average
2012 43% above pre-Fukushima average
On the 15th January there was a marked drop in background levels, as the wind direction changed to a Southerly from the Southern Ocean. This dynamic has been constant since Fukushima. Whenever Southern Ocean air flows reach here, we get a significant drop in background levels.
Disclaimer: This is an amateur volunteer run service. Human error can provide incorrect information, and equipment malfunction can produce false readings. Do not rely on, or take action upon information presented on this web site, without further research.
This short animation of Northern and Southern Hemisphere air circulation, shows why we can get detections so far south.
2017 was a record breaking year. Contributing factors to this year’s background increases were, Radon from earthquake activity in the Pacific, the Sun going into a quiet period, and from Northern to Southern equatorial air flow break through. These were in addition to the recorded Fukushima increases since 2011. Detailed 2017 monthly reports can be found here, http://sccc.org.au/daily-local-background-radiation-levels-and-advisories-for-2017
1. March 30th saw the highest day average background ever recorded here, at 0.215 uSv/hr.
On March 29th, the day average was 51% above average. On the 30th, the low pressure system left over from cyclone Debbie came through, and the local background 24 hour day average spiked even more. Background peaked at 0.215 uSv/hr which is ~115% above average for this location. Yes, there was a spike in Radon levels on that day,but it wasn’t significant enough to account for this amount of increase in local background.
2. February, June, July, August, September and December had the highest recorded background month averages since Fukushima. June water tank filter testing detected mainly Lead-210, the a decay daughter of Radon, and Beryllium-7. Beryllium-7 is created by cosmic ray spallation in the upper atmosphere. Although Pb-210 and Be-7 may have contributed to the background increases the amounts detected where not significant enough to account for this significant increase in local background.
3. On the 3rd December 2017 a massive radon spike was detected that reached up to 8 pCi/L. At the time of the event it was very humid but not raining. The local live Radon monitor was in a wooden building with the door, and some windows open. Under these environmental monitoring conditions, this is a very large spike in local Radon levels. The wind direction during the Radon spike was easterly off the Pacific Ocean.
4. 2017 had the highest year average background level ever recorded here at 27% above the 4 year pre-Fukushima average. Some of the local background increases in October, November, and early December occurred during Easterly air flows. These Easterly air flows brought Radon gas releases to this location from a massive earthquake swarm and volcanic activity that appeared in the New Caledonia, Vanuatu, Soloman Islands and Fiji regions of the Pacific Ocean, at that time.
5. The Monitoring GammaScout Geiger counter alarmed numerous times on the mornings of the 30th and the 31st December. These alarms were for short duration spikes in background, as wind direction changed to a Northern tropical direction. The last time we saw spikes like this was after Fukushima. These where very short duration events, less than 60 seconds, which suggest hot particles were passing through the monitoring Geiger counter environment.
Background spike detected on the 31st December 2017. (Visual observation at the time saw the GammaScout Geiger counter spike at 0.725 uSv/hr.
Caloundra December month average, year comparisons.
2017 45% above pre-Fukushima average
2016 36% above pre-Fukushima average
2015 35% above pre-Fukushima average
2014 32% above pre-Fukushima average
2013 36% above pre-Fukushima average
2012 43% above pre-Fukushima average
Disclaimer: This is an amateur volunteer run service. Human error can provide incorrect information, and equipment malfunction can produce false readings. Do not rely on, or take action upon information presented on this web site, without further research.
Dec 21, 2107 12:35 p.m.
“Georgia Power is praising the decision to allow construction of a multibillion-dollar nuclear plant to continue in east Georgia.”
“The PSC agreed Thursday to let construction continue on the two new nuclear reactors, despite massive cost overruns for the multibillion-dollar project.”
“The project has been plagued by delays and spiraling costs, compounded when the main contractor filed for bankruptcy. Westinghouse Electric Co., the U.S. nuclear unit of Japan’s Toshiba Corp., filed for bankruptcy in March.”
IMO: The cost overruns to humanity cannot be measured.
How many solar panels, windmills, etc… could be built with ‘mutibillions’ of dollars?
Side note: I’m trying to do my part. I bought an all Electric Vehicle, zero emissions. Loving it. (Fiat 500e, used but like new) My old fossil fuel car got about 20 miles to a gallon. At an average cost of $3/gal (currently). I was paying a minimum of $200 in fuel on a monthly basis for a regular commute. Now, my EV charging cost is slightly less than $20 for the entire month. No more smog check, no more oil change, no more radiator/water pump issues, etc… There are less than 10 moving parts to an electric motor compared to over 300 on a gas engine. Maintenance costs are no brainer, no comparison. btw – The term ‘range anxiety’ must have been made up by the oil industry. I wake up every morning with a full tank, so to speak, my house is my gas/charge station. If I really need to drive a couple of hundred miles in a day, I’ll just rent a car with the money I saved commuting with my EV. Driving is fun again, it’s like sailing in the wind. 😉
The fate of America’s only nuclear plant under construction will be decided this coming Thursday.
Plant Vogtle in Georgia.
“This cost estimate is nearly double the company’s original projection, and the timeline is five years behind schedule. The cost of the project for Georgia Power and its co-owners exceeds $20 billion.”
“…a commission made of five elected officials, all Republicans, will vote on whether to permit Georgia Power’s new plan for the project,…”
“In July, South Carolina utilities announced it would cancel a separate plan for two nuclear reactors in the state because of cost overruns after Westinghouse, also the reactor’s designer for that project, went bankrupt.”
The above article says ‘carbon free emissions’ at least 5 times, but not once does it mention the risk to all living things or the deadly costly waste that nobody really knows what to do with.
In my opinion the following word best sums up the Nuclear Industry since day one.
➡ boondoggle
noun
1. work or activity that is wasteful or pointless but gives the appearance of having value.
“writing off the cold fusion phenomenon as a boondoggle best buried in literature”
“a public project of questionable merit that typically involves political patronage and graft.”
“they each drew $600,000 in the final months of the great boondoggle”
verb
1. waste money or time on unnecessary or questionable projects.
This short animation of Northern and Southern Hemisphere air circulation, shows why we can get detections so far south.
Report
Caloundra November 2017 – The elevated background level increases at the end of November 2017 chart have also coincided with a significant increase in Radon detection in the local atmosphere.
The elevated Radon detections over the last couple of months seems to have been a precursor to the outbreak of a very large earthquake swarm in the Eastern Pacific.
A magnitude 7.0 earthquake at 86km ENE of Tadine, New Caledonia occurred on the 19th November.
The recent Radon increases would have been a contributing factor to the November elevated background levels, but not the only factor.
The third chart down on this page is the local live Radon monitoring chart.
Caloundra November month average, year comparisons.
2017 32% above pre-Fukushima average
2016 32% above pre-Fukushima average
2015 37% above pre-Fukushima average
2014 29% above pre-Fukushima average
2013 30% above pre-Fukushima average
2012 31% above pre-Fukushima average
Disclaimer: This is an amateur volunteer run service. Human error can provide incorrect information, and equipment malfunction can produce false readings. Do not rely on, or take action upon information presented here, without further research.
21 November 2017 – Russia confirms ‘extremely high’ radiation levels in toxic cloud
Extracts:
Russian authorities have confirmed reports of a spike in radioactivity in the air over the Ural Mountains.
The Russian Meteorological Service said it recorded the release of Ruthenium-106 in the southern Urals in late September and classified it as “extremely high contamination”.
France’s nuclear safety agency earlier this month said that it recorded radioactivity in the area between the Volga River and the Ural Mountains from a suspected accident involving nuclear fuel or the production of radioactive material.
27th October 2017 – Video shows illegal dumping of toxic liquids at Hanford
Extracts:
Workers at the Hanford Site violated multiple state laws and regulations in August when they dumped thousands of gallons of contaminated water straight into the soil.
Videos and internal records obtained by the KING 5 Investigators document three separate incidents where liquid was dumped from large metal boxes that were marked as containing radioactive materials.
Decades of plutonium production at Hanford left behind significant amounts of radioactive and chemical waste, making it the most contaminated spot in the Western Hemisphere and prompting a decades-long, multi-billion-dollar clean-up effort.
This short animation of Northern and Southern Hemisphere air circulation, shows why we can get detections so far south.
Report
Caloundra October 2017 – The elevated background level increases we are seeing in the October 2017 chart have also coincided with a significant increase in Radon detection in the local atmosphere.
The amount of Radon detected locally has increased significantly since September 2017. In September Radon levels stayed below 0.1 pCi/l for the majority of the month.
During this period there was a high pressure system sitting between Australia and New Zealand. It was bringing air flows from the West coast of New Zealand and the Eastern Pacific Ocean, to this location. This suggests the Radon source is from the recent volcanic activity in Northern New Zealand, and earthquake releases in the Eastern Pacific.
The recent Radon increases would have been a contributing factor to the October elevated background levels, but not the only factor.
Caloundra October month average, year comparisons.
2017 32% above pre-Fukushima average
2016 22% above pre-Fukushima average
2015 12% above pre-Fukushima average
2014 14% above pre-Fukushima average
2013 25% above pre-Fukushima average
2012 19% above pre-Fukushima average
Disclaimer: This is an amateur volunteer run service. Human error can provide incorrect information, and equipment malfunction can produce false readings. Do not rely on, or take action upon information presented here, without further research.
The cash triggered an alarm when passing through the radioactivity monitoring system inspection process at Pudong International Airport on October 10. The notes contained a high level of radioactivity. They were being carried in the bag of a male passenger. They were found to contain Americium-241 – a highly toxic radioactive substance, according to the Shanghai Airport Entry-Exit Inspection and Quarantine Bureau. Americium-241 has a half-life of 433 years.
Furthermore, it promotes the formation of cancer cells because of its radioactivity. If cash is contaminated by radioactivity, it poses a serious threat because banknotes are circulated quickly, bureau officials said. It is also difficult to track the source of contamination during circulation and users are usually unaware of the risks, the officials added.
Comment:
Americium-241 is mainly an alpha radiation emitter, and is a significant health risk if ingested or inhaled. Americium-241 is the decay daughter of Plutonium-241. Detecting it on bank notes should be raising alarm bells!
There has been a spike of airborne radioactivity in Europe. Ruthenium-106. The highest amount was found in Austria, at 42 millibequerel per cubic meter. Its comming from the direction of the Ukraine, Lithuania, Belarus area.
6th October 2017 – Environment Pollution in MultiCountries
Extract:
German officials say that a spike in radioactivity has been detected in the air in Western and Central Europe but there’s no threat to human health. The Federal Office for Radiation Protection said Thursday that elevated levels of the isotope Ruthenium-106 have been reported in Germany, Italy, Austria, Switzerland and France since Sept. 29.
Spokesman Jan Henrik Lauer told The Associated Press the source of the Ruthenium-106 isn’t known but calculations indicate it may have been released in eastern Europe. Ruthenium-106 is used for radiation therapy to treat eye tumors, and sometimes as a source of energy to power satellites.
This short animation of Northern and Southern Hemisphere air circulation, shows why we can get detections so far south.
Report
Caloundra September 2017 – In the last few months there has been a steady increase in month averages at this location in the Southern Hemisphere. The months have been very dry. The September rainfall total was 15mm and the wettest day was the 23rd, with 13mm. Radon levels have been low, so it did not contribute significantly to the day average increases we have seen through September.
I have been trying to work out why there has been an unseasonal increase in background here in winter, on top of the normal Fukushima increase.
So what created these recent increases?
Here are some theories.
1. There has been more mixing of Northern and Southern hemisphere tropical air flows, allowing more radiation from the Northern hemisphere to enter the Southern Hemisphere.
2. Research is showing that more cosmic rays are now reaching the Earth because the Sun’s heliosphere is decreasing in intensity.
If this is the case, we would expect there to be an uptick in background radiation detection by Geiger counters, even at the surface of the Earth.
Most people don’t go to the trouble of collecting day average and month average radiation background levels, using 60 second sampling. My system of data collection will show changes that would be missed by others.
3. The Monitoring Geiger Counter is malfunctioning.
I haven’t been able to find any evidence that this is the case. Ruled out the possibility of dust contamination as the area around monitoring counter was cleaned of dust, plus the Geiger counter was also inspected and cleaned of any dust build up. The background levels have continued to climb, even after the clean.
The GammaScout Geiger counter battery level is still at the normal operating 3.6 volts.
——————
My conclusion at this point is that the increased cosmic ray activity, plus the Fukushima increase, are both contributing to the local background levels we are now seeing.
Caloundra September month average, year comparisons.
2017 27% above pre-Fukushima average
2016 12% above pre-Fukushima average
2015 5% above pre-Fukushima average
2014 5% above pre-Fukushima average
2013 15% above pre-Fukushima average
2012 13% above pre-Fukushima average
Disclaimer: This is an amateur volunteer run service. Human error can provide incorrect information, and equipment malfunction can produce false readings. Do not rely on, or take action upon information presented here, without further research.
We’re on the way to Albuquerque, so I looked in on their newspaper this evening to see if anything interesting was happening. The Albuquerque Journal just let everyone know that there was another serious “human error” at Los Alamos National Laboratory:
When I think about the founding of Los Alamos National Laboratory in 1942, I shake my head at the arrogance of Robert Oppenheimer and his pals in deciding that the people of the Pueblo tribes in the valleys surrounding the lab simply didn’t matter. The Pueblo people had lived in the region since 1200 B.C. according to archaeologists, but the area’s original residents were deemed expendable in the event of an accident with widespread consequences.
This page should be one of the most visited on the internet. Fukushima is still cooking away, and will only get worse. Much worse? How much worse, we don’t know, since professional liars and poltroons (i.e., Tepco) are managing the cleanup.
Meanwhile, the “muh coal mining job” types are literally boiling the oceans. As the comment below points out, methane emissions are poised to surge. We’re going to need Categories VI, VII, VIII for the megahurricanes that are about to ensue.
But at least our leaders understand the magnitude of the issue. That’s why they take private jets for short trips, and that’s why our president spends his time fretting about whether he’ll get Steph Curry’s autograph. We’re fucked, folks, and I’d like to personally thank Trump voters for being so suicidally dumb.
This is the very definition of “climate change” which is a nice way of saying that humans have toasted the planet. There’s no going back from this as the methane released by not-so-permafrost worldwide will make CO2 emissions look like a mere nuisance in comparison.
24th August 2017 – Japan’s Tepco gets slapped with new U.S. lawsuit over Fukushima
Extracts:
Tokyo Electric Power Co Holdings said on Thursday it has been hit with another lawsuit filed in a U.S. court seeking $5 billion for compensation over the 2011 Fukushima nuclear disaster, the second filed against the utility in a U.S. court.
The suit filed by 157 individuals is seeking that amount to set up a compensation fund for the costs of medical tests and treatment they say they need after efforts to support the recovery from the world’s worst nuclear disaster since Chernobyl in 1986.
6th September 2017 – MEPs to raise alarm on Fukushima food imports
Extract:
The draft resolution, seen by EUobserver, said “there are sufficient reasons to believe that this proposal could lead to an increase in exposure to radioactive contaminated food with a corresponding impact on human health”.
In a briefing which Green MEP Rivasi gave to journalists last July, according to a summary provided by her office, the French politician implied that the proposal on Fukushima was a bargaining chip in the negotiations for the FTA, and called it a “scandal”.
14th September 2017 – EU parliament opposes bid to reduce testing of Fukushima food imports
Extract:
The European Commission, the EU’s executive arm, wants to reduce the list of foods subject to radiation tests before they can be imported into the bloc, which currently includes rice, mushrooms, fish and other seafood.
A resolution passed by a large majority of MEPs called on the commission to withdraw its proposal, saying it was “very difficult to verify whether the measures proposed are sufficient” to protect European consumers and there was reason to think it “could lead to an increase in exposure to radioactive contaminated food.
This short animation of Northern and Southern Hemisphere air circulation, shows why we can get detections so far south.
Report
Caloundra August 2017 – Radon levels have been low and would not account for the month average increase. There was only 24 mm of rain for August. Significant day average increases coincided with Eastern Pacific air flows.
Caloundra August month average, year comparisons.
2017 17% above pre-Fukushima average
2016 8% above pre-Fukushima average
2015 5% above pre-Fukushima average
2014 4% above pre-Fukushima average
2013 8% above pre-Fukushima average
2012 9% above pre-Fukushima average
Disclaimer: This is an amateur volunteer run service. Human error can provide incorrect information, and equipment malfunction can produce false readings. Do not rely on, or take action upon information presented here, without further research.
14th largest solar flare ever recorded released from the Sun. Reports suggest it has the potential to damage parts of the electrical grid. So we have this major solar flare occurring at the same time as an unprecedented hurricane.
Great Solar Flare | September 6, 2017
Current Solar Data (from NOAA). At preset there is an X-class flare event, an electron, and proton storm, plus a major disturbance showing on the Magnetometer.
Two nuclear power plants are in the probable path of Hurricane Irma “the largest hurricane ever recorded in the Atlantic Ocean”. Most coastal power plants are “Built to withstand a Category 5 hurricane.” Their owner FPL aka Florida Power & Light is not telling the press in Florida exactly when the plants will be shut down, but the owner’s P.R. man Peter Robbins says the reactors “will be shut down well in advance of the storm making landfall” in Florida.
There is no “Category 6” on the Saffir Simpson Scale to measure hurricanes, but that’s the number being thrown around on hurricane afficionodo chat-websites. We’ll likely get to see how much of a structural cushion for a really big Category 5 was built into these FPL plants.
The first plant the strongest hurricane winds, and perhaps the eye, will reach is the one south of Miami called Turkey Point Nuclear Generating Station. The plant is located in Homestead Florida. You’ll read that it’s on the south side of Biscayne Bay, but realistically the bay is simply a mild curve on the shoreline directly on the Atlantic. The tiny barrier island east of the plant provides no protection from storm surge.
The other nuclear plant in the path of the hurricane is St. Lucie Power Station which is much farther north, on a narrow barrier island right on the Atlantic called Hutchinson Island. Between the ocean and the actual structure containing the reactor is a very narrow beach, about 600′ of mangrove swamp and a normal sized parking lot. I’ve been on that beach and it’s incredibly narrow. If you want to see the plant on a satellite photo type in Port St. Lucie FL which is the nearest town.
From Federal public records available on the internet, dating to 2010 and 2011, it appears that spent fuel rods are stored in casks on site at both of the oceanside plants.
If you want to keep track of what’s going on at these nuclear plants in the storm I’ve found that Alex Harris reporting for the Miami Herald is keeping track of what is going on with them.
The uradmonitor private monitoring system has a number of active stations in Texas. On the opening page it is important to select radiation monitoring from the drop down “Sensor” box at the top left of the screen, or you will be seeing temperature readings instead.
Been keeping an eye on the Texas radiation monitors. As the flooding has increased the number of online local radiation monitoring stations has been decreasing significantly!
International list of real time Radiation monitoring stations can be helpful in tracking radiation events worldwide.
Hurricane Harvey hit the Texas Coast with 130 mile per hour winds, with the eye wall hitting Rockport Texas with winds measured by storm chasers at 150 mph. Rockport is called the “Texas Riviera”. Rockport is the city of many Texans’ fond youthful memories, because of its pristine Blue Wave beach, the most popular in Texas for children safely wading and swimming in Aransas Bay, which is protected from big waves which constantly hit Texas’ barrier islands.
Rockport had both extremely wealthy as well as poor and working class residents, 4 museums, 6 boat harbors, elegant restaurants and many private art galleries, antique stores, and chic boutiques. Unfortunately due to Hurricane Harvey, Rockport and its surrounding Aransas County lost 60% to 70% of its homes, which ranged from trailers and old houses inhabited by the poor to million dollar houses with boat docks for weathy retirees and weekenders from San Antonio and Austin. The State of Texas has bused off to San Antonio the poor people who relocated to a hurricane shelter in a Rockport school, but roughly 40% of the 10,000 person population, plus first responders from out-of-town, remain.
Once Hurricane Harvey left Rockport, it violently thrashed several other communities to the northeast along the Texas Gulf Coast, and caused severely damage to their housing supply: Port Lavaca, Palacios, Matagorda, Bay City, Freeport and Lake Jackson, actually on estuaries of the Gulf of Mexico and the City of Victoria which is inland.
Outside of these Texas Gulf communities are miles and miles of beautiful green farms, marshes and oak woodlands. Now the people remaining there after the hurricane may end up with additional stress caused by allegations that there is a risk of an accident at the 7,000 acre cooling pond/lake for 2 nuclear reactors at the South Texas Project (STP) 80 miles up the Coast from Rockport, north east of Palacios Texas.
On August 29, 2017 the nuclear/public safety group “Beyond Nuclear” sent out a press release [http://www.beyondnuclear.org/home/2017/8/29/groups-call-for-immediate-shutdown-of-south-texas-nuclear-po.html] describing the fact that the nuclear plant is still being operated at full capacity despite the following: The nuclear plant does not have “cooling towers”. Instead the plant is cooled by a 7,000 acre man made lake which sits between the nuclear plant and Matagorda Bay, an estuary of the Gulf of Mexico. Beyond Nuclear explains in their press release the threat of collapse of the earthen walls of that manmade lake because of intense flooding on Texas’ own Colorado River, which is 1.5 miles east of the nuclear plant. The owners and operators of the STP nuclear plant put out a counter-statement to Reuters: https://www.reuters.com/article/us-storm-harvey-arkema-idUSKCN1B92J9
The problem is that the 7,000 acre cooling lake for the nuclear plant is on “private property” behind fences, and no members of the public or the press can get inside to independently verify the stability of the “dirt walls” surrounding the lake.
You can find the South Texas Project nuclear project site by typing the following address into Google Maps: 12090 FM Road 521, Palacios, TX 77465. The reactors are due north of the round-shaped man made lake which is easily findable even when you adjust the scale of the map outwards to take in the surrounding communities.
Beyond Nuclear’s concerns expressed in their press release are based on the intense flooding which is occurring outside and beyond natural river banks on land to the north, almost all the way to Dallas. Most rain which falls on “Central Texas” drains southward through coastal communities and out into the Gulf of Mexico. Thus the worst flooding in a massive storm occurs in coastal areas.
During the 1986 Chernobyl nuclear accident the Soviet government initially evacuated people in an 80.5 kilometer (50 mile) area around the nuclear plant. During the 2011 Fukushima nuclear accident the Japanese government initially evacuated people in a 20 kilometer (12 miles) area around the nuclear plant. During the Three Mile Island nuclear accident (which was far less serious than Chernobyl or Fukushima) the State of Pennyslvania ultimately evacuated people in a 20 mile radius of the nuclear plant. Each government substantially reduced their evacuation zones several months after the accident.
Here’s a chart naming the small cities surrounding the STP nuclear reactors on that manmake lake north east of “Downtown Palacios” on Matagorda Bay of the Gulf of Mexico.
City Name/ Population #/ Distance to STP Reactors
Palacios 4,700 10 miles
Matagorda 36,800 10 miles
Bay City 18,000 15 miles
Port Lavaca 12,400 38 miles
Freeport/Lake Jackson 39,700 40 miles
Victoria 67,800 50 miles
Rockport 10,000 80 miles
Houston Metropolitan 5,628,000 80 miles from Inner Beltway 610
Port Lavaca and its environs and Freeport are the location of 10+ huge, isolated petrochemical plants whose operations are complex and which should not be abandoned during a nuclear emergency evacuation.
The South Texas Project nuclear power plant is owned by NRG Energy (44%), Austin Energy (16%) and CPS Energy (40%) and operated by STP Nuclear Operating Company. A few days ago, STP Nuclear Operating Company put out this hard to read news release, as Hurricane Harvey first entered Houston: http://www.stpegs.com/storm-information/?view=mobile The news release said the nuclear power plant was still operating at full capacity.
Forbes magazine also published an online article lauding the continued full-tilt operation of the STP nuclear plant’s 2 reactors in the wake of the hurricane, failing to mention the physical condition of the earthen walls of the 7,000 acre man made lake/cooling pond as flood waters on Texas’ Colorado River overflowed their banks 1.5 miles to the east.
Say a prayer for the people of the Central Texas Coast, from Freeport to Rockport, that the earthen walls of that massive round-shaped cooling pond/lake stay intact despite the flood waters around it.
Hurricane Harvey, expected to be a very slow moving Category 3 hurricane, with winds at 120+ mph, is expected to hit the Texas Gulf Coast on 8/25/17 in the late evening. Currently the eye of the storm is expected to hit the coast in Matagorda County. The hurricane winds will be the strongest east of the eye. Wind driven storm surge flood water is expected to be 12 feet high along the coast and a few miles inland.
South Texas Nuclear Generating Station is located in Matagorda County, north east of the city of Palacios, Texas. The nuclear generating station relies on a 7,000 acre circular cooling pond south of the reactors which will be subject to those hurricane force winds. The reactor buildings and control room are said to be built to withstand a Category 5 hurricane. Press releases concerning past hurricanes say that the nuclear plant’s operators shut down 2 hours before a hurricane is scheduled to hit.
40 years later and this NBC News documentary on Nuclear Waste could have been recorded yesterday.
Danger! Radioactive Waste — Full Program
NBC originally aired in 1977 and was produced by Joan Konner.
Nothing has changed!
IMHO: This piece of HISTORY documentary is COMPELLING and clearly spells out the future and shows some of the negligent waste dumping of the past. (I’m guessing currently too, if not the USA then there’s all the others.) The out of control waste issue is building by the minute. The only thing I could compare this issue to, is a snowball in Hell.
🙁 I wish everyone could see this NBC documentary.
It’s a solid piece of evidence that proves they knew the risks. Thank you Joan Konner.
This short animation of Northern and Southern Hemisphere air circulation, shows why we can get detections so far south.
Report
Caloundra July 2017 – The local background level increase on 7th July coincided with an increased detection of Radon gas in the air. This increase in Radon levels would not account for all of the day average increase. There were no significant rain washout events. The wettest day was the 6th, with 14mmm of rain. What created the significant background increases for June and July this year?
Caloundra July month average, year comparisons.
2017 17% above pre-Fukushima average
2016 8% above pre-Fukushima average
2015 5% above pre-Fukushima average
2014 5% above pre-Fukushima average
2013 5% above pre-Fukushima average
2012 9% above pre-Fukushima average
Disclaimer: This is an amateur volunteer run service. Human error can provide incorrect information, and equipment malfunction can produce false readings. Do not rely on, or take action upon information presented here, without further research.
Midwest’s Upper and Lower Michigan peninsula’s and eastern Wisconsin, except for one elevated rain, test normal for radiation throughout July 2017 as does the food and drink as reported in Eat Me!
RADIATION TESTS
Default Pacific USA time zone unless otherwise indicated
July 27, 2017
8:30 pm EDST INT Southwest Michigan 1st floor room: 37.2 CPM^
July 24, 2017
8:20 pm EDST INT 4TH STORY ROOM PETOSKY MI: 30.0 CPM^
July 24, 2017
2:00 pm EDST EXT FORMER BIG ROCK NUCLEAR PLANT AREA WEST OF PETOSKY MI: ~24 CPM^
July 21, 2017
10:25 pm EDST INT MACKINAW CITY MI 2ND FLOOR ROOM LAKESIDE ABOVE LAKE HURON: 29.2 CPM^
July 20, 2017
8:00 pm EDST INT MUNISING MI 3RD FLOOR ROOM LAKESIDE ABOVE LAKE SUPERIOR: 33.4 CPM^
July 16, 2017
12:16 am EDST INT MANITOWOC WI 3RD FLOOR ROOM RAIN SAMPLE: 81.8 CPM^ OR 55% ABOVE BACKGROUND. WAS NOT RADON DECAY AS ENVIROREPORTER.COM “BETA WATCH” MAP OF U.S. RADON DISTRIBUTION SHOWS.
12:01 am EDST INT MANITOWOC WI 3RD FLOOR ROOM LAKESIDE: 52.9 CPM^
July 14, 2017
NOON EDST INT Southwest Michigan 1st floor room: 35.7 CPM^
July 10, 2017
7:30 pm EDST INT Southwest Michigan 1st floor room: 35.1 CPM^
July 8, 2017
8:00 pm EDST INT Southwest Michigan 1st floor room: 36.1 CPM^
7:55 am CDST INT O’HARE INT AIRPORT: 31.9 CPM^
As this event started in early June, the bench area around the monitoring GammaScout Geiger counter was cleaned, and the GammaScout was also cleaned to eliminate the possibility of dust contamination. This has made no difference, as background levels remained higher than usual. This is the Southern Hemisphere winter. Until now, no June pre or post Fukushima background has been higher than 7% above average. We have 10 years of local records to refer to.
It was mostly dry for the month, with only 20mm of rain for the whole month. The local live radon monitor did detect small increases in local Radon levels that coincided with recorded background radiation level increases. These Radon level increases would have been a contributing factor to the background level increase, but not significant enough to be the only factor.
Caloundra June month average, year comparisons.
2017 20% above pre-Fukushima average
2016 7% above pre-Fukushima average
2015 3% above pre-Fukushima average
2014 7% above pre-Fukushima average
2013 7% above pre-Fukushima average
2012 3% above pre-Fukushima average
The main isotopes detected were Beryllium Be-7 and Lead Pb-210. Beryllium Be-7 can be created naturally in trace amounts by spallation in the upper atmosphere by cosmic rays. Lead Pb-210 is the decay daughter of naturally occurring Radon-222 decay.
The scintillator device used for testing loses sensitivity with increasing isotope energy (keV). Taking the difference in sensitivity into account, the Be-7 peak is around 14 times higher than than the chart indicates. The Pb-210 would be around twice as high as show on the chart.
That is a lot of Be-7 in 34 grams of material. Would the levels of Pb-210 and Be-7 detected in the organic material collected from the water tank filter be sufficient to explain the significantly elevated local background levels here in June?
My Theory
There must have been a significant amount of cosmic ray spallation happening in the upper atmosphere recently, to produce this much Be-7.
The sun is becoming far less radiant. The sun is going into one of it’s quiet periods. These occur approximately every four hundred years. Less radiance means the sun’s heliosphere is much weaker. The sun’s heliosphere acts as a shield, protecting the Earth from in coming cosmic rays. A much weaker heliosphere means more cosmic rays strike the upper atmosphere, which results in more atmospheric spallation, hence more Be-7 is detected in the water tank filter test.
I notice that when the elevated detections occurred in June, the wind was mostly coming from an easterly direction, off the Pacific Ocean. This suggests that volcanic and earthquake releases of naturally occurring Radon-222 into the atmosphere, was also a contributing factor.
Disclaimer: This is an amateur volunteer run service. Human error can provide incorrect information, and equipment malfunction can produce false readings. Do not rely on, or take action upon information presented here, without further research.
The detection of cesium-137 from the primary Fukushima Pacific ocean plume has been measured and is increasing.
“The coastal average concentration of cesium-137 is now at 2.7 Bq per m3 according to data from samples collected in October through December 2016 which are now available. The highest concentrations were sampled from Winter Harbour in December which, at 4 Bq per m3 is our second highest measured activity to date, after the initial detection back in February 2015.”
➡ Cesium-137 will be hazardous to life for over 300 years!
I am sure, if there’s cesium, there’s a lot of OTHER kinds of radioactive contamination too. The media and the Nuclear Industry don’t seem to talk about that much, if ever.
Combine these tests/readings and the dust test readings consistently done by EnviroReporter.com along with other readings from user vital1 that also show increases or consistency over time. This tells me the contamination is indeed, obviously, global and continuing.
Long term projections or discussions for what the Fukushima TRIPLE MELTDOWN is ‘really’ going to do to us all, just don’t seem to happen and if they did, would people read them or believe them. (?)
This accident shows the potential risk faced by nuclear workers everywhere. It appears at least two failures occurred to expose the workers to inhalation of long half-life alpha emitters. First, a torn plastic bag containing powdered plutonium, and second, the failure of filtration masks to stop the powdered plutonium from reaching the workers lungs. Whether due to faulty masks, or seepage around the seal of the masks on the face, the consequences for these workers are dire.
Long half-life emitters, once released into the environment are a long term risk for anyone coming in contact with them. If the medicines used to help expel the radioactive particles fail to substantially reduce the contaminate load in the workers lungs, they will be looking at a significantly elevated risk of cancers for the remainder of their. lives. Even people nearby them will experience elevated risk if exposed to radioactive particles shed from lungs. Hopefully, there will be a medical intervention that can clear the bulk of the contamination from their bodies. I wish these workers and their families well. It is a tragic accident and hopefully they will be able to receive treatment to save their lives.
Certainly, procedures to reduce the risk of future accidents of this type need to be developed.
6th June 2017 – Seven more Fukushima residents diagnosed with thyroid cancer
Extracts:
Seven more Fukushima Prefecture residents who were aged 18 or under at the time of the 2011 nuclear accident have been found to have thyroid cancer, the prefectural government said Monday.
The number of Fukushima residents suffering from thyroid cancer now totals 152, the prefectural government said in a meeting of an expert panel.
Comment:
In the light of all the overwhelming evidence, just deny the facts! The comment by the official is laughable.
2017 7% above pre-Fukushima average
2016 20% above pre-Fukushima average
2015 4% above pre-Fukushima average
2014 13% above pre-Fukushima average
2013 7% above pre-Fukushima average
2012 7% above pre-Fukushima average
Year and month average local background radiation levels from 2007 to 2017.
Disclaimer: This is an amateur volunteer run service. Human error can provide incorrect information, and equipment malfunction can produce false readings. Do not rely on, or take action upon information presented here, without further research.
March 11, 2011 through June 2, 2017 and counting: EnviroReporter.com has produced more than 9,249 special tests and original reports including 3,045 measurements and analyses from nine affiliated Radiation Stations and 6,204 samples and radiation experiments from Radiation Station Santa Monica California. EnviroReporter.com has over 2,200,724 readers and 1,580,275 viewers along with the 24,369 people who have seen Radiation Station Glendale California‘s continuous online streaming. Over 213,751 viewers have watched 101 original videos on our YouTube channel. Thanks to you, we’ve received 7,847 comments and tens of thousands of Facebook ‘likes’ for our site, investigations and Facebook channel. Thank you for your continuing interest and support.
Nukpro’s Shelter-in-Place in a Radiation Emergency, or just any old Run of the Mill emergency.
If you print it out you can use the check list provided. It also has a notes section with links to free resources to enable you to do more research on the subject.
Caloundra April 2017 – This April saw a lot more Southern Ocean air flows reach this location. As we have seen numerous times, Southern Ocean air flows cause a drop in local temperature, and radiation levels.
2017 10% above pre-Fukushima average
2016 33% above pre-Fukushima average
2015 8% above pre-Fukushima average
2014 22% above pre-Fukushima average
2013 9% above pre-Fukushima average
2012 12% above pre-Fukushima average
Year and month average local background radiation levels
Disclaimer: This is an amateur volunteer run service. Human error can provide incorrect information, and equipment malfunction can produce false readings. Do not rely on, or take action upon information presented here, without further research.
9th May 2017 – “Emergency Alert” Declared At Nuclear Facility In Washington; Evacuation Ordered, No-Fly Zone In Place
Extracts:
As Breaking911 reports, some workers were being evacuated while others were advised to shelter-in-place. The Hanford Fire Department is on scene and updates will be posted as they are available. Workers in the vicinity are still being sheltered as a precaution.
Actions taken to protect site employees include:
Facility personnel have been evacuated
As a precaution, workers in potentially affected areas of the Hanford Site have gone indoors
Access to the 200 East Area of the Hanford Site, which is located in the center of the Hanford Site, has been restricted to protect employees
3rd May 2017 – Nuclear Reactor Wastewater Will End Up In Your Drinking Water
Extracts:
The council voted four to two in favor of the decision to process 70,000 gallons of nuclear reactor wastewater in its public sewer system. La Tour voted against the measure.
“Apparently Beaver Lake is so big it doesn’t matter, but it just makes me uneasy to know we are putting our waste in our drinking water supply,” La Tour said.
Comment:
Tritium will be in the nuclear wastewater they intend to dump into the Fayetteville Arkansas community water supply. They have been told it will be safe. Here is a video that reveals independent research on the biological effects of radioactive Tritium. Tritium is something to be very concerned about!
04.12.2011 – Radioactive Berkeley: No Safe Dose
Extracts:
The video also expressed a public concern over children visiting the Lawrence Hall of Science to exposure to tritium emissions from the Lawrence Berkeley National Laboratory’s (LBNL) National Tritium Labeling Facility.
Are the source of these background increases from the Namie forest fires in Japan?
Japanese radiation monitoring stations indicating background increases in the last 24 hours.
There are small spikes in radiation levels showing up on the Japanese ATMC monitoring network. Start with the Kitaibaraki and Takahagi monitoring stations South of Fukushima, and work your way down the East coast of Japan. Some Eastern in land stations are also showing a spike in background levels.
The spikes are also showing up on the ATMC Tokyo monitors. When I looked last night, Australian time, the Nuclear Emergency Tracking Centre Tokyo monitors were also showing a background increase.
If you click the Animate button at the left bottom of the Nuclear Emergency Tracking Centre map, you will see the 24 hr background level increases reflected in the number of stations showing elevated levels over a 24 hour period.
Since yesterday, the wind direction has changed to a northerly direction, so in the animation you see the elevated levels moving from the southern stations to the northern stations on the NETC animation map.
30th April 2017 – Fukushima authorities ask troops to help deal with forest fires near crippled nuclear power plant
Extracts:
Fukushima prefecture has asked the Japanese Self-Defense Forces for help in handling forest fires that have swept areas near the crippled Fukushima power plant, local media report. Strong winds are hindering the firefighting efforts, however.
The forest fires broke out near the town of Namie, some seven kilometers from the disabled Fukushima Daiichi Nuclear Power Plant, on Saturday evening, Japanese NHK broadcaster reported.
Comment:
There is no mention in this article of the potential for the re-dispersal of radioactive contamination downwind, by the fire and strong winds. Anyone downwind should be closely monitoring the situation!
The present wind direction indicates potential contamination could blow South East and then inland.
Cassini–Huygens is an unmanned spacecraft sent to the planet Saturn.
(with 73 lb – of plutonium-238 and some cameras)
➡
“Had there been any malfunction causing the Cassini space probe to collide with the Earth, NASA’s complete environmental impact study estimated that, in the worst case (with an acute angle of entry in which Cassini would gradually burn up), a significant fraction of the 33 kg[26] of plutonium-238 inside the RTGs would have been dispersed into the Earth’s atmosphere so that up to five billion people (i.e. almost the entire terrestrial population) could have been exposed, causing up to an estimated 5,000 additional cancer deaths[40] (0.0005 per cent, i.e. a fraction 0.000005, of a billion cancer deaths expected anyway from other causes; the product is incorrectly calculated elsewhere[41] as 500,000 deaths), but the chance of that happening were less than one in one million.” https://en.wikipedia.org/wiki/Cassini%E2%80%93Huygens#Plutonium_power_source
I wonder who makes the final decision to GAMBLE with literally everything and on behalf of what?
I know I certainly didn’t get to vote on it. 😉
Plutonium-238 is a very powerful alpha emitter.
Plutonium-238 has a decay rate, half-life of 87.7 years.
“On December 22, 2015, the Oak Ridge National Laboratory reported that its researchers had successfully produced 50 grams (1.8 ounces) of Pu-238.”
“After an analysis of this sample, production of 300 to 400 grams (11 to 14 oz) of the material per year is planned to begin and then, through automation and scale-up processes, production will increase to an average of 1.5 kilograms (3.3 lb) per year.” https://en.wikipedia.org/wiki/Plutonium-238#U.S._production_ceases_and_resumes
On the state of Civil Defense and the re-emerging threat of nuclear war.
Writing about the unthinkable. Most would choose to ignore, even ridicule the thoughts. It may help a few readers, so I offer the following.
The potential for a rogue state / North Korea confrontation is greater now than ever. Preparedness is thought of as unfashionable, and the general state of denial of actual danger creates even more danger.
Everyone will do precisely the wrong thing in reacting to an attack. There will be no warnings issued, most countermeasures will fail, people will leave safe locations for unsafe ones. That mushroom cloud in the distance? Their first thought will be… “What a great selfie this will make!” Don’t forget your SPF 1,000,000 sunblock kids.
No Civil Defense shelters (except for the elites). No stockpiles of food, water, or radiation detectors. No drills for where to go, what to do, and for how long. Answers: Stay inside, away from windows, preferably underground for at least two weeks, breathe filtered air, drink emergency stocks of water, eat canned goods, keep fallout out. If you must be briefly outdoors, don Tyvek outer clothing then rinse off, strip off, and crawl back underground. And, get used to the dark when the batteries run out.
That’s why I’ve been working on my bucket list. Everyday I savor the (mostly) blue skies, fresh air, and a walk in the woods. I’ve updated my emergency supplies, and water stores. Plenty of plastic tarps and duct tape for sealing windows and doors.
I know I’m an amateur, not a real Prepper. And no one thinks “it” will ever really happen. At times, I feel it is ridiculous to even try to be prepared. But, at least I’ve thought about it, and I won’t make the mistake of rushing towards the windows to see what is happening when the flash goes off.
I knew someone who survived a nuclear attack. She was just one kilometer from the hypocenter of the blast.. Sheltering underground, she, and others, waited only a few hours before leaving the shelter. They walked around in the fallout, helping survivors for several weeks. Amazingly, just 15 years old, she survived the ordeal and lived to be 80. No special preparation, special clothing, or access to personal emergency stocks of food and water. She survived because she was in the right location at the right time, avoiding the initial blast and radiation. Then she and others eventually moved out away from the immediate area of destruction, and lived to tell about it.
Should we just hope to be one of the fortunate ones, to be sheltered by chance at the right time? Or should we choose to be ready?
The world is very tense at present, all the reports are indicating a major war could break out, so it would be a good idea to be prepared. Hopefully common sense will prevail, and conflict will be avoided.
A large number of people were desperate to find radiation monitoring station locations after Fukushima. They found this to be difficult because there was no comprehensive International list, plus some monitoring systems were difficult to find.
This free community resource was created after the Fukushima nuclear catastrophe so people could quickly locate International radiation monitoring stations in the event of a major nuclear event. It is regularly updated.
In the event of a major nuclear disaster or war, this site may become overloaded, so it is suggested that you download the PDF version of this list onto your personal device, laptop, mobile phone etc from this site. This way you can access the International Radiation Monitoring Station list from your personal device. Check this site for future updates to the list and download the latest version. Let people know this free resource is available.
List of International Radiation Monitoring Stations
Wind direction is an important factor in determining where the radiation will go. Under the “Helpful Tools and Services” item at the top of the page, you will find a link to the Nullschool 3D Earth wind map service.
This service allows you to see location wind direction at different heights. You can rotate the map by holding down your mouse on the map, and dragging. If you use your mouse scroll wheel you can zoom the map in and out.
If you click on the “Earth” item at the lower left corner of the Nullschool map page, a menu will pop up, that allows you to select the wind height.
Free Guides
These free guides can also be downloaded from the top of the International list page.
This short animation of Northern and Southern Hemisphere air circulation, shows why we can get detections so far south.
Report
On Thursday the 30th March 2017, the Sunshine Coast Australia was bracing for a torrential downpour from remnants of ex-Cyclone Debbie. The South East was going into shut down, schools and businesses closed. As the rain fronts came down the east coast of Australia, we saw spikes in local background levels.
On the 29th, the day average was 51% above average. On the 30th when the main weather system, left over from Debbie, came through, the local background 24 hour day average spiked even more. The day average was 0.215 uSv/hr which is ~115% above average for this location!
A part of this increase in background radiation level was probably caused by an increased amount of atmospheric Radon gas. More Radon gas is forced out of the ground during heavy rain events. The increase in Radon levels is seen in the live Radon monitoring chart, screen shot below. In my opinion not all this significant increase in background levels on the 30th, can be attributed to an increase in Radon levels.
The same advisory suggestions for March 2012 apply whenever one of these tropical rain events occur, as they did in 2012.
Report from March 5th 2012
Average background up to 8.30am 0.145uSv/Hr, 24 hr average 0.185 uS/Hr elevated – Advisory Issued
It may be wise to stay out of the rain. I am getting indoor peaks up to 0.63 uS/hr on the Geiger Counter, as this rain event moves through. It suggests it may be radioactively hotter outside. Maybe worth letting your local friends know. If you or a child gets wet in it, have a good shower when you can. I have no idea what isotopes are in the rain, only that my Geiger counter is registering 6x higher than our normal background radiation, in peaks. These peaks are only lasting for a very short period of time.
The March month average data indicates a steady in crease in Southern Hemisphere local background levels has occurred over the years, since Fukushima. If we are getting background increases here in the Southern Hemisphere, it suggests that areas in the Northern Hemisphere would be greater.
2017 38% above pre-Fukushima average
2016 39% above pre-Fukushima average
2015 33% above pre-Fukushima average
2014 31% above pre-Fukushima average
2013 32% above pre-Fukushima average
2012 24% above pre-Fukushima average
Year and month average local background radiation levels
Disclaimer: This is an amateur volunteer run service. Human error can provide incorrect information, and equipment malfunction can produce false readings. Do not rely on, or take action upon information presented here, without further research.
17th March 2017 – In first, government and Tepco found liable for Fukushima disaster
Extracts:
A court in Japan has ruled for the first time that the government and the operator of the crippled Fukushima No. 1 nuclear power plant were responsible for failing to take preventive measures against the March 11, 2011, quake-triggered tsunami that killed scores and forced tens of thousands from their homes.
The district court ordered the two to pay damages totaling ¥38.55 million to 62 of 137 plaintiffs from 45 households located near the plant, which suffered a triple meltdown caused by the tsunami, awarding ¥70,000 to ¥3.5 million in compensation to each plaintiff.
The case of the USS Reagan Sailors has draw on for years now. Most Americans are not aware of the injustice these servicemen and women have been subjected to! Some have already pasted away, and others as well as being sick themselves now have sick children. A large number of US military personnel have become seriously ill, after being exposed to Fukushima fallout during the 2011 earthquake relief effort in Japan.
These brave members of the US services should be supported, but there has been a news blackout! Their case has constantly been delayed. Look at how many views the video below has had since July 2015.
21st July 2015 – USS Reagan Sailors Sue for Nuclear Justice
Extract:
Attorney Charles Bonner gives an update on his class action litigation on behalf of military personnel harmed by exposure to Fukushima fallout during an aid mission. The suit targets the plant operator and its manufacturers.
Be aware I’m not an American citizen. I’m Australian.
When immune systems fail, heart muscles weaken and a doctor informs you that you have two types of rare cancer, then, not a lot else matters. A close relative of mine gave me this news not too long ago. She cried and said she should have listened to me when I advised her not to drink the milk after Fukushima. What do you say to that? I tried to console her with well, maybe it’s from when you lived in Simi Valley in the early 80’s or perhaps the fact you have lived within 2 miles of the Landfill in St. Louis for 20 years. I don’t think that helped much. 🙁
From my personal observation this scenario IS playing out more and more. To a faster and a far greater extent than we may all realize. Perhaps exponentially, but we’ll never know it.
IMHO – The Fukushima’s MELTDOWNS should be treated as an act of war. A war against our planet and the existence of every living thing as we know it. Japan, along with all countries and academics in the world really need to come together and be transparent. Organizing our knowledge base toward survival of this insane nightmare should be priority one.
This short animation of Northern and Southern Hemisphere air circulation, shows why we can get detections so far south.
Report for February 2017. (42% above average)
The Caloundra monthly average charts for February 2012 and 2013 showed wild fluctuations (Charts Below). Now the charts show less volatility, but the average background is higher. This suggests to me that everything is now more evenly mixed in the atmosphere. Even so, background levels have still increased. Interestingly, we had very little rain in February this year, compared to previous years.
Caloundra February month average year comparisons.
2017 42% above pre-Fukushima average
2016 41% above pre-Fukushima average
2015 30% above pre-Fukushima average
2014 40% above pre-Fukushima average
2013 39% above pre-Fukushima average
2012 37% above pre-Fukushima average
February 2017 had the highest recorded February month average background since Fukushima!
Disclaimer: This is an amateur volunteer run service. Human error can provide incorrect information, and equipment malfunction can produce false readings. Do not rely on, or take action upon information presented here, without further research.
13th February 2017 – Iodine 131 just reported by European Agency. Incident happened in January 2017!
Extracts:
As usual, we are warned after the fact.
And of course, the IRSN will carefully avoid telling us who is responsible for this pollution. Iodine-131, a radionuclide of artificial origin, was detected in January 2017 as traces in air at ground level in Europe.
Comment:
The largest detection seems to have been in Poland, from the 9th to the 16th of January 2017.
14th February 2016 – Stolen radioactive material found in Malaysian apartment building
Extracts:
Iridium-192, a substance which can potentially be used in a dirty bomb, has been found at a Malaysian apartment complex prompting fears that residents there may have been exposed to the hazardous material.
South Klang district police said residents needed urgent health checks after two stolen radioactive canisters were found with their seals broken, exposing people to the dangerous substance.
Humans are capable of receiving 20 millisieverts of gamma rays a year, however, these canisters had the gamma ray capacity of up to 300 millisieverts per hour, according to the ALEB.
Comment:
Worldwide, the theft of highly radioactive material happens much more frequently than the general public are aware off.
3rd February 2017 – Record radiation level detected inside damaged Fukushima reactor
Extracts:
TOKYO —
A record radiation level has been detected inside the No. 2 reactor at the damaged Fukushima Daiichi nuclear complex, with the estimated reading of up to 530 sieverts per hour, the plant operator said Thursday.
The new radiation level, described by some experts as “unimaginable,” far exceeds 73 sieverts per hour, the previously highest radiation reading monitored in the interior of the reactor.
An official of the National Institute of Radiological Sciences said medical professionals have never considered dealing with this level of radiation in their work.
Comment:
We don’t have the technology available to deal with these extremely high radiation levels! Neither man nor machine can withstand these levels of radiation. It has been nearly six years now, and the buildings are structurally deteriorating, and are located in an earthquake zone, another disaster waiting to happen!
Caloundra January month average year comparisons.
2017 42% above pre-Fukushima average
2016 41% above pre-Fukushima average
2015 40% above pre-Fukushima average
2014 41% above pre-Fukushima average
2013 52% above pre-Fukushima average
2012 43% above pre-Fukushima average
Report:
January 2017 saw the usual post Fukushima, seasonal increase in background level, as warmer air flows from the tropics reach this location.
Year and month average local background radiation levels
Disclaimer: This is an amateur volunteer run service. Human error can provide incorrect information, and equipment malfunction can produce false readings. Do not rely on, or take action upon information presented here, without further research.
My dear Environmental and politically concerned friends,
An action alert for your consideration. As a member of the resistance to trump’s fascist and racist coup of our government I would like to suggest we make a concerted effort to let corporations and their CEOs know that we will not tolerate their support of trump’s attack on our environment or women’s rights/human rights, civil rights or our freedom of religion and that means any religion. We also stand with our native brothers and sisters at Standing Rock and in solidarity of native Sovereign lands. If they expect us to buy their products we expect them to support these rights.
Everytime I see a senator or representative (state or federal) make a tweet, I Tweet back to them and suggest strongly if they want my support in 2018 they will stand strong with the people against the trump agenda. I am also doing this whenever I see a tweet from any Corporation and let them know that if they expect me to spend my shopping dollars with them that I will not do business with companies or corporations that support his fascist agenda. My wife and I started by calling L.L.Bean and letting them know that we would never buy from them again. They had gotten quite a number of calls and tried desperately to let us know they wanted our business. We told them we wanted their support for freedom. We have been using all types of social media, emails and the telephone. After seeing on the news how many of the large corporations acquiesced immediately when they thought their bottom line would be affected, I believe this to be a sound and important strategy and defense of Human Rights and the rights of the people to demand the government work for us and not the corporations.
“Once or twice in every generation a line is crossed so egregiously that where you stood on the issue will forever define you.” Kara Vallow
If you agree with this action please share it with your list and Friends, thank you for your time.
Caloundra December month average year comparisons.
2016 36% above pre-Fukushima average
2015 35% above pre-Fukushima average
2014 32% above pre-Fukushima average
2013 36% above pre-Fukushima average
2012 43% above pre-Fukushima average
Report:
Even thought December 2016 had a lower December month average background compared to December 2012, the 2016 year average background level was the highest recorded here since Fukushima. The 2016 year average was 25% above pre-Fukushima recorded year average. At this Southern Hemisphere location, the local year average background has seen an increase in local background levels since Fukushima (see chart below). If we are seeing a steady increase in year averages here in the Southern Hemisphere, it suggests that locations in the Northern Hemisphere are seeing much greater yearly increases.
Disclaimer: This is an amateur volunteer run service. Human error can provide incorrect information, and equipment malfunction can produce false readings. Do not rely on, or take action upon information presented here, without further research.
23rd December 2016 – Fuel removal at Fukushima reactor again faces delay
Extracts:
But the clearing work took longer than expected due to contamination being more widespread than previously thought, forcing TEPCO and the government to again put off the retrieval.
Radiation levels have now dropped as almost all of wreckage at the site has been cleared, TEPCO said. The government and TEPCO have said fuel retrieval at the No. 1 and No. 2 reactor buildings will start in fiscal 2020 or later.
Caloundra November month average year comparisons.
2016 32% above pre-Fukushima average
2015 37% above pre-Fukushima average
2014 29% above pre-Fukushima average
2013 30% above pre-Fukushima average
2012 31% above pre-Fukushima average
Report:
November 2016 had the the second highest month average local background since Fukushima. At the beginning of the month warm tropical air flows reached this location, this created the initial spike in local background levels. Background levels dropped for the rest of the month, as more Southern air flows reached this location, from the Southern Ocean.
Disclaimer: This is an amateur volunteer run service. Human error can provide incorrect information, and equipment malfunction can produce false readings. Do not rely on, or take action upon information presented here, without further research.
11th December 2016 – Mutated Blood Found In Humans In Japan — From Fukushima Radiation
Extract:
New blood types called Langereis and Junior, to distinguish them from traditional classifications. According to scientists, this phenomenon is associated with the leakage of radioactive substances resulting from the nuclear accident in Fukushima.
According to doctors, is to be expected in the near future to see additional changes. What scientists are saying in the future there will be at least another 15 new blood groups.
[Editor: We sourced this back to CCTV which gives no sources of its own other than “scientists” therefore this is not confirmed by EnviroReporter.com and is speculative.]
8th December 2016 – Tokyo increases Fukushima operator’s interest-free loan limit to $123bn
Extracts:
The extra 5 trillion yen ($44 billion) loan on top of the original 9 trillion yen ($79 billion) is destined to cover the costs of compensation and decontaminating areas around the plant, a source familiar with the matter told Reuters.
The government plans to have TEPCO and other utilities pay back the loans, Japan’s NHK World reported, as part of the cost will pass to consumers through higher electricity rates.
Last month the Ministry of Economy, Trade and Industry said that the combined costs of paying compensation for the Fukushima nuclear disaster and the decommissioning of the plant will almost double the initial estimate and will cost over 20 trillion yen ($176 billion).
Comment:
The Fukushima Nuclear Catastrophe cleanup costs just keep skyrocketing, with no end in sight!
24 November 2016 – Missing Bushehr Radioactive Device Raises Concerns
Extracts:
Tamimi told Asharq Al-Awsat newspaper that, along with the International Atomic Energy Agency (IAEA), there are concerns of negative impact of the Iranian nuclear program that could pollute the waters of the Arabian Gulf.
The chairman said most Gulf countries depend on the desalination of sea water and the matter is very critical especially if the contamination reaches desalination stations.
Comment:
The device went missing after the vehicle transporting it was stolen. How many times have I heard this same story over the years? So much for the nuclear industry’s radioactive material safety claim.
21st November 2016 – Fukushima reactor cooling system stops following quake & tsunami
Extract:
The cooling system of the third reactor at the Fukushima nuclear power plant has stopped circulating water following a powerful 7.3 offshore earthquake. TEPCO said it managed to restart the system some 90 minutes after the failure.
(Video) 16th November 2016 – Giant radiation shield built to cap Chernobyl’s damaged nuclear reactor
Extract:
A giant radiation shield is being manoevered over the site of the world’s worst nuclear accident in Chernobyl, Ukraine, in the final phase of a €1.5 billion (US$1.6bn) project to prevent the leaking of further radioactive material from the damaged reactor.
Comment:
Look at the size of this structure that they are moving into place, it is 350 feet tall and more than 530 feet long. This very expensive temporary cover will also need to be replaced in a 100 years!
The total cost of the Shelter Implementation Plan, of which the New Safe Confinement is the most prominent element, is estimated to be around €2.15 billion (US$3.09 billion).
2016 22% above pre-Fukushima average
2015 12% above pre-Fukushima average
2014 14% above pre-Fukushima average
2013 25% above pre-Fukushima average
2012 19% above pre-Fukushima average
Report:
There has been another up tick in background levels at this location for October 2016. This is the second highest October month average since the Fukushima nuclear catastrophe.
At this location in the winter months, air flows tend to come from the Southern Ocean, rather than from the tropical North. When this happens, local background levels tend to drop significantly, so compared to the summer months, winter local background levels approach pre-Fukushima levels. You can clearly see this seasonal variation in the yearly average background report, link below.
Yearly average background radiation levels
Disclaimer: This is an amateur volunteer run service. Human error can provide incorrect information, and equipment malfunction can produce false readings. Do not rely on, or take action upon information presented here, without further research.
Mom Lung Cancer, Dad, BLADDER Cancer, Brother, Rectum, large Tumor, sister, female Cancer,
STEP Mother, Cancer, Aunt BLADDER Cancer! Next Door Neighbor Cancer! All these Cancers, people who lived in Simi Valley from 1962-1980’s
Caloundra September month average year comparisons.
2016 12% above pre-Fukushima average
2015 5% above pre-Fukushima average
2014 6% above pre-Fukushima average
2013 15% above pre-Fukushima average
2012 13% above pre-Fukushima average
Report:
There has been a small up tick in background levels at this location for September. September 2013 and 2012 were the only years that had higher background levels here, since the Fukushima nuclear catastrophe.
At this location in the winter months, air flows tend to come from the Southern Ocean, rather than from the tropical North. When this happens, local background levels tend to drop significantly, so compared to the summer months, winter local background levels approach pre-Fukushima levels. You can clearly see this seasonal variation in the yearly average background report, link below.
Yearly average background radiation levels
Disclaimer: This is an amateur volunteer run service. Human error can provide incorrect information, and equipment malfunction can produce false readings. Do not rely on, or take action upon information presented here, without further research.
I guess the health and safety of the people who work and live around Los Alamos is more important than the health and safety of people who live around the Santa Susana Field Lab aka Rocketdyne:
2016 8% above pre-Fukushima average
2015 5% above pre-Fukushima average
2014 4% above pre-Fukushima average
2013 8% above pre-Fukushima average
2012 9% above pre-Fukushima average
Report:
At this location in the winter months, air flows tend to come from the Southern Ocean, rather than from the tropical North. When this happens, local background levels tend to drop significantly, so compared to the summer months, winter local background levels approach pre-Fukushima levels. You can clearly see this seasonal variation in the yearly average background report, link below.
Disclaimer: This is an amateur volunteer run service. Human error can provide incorrect information, and equipment malfunction can produce false readings. Do not rely on, or take action upon information presented here, without further research.
This ‘tour’ of the Fukushima plant was cut short.
Time Distance = Dose
Four inch sheets of lead line the roads, didn’t seem to help.
This video does cover some touchy, usually not mentioned topics. However, it leaves out some important ones too. Such as, how badly the ocean is being contaminated.
28th August 2016 – Public cost of Fukushima nuclear accident cleanup topped ¥4.2 trillion as of end of March
Extracts:
The public cost of dealing with the aftermath of the March 2011 nuclear accident at Tokyo Electric Power Company Holdings Inc.’s stricken Fukushima No. 1 plant topped ¥4.2 trillion by the end of fiscal 2015, it was learned Sunday.
According to the study, a total of ¥2.34 trillion was disbursed for decontamination of affected areas, disposal of contaminated waste and an interim storage facility for tainted soil. The expense was shouldered by the government, mainly through affiliated Nuclear Damage Compensation and Decommissioning Facilitation Corp.
Tepco and six other power utilities charged their customers at least ¥327 billion in electricity rate hikes after Japan’s worst-ever nuclear accident.
Comment:
¥4.2 trillion (around $628 billion) is an astronomical amount of money. This was the clean up cost up to the end of the 2015 fiscal year! What is the total cost now?
A very important point not mentioned in this report is the staggering costs involved in cleaning up the other seriously damaged Japanese nuclear reactors, that have been conveniently forgotten about by the mainstream media!
The Japanese Government admitted in May 2011 that there were a lot more nuclear reactors seriously damaged, not just the 4 at the Fukushima Nuclear disaster site. We have no real information on what has been happening at those other nuclear disaster sites, because of the news blackout.
Quote:
“According to Japan’s Nuclear and Industrial Safety Agency (NISA), the earthquake and subsequent tsunami affected fourteen nuclear reactors at four sites along the eastern coast the Fukushima Daiichi site (six reactors), Fukushima Daini site (four reactors), the Ongawa site (three reactors) and the Tokai site (one reactor). The most serious damage occurred at the Fukushima Daiichi Nuclear Power Station.”
I was the fourth child in my family and the only one born in Grand Junction, CO. I was diagnosed with CMT1A. It is a neuro muscular disease. I also have neuropathy. Is there anyone else who has been diagnosed with this disease? No one else in my family has this disease, including my parents. I did not inherit it and I am curious if uranium deposits etc. had anything to do with it.
Linda
2016 8% above pre-Fukushima average
2015 5% above pre-Fukushima average
2014 5% above pre-Fukushima average
2013 6% above pre-Fukushima average
2012 9% above pre-Fukushima average
Report:
At this location in the winter months, air flows tend to come from the Southern Ocean, rather than from the tropical North. When this happens, local background levels tend to drop significantly, so compared to the summer months, winter local background levels approach pre-Fukushima levels. You can clearly see this seasonal variation in the yearly average background report, link below.
Yearly average background radiation levels
Disclaimer: This is an amateur volunteer run service. Human error can provide incorrect information, and equipment malfunction can produce false readings. Do not rely on, or take action upon information presented here, without further research.
19th July 2016 – San Onofre Nuclear Leak Caused by Pushing Generator Limits, Watchdog Group Says
Extracts:
The cause of a leak in 2012 that led to the permanent shutdown of the San Onofre Nuclear Generating Station was steam generators being deliberately run too hot, too hard and too fast, according to a report released Tuesday by an independent watchdog organization.
“Edison knew they were pushing San Onofre’s steam generators past the original design limit, but did it anyway for the sake of short-term profits and to correct other design deficiencies as a result of SCE’s unverified analytical assumptions,” Arora alleged.
“MP Andriy Artemenko (Radical Party) has said that on July 16 a serious accident with leakage of nuclear fuel was recorded at Khmelnytsky nuclear power plant (NPP), while the press service of National Nuclear Generating Company Energoatom denied the information.”
The surface wind direction is coming from the Ukraine to this Romanian location at present.
This maybe a coincidence, or a malfunctioning station. It is the only private monitoring station in Romania showing very high peak detections at present. No official Ukrainian background monitoring stations are showing any significant background increase.
Tools you need to keep an eye on this, can be found on the International Radiation Monitoring Station list page,
Non-categorized event in Ukraine on July 21 2016 10:29 AM (UTC).
Extract:
MP Andriy Artemenko (Radical Party) has said that on July 16 a serious accident with leakage of nuclear fuel was recorded at Khmelnytsky nuclear power plant (NPP), while the press service of National Nuclear Generating Company Energoatom denied the information. “I learnt from reliable sources that the government is hiding the seriousness of the accident occurred on July 16 at reactor one of Khmelnytsky NPP with the depressurization of the reactor primary circuit and leakage of radioactive coolant to the nuclear steam generator. In addition, nuclear fuel leaked, which is a critical situation,” he wrote on his Facebook page. He said that on Monday a meeting with participation of Deputy Prime Minister Volodymyr Kistion and Energy and Coal Industry Minister Ihor Nasalyk was held on Monday to discuss the issue and one more government meeting is scheduled for Thursday. The press service of Energoatom told Interfax-Ukraine that information of Artemenko is not true. He took it from unknown and unverified sources and misinformed citizens, they said. “On July 16, reactor one of Khmelnytsky NPP was disconnected from power grid as there was leakage at nuclear steam generator one, and Energoatom informed about it quickly on its website. This is not leakage of nuclear fuel… Radiation level on the industrial site and adjacent areas have not changed.
At this location in the winter months air flows tend to come from the Southern Ocean, rather than from the tropical North. When this happens local background levels tend to drop significantly, so compared to the summer months, winter local background levels approach pre-Fukushima levels. There was a small background level spike on the 19th of June. This occurred as a significant rain event passed over the area.
2016 7% above pre-Fukushima average
2015 3% above pre-Fukushima average
2014 7% above pre-Fukushima average
2013 7% above pre-Fukushima average
2012 3% above pre-Fukushima average
Long term local background information can be found here,
Disclaimer: This is an amateur volunteer run service. Human error can provide incorrect information, and equipment malfunction can produce false readings. Do not rely on, or take action upon information presented on this web site, without further research.
There was 123 mm of rainfall in May, at this location.
Small amounts of Pb-210 and Be-7 where detected, plus a very small detection of a possible 77 X-ray from Lead Pb-212, which is the decay daughter of Radon-220. Beryllium Be-7 can be created naturally in trace amounts by spallation in the upper atmosphere by cosmic rays. Lead Pb-210 is the decay daughter of naturally occurring Radon-222 decay. Both Be-7 and Pb-210 can also be released from nuclear power plants, and nuclear accidents. The detection of the Pb-212 77 keV X-ray probably indicates the presents of a small trace of volcanic ash in the air.
Entergy’s FitzPatrick Nuclear Power Plant on Lake Ontario near Syracuse, NY is scheduled to be permanently closed in early 2017. However, the U.S. Coast Guard noticed a problem today, with an unknown fluid seemingly coming from the power plant and leaving a sheen on the lake: https://www.dvidshub.net/image/2690081/sheen-lake-ontario
As EPA’s political appointee staff prepares to go out of office, they’re apparently positioning themselves to help their friends, including vastly increasing the allowable radioactivity in drinking water:
The tweet from SafeCast on their twitter is not just lame, it’s frightening.
SAFECAST @safecast Jun 15
“Readings were 1 day 6 mos ago. Likely xray machine or person getting radiation”
A pregnant woman walking down the street that day in New York did not have a clue. A major RADIOACTIVE EVENT may have occurred according to Safecast’s data. Those Safecast numbers were very high.
IMO – Could be doing more damage than terrorists with guns or explosives and nobody will know… therefore, nobody will care.
What sort of evil exists within governments that wish to keep this sort of information from becoming publicly known. It is the government’s #1 responsibility to PROTECT it’s people. Any so called government that is not doing so, or is actively removing technology that can protect us, must be held to account. This is evil and it is madness! Raising levels of acceptable exposures to radioactivity internally or externally is an abomination, not rooted in any science whatsoever. It makes one think our own government is trying to kill us. What other conclusion can you come too???
@Michael, This whole exercise shows there is no system in place to investigate this type of detection, by private or government organizations.
“We are down to 9 (NINE) working beta stations out of 130 sites. Beyond outrageous.”
The USA government monitoring system is being dismantled, at the same time they are raising the acceptable amounts of radiation exposure to ridiculous levels. They are still using the outdated dose model. Anyone who has done any research understands this antiquated model has no baring on the serious health effects that are caused by the internal ingestion of artificial isotopes.
Mind you, this is also happening in other countries. There seems to be a concerted worldwide effort through regulatory capture, to increase the acceptable toxic load populations will accept. These sick bastards don’t care about human populations, your children or grand children, their only objective is profit margins.
Look at the latest EPA Draft Protective Action Guide (PAG) for Drinking Water after a Radiological Incident,
@vital1: That really is pathetic. Do individual operators on these systems keep records? Six month lag is not acceptable. Out of the New York sites Buffalo‘s beta and gamma graphs work. Inspecting both reveals that the beta and gamma increases don’t correspond very closely meaning all these RadNet gamma graphs are very helpful, if at all. Thank you vital1 for being our One Man International Radiation Station!
I requested permission to publish the Safecast’s representative’s email reply. They pointed me to the Safecast Twitter account, as Safecast does not publicly comment or advocate, it simply collects and publishes data.
Here is Safecast’s Twitter reply to my query on the New York detection.
A couple of quotes,
“Normal, not error, not a concern.”
“Reading were for 1 day 6 mos ago”
Full details here.
As we explained in email to Peter this is normal, not error, not a concern.
“Total estimated cost: $2,478,647 (per year), includes $2,338,804 annualized capital or operation & maintenance costs.”
(Only 9 out of 130 rad detectors working… where’s that maintenance money going?)
DATES: Comments must be submitted on or before August 15, 2016.
ADDRESSES: Submit your comments, referencing Docket ID No. EPA–HQ–OAR–2003–0041, online using http://www.regulations.gov (our preferred method), by email to a-and-r-Docket@epa.gov, or by mail to: EPA Docket Center, Environmental Protection Agency, Mail Code 28221T, 1200 Pennsylvania Ave. NW., Washington, DC 20460.
“EPA’s policy is that all comments received will be included in the public docket without change including any personal information provided, unless the comment includes PROFANITY, threats, information claimed to be Confidential Business Information (CBI) or other information whose disclosure is restricted by statute. ”
@Michael, I have contacted Safecast through their web site contact form.
This was sent to Safecast.
Very elevated background New York detection on the Safecast monitoring network. In some locations it is above 3.99 uSv/hr. Not sure how often Safecast refreshes the maps, so there is some uncertainty how recent this detection is.
Is this a genuine detection that would need investigation by local authorities?
I don’t live in the USA, so someone needs to contact the relevant local authority if it is.
Hopefully you can quickly establish if this detection is a result of equipment malfunction, or something to be concerned about.
@vital1: There is no relevant local authority in a country now down to just 9 out of 130 working beta monitors. Safecast could be contacted by you should you want to investigate. One beta machine works in New York state and shows moderate increase. Gamma is active in NYC.
A very elevated background New York detection is showing on the Safecast monitoring network. The map shows detections above 3.99 uSv/hr in some locations. Not sure how often Safecast refreshes their maps, so there is some uncertainty how recent this detection is.
Is it a genuine detection? That would need investigation by local authorities.
“One of the main things I learned here is that we ARE disposing of radioactive waste from Nuke plants. The ways we are disposing and using this stuff will amaze you. It’s in products and building materials etc”
Yes, they turn the waste into a product, that way you can make a profit out of it, and you don’t have expensive disposal costs. It doesn’t matter about the suffering, pain, and environmental damage you cause, when money is your God!
I think they got the crazy road building idea from the USA.
(see Note 2 below)
from the EnvoroReporter Comments Archive:
_________
Chase says:
July 9, 2011 at 9:35 pm
Regarding Fukushima:
“We are at an exposure level that should not be there!”
“No way to contain it, no way to clean it up… they do NOT realize the extent of the problem.”
“Do we have a world wide problem? YES!”
“Are we prepared? NO!”
– Dr. Doug Rokke (pronounced rocky)
Radio interview at the University of Illinois by Roger Cooper located at this link –
47 minutes: http://www.podomatic.com/profile/rogercooper99
(note: link no longer working, I am glad I wrote down at least a couple of these things.)
I learned a tremendous amount from this interview. One of the main things I learned here is that we ARE disposing of radioactive waste from Nuke plants. The ways we are disposing and using this stuff will amaze you. It’s in products and building materials etc… Such as airplane ballasts, golf clubs and more… if these things burn in a crash or fire… then uh oh.
Note 1: DU – Depleted Uranium – DEPLETED does not mean depleted is this case. It’s a word that is used specifically to deceive.
Note 2: Interstate 40 near St. Louis, MO has concrete made with DU. The workers who built that freeway are very sick.
__________
I can also remember seeing Safecast readings of a very ‘hot’ Santa Monica freeway. If you get stuck on the freeway there it’s ‘sort of like’ getting an unnecessary free x-ray. I am pretty sure this ‘stuff’ has been ‘dumped’ and ‘mixed’ into all kinds of stuff that most are unaware of. 🙁
7th June 2016 – Radioactive soil to be used in base layer for new roads
Extract:
The Environment Ministry on Tuesday drew up a basic plan to use soil contaminated with radioactive substances from the Fukushima No. 1 nuclear plant to build roads.
Under the basic plan, tainted soil with relatively low radioactive cesium concentrations of up to 5,000 to 8,000 becquerels per kilogram will be used to form the base layer of roads.
There were a couple of significant day average spikes a the beginning of May 2016. From then to the end of May, day average background levels dropped significantly, from a high of 47% above average to 6%, a near pre-Fukushima normal background.
This significant drop in background over the month occurred as less tropical air, and more Southern Ocean air flows reach this location. May, April, March and February this year have seen the highest May, April, March and February month averages since Fukushima.
Caloundra May month average year comparisons.
2016 20% above pre-Fukushima average
2015 4% above pre-Fukushima average
2014 13% above pre-Fukushima average
2013 7% above pre-Fukushima average
2012 7% above pre-Fukushima average
Cairns May 2016 Report – “My readings taken with my old Gamma Scout have been surprisingly flat. I have recorded the readings of the newly received second Gamma Scout as well, which appear on the left side of the graph, not on the right, as they should be.”
May background comparison chart, Cairns (red) compared to Caloundra (orange).
Disclaimer: This is an amateur volunteer run service. Human error can provide incorrect information, and equipment malfunction can produce false readings. Do not rely on, or take action upon information presented here, without further research.
There is a high detection showing at Boston’s Logan International airport terminal B building, on the Safecast community monitoring network. It is ~ 3.99 uSv/hr!
a. Someone may have taken their Safecast Geiger counter through a TSA scanner?
b. Some sort of food or goods irradiating quarantine facility?
c. Malfunctioning detector?
Is it something to be concerned about?
I have looked around at a number of International airports on Safecast. At present Bostons Logan International airport is the only one showing a large radiation detection at a terminal building.
I suggest someone in the US makes inquiries to eliminate if it is something to be concerned about, or not.
Also, another high detection is showing up on what would have to be a ship, ferry, or boat off the coast of Boston, on the Safecast community monitoring network. From the colour of the detection marker, it looks like around ~ 0.87 uSv/hr.
Thanks vital 1 for the information. FYI there is a website dedicated to shielding products and sensors relating to EMF exposure. There are ways of lessening the exposure to microwaves in our homes and on our persons. Here is a link to the site; http://www.lessemf.com/
In a world of increasing toxic load, it is important to reduce anything that may cause biological stress to the body. There is ample research showing that Mobile phone and WiFi technologies that are based on microwave radiation, can potentially be harmful.
Page two of this free Wifi Safety Guide provides a list of practical things people can do to reduce their family’s exposer to WiFi radiation.
RT is reporting today, 5/24/16, that the decomissioning chief at Fukushima, a Mr. Naohiro Masuda, has reported that 600 tons of melted fuel is “missing”. RT also says in sum and substance that following the tsunami and explosions 3 reactors gained critical temperature and burnt through the respective reactor pressure vessels, concentrating fuel somewhere on the lower levels of the station currently filled with water.
Masuda supposedly said that while all the melted fuel from Reactor 1 poured out completely, an estimated 30% to 50% of the fuel from Reactors 2 and 3 remained in and around the reactors. Masuda supposedly estimated that approximately 200 tons of fuel debris lies within each unit, which makes in total about 600 tons of melted fuel mixed up with metal construction elements, concrete and whatever else was “down there”.
Matsuda supposedly said “It’s important to find it [the fuel] as soon as possible,” that Japan does not yet possess the technology to extract the melted fuel. “Once we can find out the condition of the melted fuel and identify its location, I believe we can develop the necessary tools to retrieve it.”
RT claims that TEPCO hopes to locate and start removing the missing fuel by 2021. RT said that TEPCO’s decommissioning plan implies a 30-40 year period before the consequences of the melt downs are “fully remediated”. Among the remediation projects are some 10 million plastic bags full of contaminated soil concentrated in gigantic waste dumps scattered around the nuclear facility.
So that’s what TEPCO will admit as this time. TEPCO had been planning on building a commercial power generating reactor on leased land near Palacios TX, a plan which TEPCO seemingly abandoned after the Fukushima accident…As they say in Texas “Thank the lord for that.”
19th May 2016 – Former Prime Minister Koizumi backs U.S. sailors suing over Fukushima radiation
Extracts:
“I learned that the number of sick people is still increasing, and their symptoms are worsening,” he told the news conference.
The group of about 400 former U.S. Navy sailors and Marines alleges the utility did not provide accurate information about the dangers of radioactive material being emitted from the disaster-struck plant.
According to lawyers for the group, seven of its members have died so far, including some from leukemia.
Comment:
Most Americans are not aware of the hell these former marines and sailors from the Ronald Reagan task force have been through since Fukushima. The numbers who have become ill has been continually increasing. Some of their children born after the event have also suffered serious health issues. It should have been front page news at the beginning, but there has been a considerable effort to hide their plight from public view!
Well, April 2016 had the highest April month average since records have been kept here. April, March and February this year have seen the highest April, March and February month averages since Fukushima. The wind direction this time of the year usually comes down the East Coast of Australia from the Northern tropics. The last few months have seen a lot of Eastern equatorial winds drawn South from the Eastern Pacific, and then directed up the East Coast of Australia.
In 2015 the year average background level dropped, to the lowest post Fukushima level. So what is creating the present up tick in background?
Caloundra April month average year comparisons.
2016 33% above pre-Fukushima average
2015 8% above pre-Fukushima average
2014 22% above pre-Fukushima average
2013 9% above pre-Fukushima average
2012 12% above pre-Fukushima average
Cairns April 2016 Report – “The readings were fairly flat throughout April. My baseline has slightly diminished from former 0.125 to 0.120 uSv/hr or even less.”
Thanks to the Cairn’s station operator for providing this day average Cairns and Caloundra comparison chart.
Disclaimer: This is an amateur volunteer run service. Human error can provide incorrect information, and equipment malfunction can produce false readings. Do not rely on, or take action upon information presented here, without further research.
I was shocked recently when a gentleman walked into the radiation station monitoring room here, and set all the Geiger counter alarms off! At first I though a major nuclear event was occurring. 🙁
After the computer based Geiger counter also stated to alarm, I picked up the GammaScout Geiger counter, and noted it was reading 2.67 uSv/hr. I was standing ~ 2 meters away from him at this point. I had been a lot closer. 🙁
It turned out he had just come from a CT scan at a Sunshine Coast Medical Centre here in Australia.
He asked if he should leave? I politely said yes.
I spoke to him later outside on the footpath, mind you keeping my distance.
It turned out that the medical center hadn’t told him squat about what they had injected him with, or given him any warnings or post procedural advice!
I was shocked at the levels, and pointed out they should have warned him to stay clear of people, including his wife, and particularly children, for at least 24 hours, plus drink plenty of water for 24 hours to flush it out of his system.
So at one metre he was 5.34 uSv/hr, at half a meter 10.68 uSv/hr, and at quarter of a meter 21.36 uSv/hr! If he just happened to hold his grandchild or a baby in his arms, well you get the picture, it would be probably greater than 80 uSv/hr.
A medical chest X-ray is approximately an instantaneous 100 uSv, but at half a metre, you’re getting a full body X-ray every ten seconds, while in the presence of this gentleman!
This all happened rather quickly as you can see from the recorded chart below. The GammaScout Geiger counter is on 60 second data collection, so it didn’t pick up the full peak of my visual observation.
The medical profession has become far too complacent in its handling of these highly radioactive materials, and are placing their patients and the public at risk, in my opinion.
bionerd23 – Insane radioactivity in the nuclear medicine operating room
Uploaded on Feb 19, 2010
tiny, radioactive iridium 192 seeds. 10 Curie. 370.000.000.000 atoms decaying every second. and i left my gamma scout with that intense radiation… making an interesting documentary about the levels of ionizing radiation in brachytherapy (to be precise: prostate cancer afterloading).
Latest public detail on plans to move fuel rods from California’s decomissioned nuclear plants to the western-most part of the Texas Panhandle (not West, Texas which is near Waco):
The direct road access to the site can be viewed by doing a map search for Andrews County Texas. It’s due north of Odessa TX which is on U.S. 20, which merges into U.S. 10 east of El Paso. The proposed disposal site also due east of WIPP in New Mexico.
As a result, to get the fuel rods out of California’s populated areas as quickly as possible I would expect them to travel on U.S. 10 to Phoenix, down to Tucson, and on to El Paso merging onto U.S. 20 before Odessa. The other feasible freeway route would be to head towards Kingman Arizona on U.S. 40 and then head due south in New Mexico on U.S. 285 to join up with U.S. 10 east of El Paso.
There appears to be no railroad access to Andrews, Texas.
Note, however, the article claims the fuel rods will not be moved until many years from now.
Fukushima artwork by Tomiyama Taeko. (95 years old)
I personally find paintings #3 and #4 to be very moving.
““JAPAN: Nuclear Power Plant” (Image #4) we see the artist’s interpretation of the wreckage that is Fukushima Daiichi power plant. This image of the bleak, crumbling frame of the plant, a skeleton against an equally bleak landscape, speaks more boldly of the fragility and hubris of this man-made accident than photos or words. “”
“”She describes the growing sense of anger with the folly of building so many power plants in this earthquake-ridden archipelago, as she drove with her friend around the abandoned villages and farmlands in the area. In later reflections on this experience, Tomiyama associates the devastation at Fukushima with Japan’s defeat in WorldWar II. “”
7th May 2016 – Spike in radiation levels after toxic waste leak at Washington nuclear site
Extracts:
The recent readings from the Environmental Protection Agency (EPA) obtained by RT have revealed that a sharp spike in the radiation level had been registered in Richland on the morning of May 5.
The readings show the random jump when the toxic fume rates briefly reached around 410 CPM [counts per minute], nearly the highest possible level.
“When they move that waste, they have a lot more vapors coming out from the stacks. The wind was blowing toward me from that stack. That changed my life and hurt my lungs,” Seth Ellingsworth, who became seriously ill from the fumes, told RT. “It kept getting worse and worse.”
@ Michael, we also had another day here with higher than normal day average background levels. These are the highest day averages for May recorder here. We have local background radiation levels going back to 2007.
Still, the detection here, is not as high as your Santa Monica detection indicates.
Are the Santa Monica and Caloundra background level increases from a new critically event at Fukushima, or from a another recent nuclear event that has been covered up???
Alert Caloundra 3rd May 2016 – On the 3rd May we had a series of storms come through just after midnight. They dropped torrential rain for about 45 minutes, the rest of the day was fine. Background average for the day was 45% above the pre-Fukushima average. The last few days logging data also suggests the GammaScout is functioning fine, as it showed lower background the day before on the 2nd May.
The wind direction plays a big part in detections here. The background monitoring station here is located on a headland, so East, North East and South East of its location is the Pacific Ocean. Maroochydore, the the closest wind detection station, is about ~20 Km away. By comparing the Maroochydore wind direction information against the background chart, it shows the higher detections on the 3rd, were mainly detected when the wind had an Easterly aspect, off the Pacific Ocean.
The question is, what has been creating the background increases over the last few months? In 2015 the year average background level dropped, to the lowest post Fukushima level. May statistically has traditionally been a quiet month, with lower background levels. We have never detected day averages for May at these high 45% + levels, pre or post Fukushima.
Alert Caloundra 1st May 2016 – Here is the day average and the 24hr charts, showing the spike in background coming through. This spike put the day average up to 47% above the pre-Fukushima average.
We had some heavy rain, the first in a long time. The wind direction was all over the place during the event. The next few days may indicate if there was some Geiger counter contamination present, as the monitoring GammaScout was given a clean out and inspection after this spike came through. Nothing obvious was found to indicate contamination was responsible for the spike in background.
H.R. 4979, the Advanced Nuclear Technology Development Act of 2016
…and H.R., Nuclear Utilization of Keynote Energy Policies Act.
Geoffrey H. Fettus Senior Attorney Natural Resources Defense Council, Inc.
This is how it happens. Our legislators in action.
NOTE: The video doesn’t actually start until about 30 minutes in.
(of course the youtube comments are turned off)
I cannot fathom what these legislators and their friends are doing even though I see it before my very eyes.
– They want to remove hearing requirements for Nuclear Plants.
– Ease all license renewals. etc… etc…
– Lessen payments from the energy companies so they can make more money.
(yes, they actually say that)
– Creating new product options. ie… portable Nuclear Plants
— …hundreds of millions, if not billions of dollars are on the line.
These Nuclear Proponents sound more like an infomercial for SAFE CLEAN RELIABLE Nuclear Power.
(Always said with a smile, or is that a smirk?) :rolleyes: Repeated over and over.
IMO – Legislators that don’t know squat are reading from scripts that they don’t really understand yet purport to be factual. It’s a scam! 😡
There was a low 96mm of rainfall in March. The rain water testing has been consistent for months now, with the usual Pb-210 and Be-7 being detected, plus the detection of a possible 77 X-ray from Lead Pb-212, which is the decay daughter of Radon-220. Beryllium Be-7 can be created naturally in trace amounts by spallation in the upper atmosphere by cosmic rays. Lead Pb-210 is the decay daughter of naturally occurring Radon-222 decay. Both Be-7 and Pb-210 can also be released from nuclear power plants, and nuclear accidents.
The detection of the Pb-212 77 keV X-ray probably indicates the presence of a small trace of volcanic ash in the air.
Disclaimer: This is an amateur volunteer run service. Human error can provide incorrect information, and equipment malfunction can produce false readings. Do not rely on, or take action upon information presented here, without further research.
While researching California Grizzly Bears, (now extinct), I realized that the last one shot and killed was just several miles from where I now live.
Less than 100 years ago…
“The last hunted California grizzly was shot in Tulare County, California, in August 1922. Later, in 1924, a grizzly known to roam an area of the Sierra Madre Mountains (Santa Barbara County) was spotted for the last time, and thereafter, grizzlies were never seen again in California.” https://en.wikipedia.org/wiki/California_grizzly_bear
That got me to pondering… What’s it going to be like 100 years from now? (maybe 10) What will our descendants look back upon and say “That sure was stupid, what were they thinking?” I am certain Nuclear Power and TRIPLE MELTDOWNS like Fukushima will be at the top of that list.
Once a species is gone, it’s gone and it don’t take long.
@Michael, A lot of people are not aware that the earth’s magnetic shield weakened by ~15% in the last 150 years. This is one of the earth’s primary defenses against solar flares and coronal mass ejections from the Sun. The other is the earth’s atmosphere.
I have been a sun watcher for many years, and know it was very unusual for such small solar events in 2011 to produce such Northern Light displays, so far south. These unusual Northern lights displays indicated to me that the electrical dynamics of the upper atmosphere had been changed by the large radioactive releases from the Fukushima Nuclear Catastrophe.
Reports from what would be considered relatively weak solar storms have recently been causing more electrical equipment failure and transformer fires around the world.
What does this mean?
The combined effect of a weaker magnetic field, and the atmospheric ionizing radiation damage from Fukushima, now means that a much much smaller solar event, one significantly smaller than a “Carrington Event”, could wipe out large parts of earth’s electrical infrastructure!
Here is a research paper below, and a report, to support my view that the Fukushima Nuclear Catastrophe has damaged the upper atmosphere. The research paper only covers the atmospheric damaging effects of Krypton-85. It doesn’t take into account the atmospheric damage caused by the thousands of other ionizing isotopes released into the atmosphere by the Fukushima Nuclear Catastrophe!
Article:
WORLD METEOROLOGICAL ORGANIZATION GLOBAL ATMOSPHERE WATCH
Extract: (The extract is from the bottom of page 56.)
“Importance Krypton-85 (85 Kr) is a radioactive noble gas which decays with a half-life of 10.76 years, emitting mainly β -particles of mean energy 251 keV. The main sources of Krypton-85 are the nuclear fuel reprocessing plants and various nuclear reactors.
The nuclear weapons tests in 1945-1963 contributed about 5% of the total Krypton-85 in the atmosphere, whereas its natural sources can be neglected. Radioactive decay is practically the only mechanism of Krypton-85 removal from the atmosphere.
The present background concentrations of Krypton-85 in the atmosphere are about 1 Bq/m 3 and are doubling every 20 years. At this level, Krypton-85 is not dangerous for human beings, but the air ionization caused by Krypton-85 decay will affect atmospheric electric properties.
If Krypton-85 continues to increase, changes in such atmospheric processes and properties as atmospheric electric conductivity, ion current, the Earth’s magnetic field, formation of cloud condensation nuclei and 57 aerosols, and frequency of lightning may result and thus disturb the Earth’s heat balance and precipitation patterns.”
Fukushima Diary – Update: 25th May 2015 – Still 960,000Bq Cs-134/137 and 2,336,000,000Bq noble gas discharged from reactors to the air every single hour
Extract:
Regarding noble gas (such as Kr-85), PCV (Primary Containment Vessel) gas control system detected 2,336,000,000 Bq of gas discharged from Reactor 1-3 every hour this April. Tepco states noble gas passes by as radioactive cloud to cause only external exposure so the exposure dose caused by the discharged noble gas should be significantly small.
@vital1: This is absolutely fascinating information. Earthquake science is one of the ‘newest’ sciences so major theories buttressed by facts are very exciting. We’ve been keeping an eye on the Sun since Lights Out in 2014 and a CME space quake causing earthquakes does make sense theoretically. It doesn’t help predicting quakes as CMEs aren’t the only cause nor does it seem possible to pinpoint where they’d happen. The quartz theory seems right on target as well. Here in Southern California, quakes seem to be swarming and we are way overdue for a real mega-disaster. The Southern California Earthquake Center and Southern California Seismic Network are excellent sources of information reminding everyone here to be ready to be self sufficient for three months post said Quakecalypse assuming survival from resultant destruction and fires. Thank you vital1 for this terrific new knowledge.
A number of powerful earthquakes have rocked the southern Japanese city of Kumamoto and regions, located on the southern island of Kyushu. I and many others have been keeping an eye on all the Southern Japanese radiation monitoring systems, and at present we have nothing to report. There was a small general up tick reported on the island of Kyushu on the NETC Monitoring network, but we have also seen these small background up ticks like this on this monitoring network, before the earthquake.
Sendai nuclear power plant is the only one operating on the Island at present. Crazy that they even turned it back on after Fukushima!
Everything is still very unstable as an earthquakes swarm is going right through the centre of the island of Kyushu. So it is worth keeping an eye on those Japanese radiation monitors, and news reports.
You can find a list of the Japanese radiation monitoring stations here, so you can keep an eye on the situation yourself.
One of the greatest things about the Internet is that as an individual you can have access to some of the latest research information. Years ago this type of information would only have been available to top scientists in their field.
NASA scientists have proposed a new theory on the cause of major Earthquakes. If the magnetosphere is hit by Solar flares and CME (Coronal Mass Ejections) from the Sun, of a great enough intensity, it can cause what they call a space quake. This is equivalent to a earth quake of 5 or 6 on the Richter scale.
The theory goes that the solar flare, or CME of sufficient magnitude strikes the Earth’s Magnetosphere, this places pressure on the Earth’s tectonic plates and can cause Earthquakes. The Magnetosphere is a naturally formed magnetic field around the Earth created by the Earth’s iron core, it protects the Earth against Solar flares and CME radiation.
Here is an analogy. Imagine that the Earth is like a a boiled egg that you have dropped. When you pick it up the egg shell is broken into many pieces. If you gently squeeze that egg, the shell, representing the Earth’s tectonic plates that make up the Earth’s crust, will move against each other. So when the solar flare or CME hits the Earth’s magnetosphere, it squeezes it, which in turn puts pressure on the Earth’s crust.
Both the recent New Zealand and Japanese Earth Quakes in 2011 occurred during an X chase solar flare activity which also caused a geomagnetic storms in the earth’s magnetosphere. During the Japanese quake it was reported that the Earth’s magnetosphere was also hit by a CME at the same time the X class flare hit.
Here is a site where you can monitor solar flare activity in real time.
If this theory is correct, this info is great because it will give an idea when something may happen, it just won’t indicate accurately where or when.
New discoveries suggest where and when may be able to be predicted. One study has found that satellites have been recording variations in ULF or VLF radio signals (Ultra/Very Low Frequency) signals from where Earthquakes were about to occur. Also slight increases in earth crust levels can be an indicator. So these two satellite projects are exploring these indicators to see if they can give an early warning of where an Earthquake may occur.
Another study has found that major earthquakes usually occur where there are large quartz deposits in the rock formations on fault lines. There appears to be more water in quartz deposits which allows more slippage in the crust at those points. This would also explain why electrical disturbances can appear before an Earthquake. Lights in the sky or animals who use magnetic field information to navigate becoming confused or dying, plus domestic pets acting strange. Think of the old crystal quartz radios. Quartz and mineral crystals in bed rocks under a lot of pressure would generate an electrical signal giving an indication of an impending quake.
So there appears to be significant advancements in in Earthquake predicting technologies. Putting it all together as an accurate predictor may be closer than we think.
A survey of 1000 survivors from 311. Voices and opinions too.
“…more than 80 % say either that no progress is being made or that reconstruction is going more slowly than expected.”
When asked, “Do you still feel mental and physical affects?”
“Even five years after the disasters, as many as 60 percent of sufferers say they still feel effects. The number of those who say they still feel depressed, unmotivated or affected in many other ways tends to INCREASE yearly in annual surveys. Ten percent of respondents say it’s painful to keep on living. ”
Comments such as…
“When my grandson who was in kindergarten was living in an emergency shelter, he lost all his hair. When he painted pictures, he used only black. I was worried. I think it was because our family separated after the nuclear accident.” (Anonymous, Minamisoma, Fukushima)
I wonder why we never saw photos of this kind of direct radiation sickness?
“Many survivors say they will not or cannot return to their hometown.”
When asked, “What do you think of the restarting of Nuclear Power Stations?”
72% said Unacceptable 😐
22 % said Inevitable
6% said necessary
What will things be like in another 5 years as the TRIPLE MELTDOWNS continue and the FALLOUT spreads and accumulates? They failed to ask the survivors that question.
Well, March 2016 had the highest March month average since records have been kept here. March and February this year have seen the highest March and February month averages since Fukushima. The wind direction this time of the year usually comes down the East Coast of Australia from the Northern tropics. The last two months have seen a lot of Eastern equatorial winds drawn South from the Eastern Pacific, and then directed up the East Coast of Australia.
Caloundra March month average year comparisons.
2016 39% above average
2015 33% above average
2014 31% above average
2013 32% above average
2012 24% above average
Cairns March 2016 Report – “Daily average radiation readings for last month March 2016 for Cairns (red) compared to your readings (orange). Readings were fairly steady, with a minor bump around the 20 – 24th of the month, which was associated with hot weather.”
Thanks to the Cairn’s station operator for providing this day average Cairns and Caloundra comparison chart.
Disclaimer: This is an amateur volunteer run service. Human error can provide incorrect information, and equipment malfunction can produce false readings. Do not rely on, or take action upon information presented here, without further research.
Given the emergency in India, I don’t want to post “cute” animal stories. However, given the fact that hunting and eating wild boar in Germany is still heavily regulated because of Chernobyl fall out and contamination of the boars’ forage, it is interesting to see that the abandoned towns around Fukushima are being over run with wild boar as well. http://www.mirror.co.uk/news/world-news/rampaging-radioactive-wild-boars-causing-7705006
There has been a Nuclear event at the Kakrapar Nuclear Plant in India. It has been going on for nearly three weeks now. I have posted two reports below by Dr. Gadekar, a renowned physicist, based in Sampoorna Kranti Vidyalaya, Vedchhi, Gujarat. He appears to be the only reliable independent source of information on this event at present.
If anyone knows of any publicly available radiation monitoring stations or networks, that are available in India, please post the links here.
12 March 2016 – Kakrapar Nuclear Plant Is Likely Undergoing A Loss-Of-Coolant Accident: Dr. A. Gopalakrishnan
Extract:
Till 7.00 PM on March 12,2016 , the DAE officials have no clue as to where exactly the PHT leak is located and how big is the rate of irradiated heavy water that is leaking into the reactor containment . However, some reports indicate that the containment has been vented to the atmosphere at least once , if not more times , which I suspect indicates a tendency for pressure build up in that closed space due to release of hot heavy water and steam into the containment housing . If this is true, the leak is not small , but moderately large , and still continuing. No one confirms that any one has entered the containment (in protective clothing) for a quick physical assessment of the situation , perhaps it is not safe to do so because of the high radiationfields inside . When NPCIL officials state that the reactor cooling is maintained , I believe what they may be doing is to allow the heavy water or light water stored in the emergency cooling tanks to run once-through the system and continue to pour through the leak into the containment floor through the break.
Comment:
It is unclear how serious the situation is, because of a lack of information from Indian authorities. Everyone should keep an eye on this one.
25th March 2016 – Nuclear Accident in Gujarat Enters Third Week, Lethal Gamble Continues
Extracts:
The PHWR design that is the mainstay of the Indian nuclear programme is a derivative of the Canadian CANDU design. It uses natural uranium as fuel and heavy water as both the coolant as well as the moderator.
LOCA is serious in any nuclear reactor, but in a CANDU it can be catastrophic. Unlike a PWR (Pressurized Water Reactor) (Koodankulam) or a BWR (Boiling Water Reactor) (Tarapur), CANDUs have a positive void reactivity coefficient. What this jargon means is that as the temperature rises in the absence of cooling following a LOCA water begins to boil. Voids are created. In a light water reactor like at Tarapur or Koodankulam, this means that not many neutrons get slowed down. In the absence of slow neutrons to cause further fission, the chain reaction automatically stops. This is an example of a passive safety system that does not need any active intervention on part of the operators. However, in a CANDU, the slowing down of neutrons is done by the moderator heavy water which is separate from the coolant heavy water. A loss of coolant accident here, does not affect the slowing down of neutrons. The chain reaction continues unless it is actively interupted. These reactions are taking place in timescales of nano to micro seconds and human reaction times are too slow for effective action. The RBMK type of reactor that exploded at Chernobyl also had a positive void coefficient of reactivity although it used graphite instead of heavy water for moderation.
19th March 2016 – It’s Not Just Cancer! Radiation, Genomic Instability and Heritable Genetic Damage
Extracts:
The radioactive contamination of the planet has killed tens of millions of babies, caused a huge increase in infertility, and increased the genetic burden of the human race and life on earth.
Using evidence ranging from Chernobyl to the nuclear Test Veterans to the offspring of radiographers we showed clearly that a dose of 1mSv from internal contamination was able to cause a 50% increase in congenital malformations. This identifies an error in the ICRP model and in the current legislation of a factor of 1,000.
It’s official – genetic damage in children is an indicator of harmful exposures to the father
Comment:
This excellent fact based article points out a very little discussed result of radioactive contamination exposure, Genomic instability. Genetic damage caused by radioactive contamination in the first generation, can be expressed in multiple generations of the offspring. One Russian study I read found up to 22 generations and counting, could be affected. This is a very important consequence of radiation contamination exposure that is not discussed.
Well, February 2016 had the highest month average since records have been kept here. This was a surprise to say the least considering the wind direction. The wind direction this time of the year usually comes down the East Coast of Australia, from the Northern tropics. Interestingly, most of the late February increases occurred when the wind direction was coming from South or SSE. Equatorial winds this year were drawn South from the Eastern Pacific, and then directed it up the East Coast of Australia. The East Coast of Australia surface wind direction for the later part of February is shown clearly at 2 minutes and 54 seconds into this Suspicious0bserver video.
.
Caloundra February month average year comparisons.
2016 – was 41% above the 4 year pre-Fukushima local average.
2015 – was 30% above the 4 year pre-Fukushima local average.
2014 – was 40% above the 4 year pre-Fukushima local average.
2013 – was 39% above the 4 year pre-Fukushima local average.
2012 – was 37% above the 4 year pre-Fukushima local average.
Cairns February 2016 Report – “My previous baseline used to be 0.125. Last month some readings were below the 0.120 mark. There were no extremes, both curves behave in a similar parallel fashion. Yesterday we had high temperatures and inland wind with thunderstorms, that increased the readings.”
Thanks to the Cairn’s station operator for providing this day average Cairns and Caloundra comparison chart. Cairns is red in this comparison chart, and Caloundra is yellow.
Disclaimer: This is an amateur volunteer run service. Human error can provide incorrect information, and equipment malfunction can produce false readings. Do not rely on, or take action upon information presented here, without further research.
18th March 2016 – Shocking health effects in Fukushima nuclear workers found under the official radiation dose limits
Extracts:
The First male Daichi nuclear site worker had an official total dose of 50mSv. “I suffered damages to kidneys, heart, etc. — all important organs in my body.”
The second male Daichi nuclear site worker had an official total dose of 56mSv. He said
“I went to such a severe accident site and worked at the risk of my life, but all I’ve got was this cruel reality and treatment!” I suffered thyroid damage, and had all my stomach removed.
The third male Daichi nuclear site worker had an official total dose of just 19.2mSv. He was diagnosed as having acute myelogenous leukemia.
My doctor said that “70% of the cells in your bone marrow were occupied by cancer. Without any treatment, you will die for sure.”
In my opinion it is criminal that large populations of Japanese men, women and children have been left to live in such contaminated areas. After so many nuclear catastrophes it is madness to allow the nuclear industry to carry on as normal, plus also allow it to expand by building new nuclear plants worldwide. We should be winding back the Nuclear industry as quickly as possible, and using renewable technologies which are much more efficient, and safer.
The nuclear industry and it leaders should be hell accountable for the untold number of lives that have been cut short by numerous nuclear accidents and the wide spread nuclear contamination, plus the enormous environment destruction they have wrought on the world and all living things.
This civilization sees itself as technologically advanced and enlightened, but will be remembered as the cause of one of the worst dark ages in human history.
Yahoo News story today, which you all [may] pick apart, concerning attempts at retrieving remains of fuel rods at Fukushima. https://ca.news.yahoo.com/fukushimas-ground-zero-no-place-man-robot-003153046–finance.html Contrast that part of the news story with your memories of stories of men actually digging out broken fuel rods at the sodium reactor at Rocketdyne Area IV using hand tools. Given his comment here on 3/6/16, Vital will get a chuckle at reporter’s claim that ambient radiation in some areas around Fukushima is only as bad as that in Tokyo.
South Texas Nuclear Project Electric Generating Station near Tres Palacios Bay south of Galveston on Texas Coast, built using GE design. Nobody living nearby with any level of sophistication to keep watch on the plant, except for the plant employees. Most locals living around the plant are low income rural residents who would not be watching or listening to word about troubles at the plant like the folks at San Ononfre did.
While the average Texas working man/technical employee prides himself on his knowledge and skill with sophisticated equipment (such as Texans needed to plug the gas well at Porter Ranch) I worry that no one independent is watching what goes on at the plant. I see the plant from the air every time I fly into/from Houston Hobby, and I worry about the Houston Metro area because it’s downwind from the plant. Houstonians are friendly and helpful, so if any Radiation Conversation II commenters learn anything about problems at the South Texas Nuclear Project Electric Generating Station please post them here so I can get the word out through my Houston relatives.
6th March 2016 – Tokyo was on the brink of nuclear catastrophe, admits former prime minister
Extracts:
He said he considered evacuating the capital, Tokyo, along with all other areas within 160 miles of the plant, and declaring martial law. “The future existence of Japan as a whole was at stake,” he said. “Something on that scale, an evacuation of 50 million, it would have been like a losing a huge war.”
Mr Kan admitted he was frightened and said he got “no clear information” out of Tepco, the plant’s operator. He was “very shocked” by the performance of Nobuaki Terasaka, his own government’s key nuclear safety adviser. “We questioned him and he was unable to give clear responses,” he said.
“We asked him – do you know anything about nuclear issues? And he said no, I majored in economics.”
The article and posts below, clearly lay out how serious the present situation is in Tokyo.
Tokyo Contaminated & Not Fit for Habitation, Doctor Says
Extract:
All 23 districts of Tokyo contaminated with radiation, worse than at Chernobyl after the accident, and blood cells of children under ten are showing worrying changes; the WHO, the IAEA & the Japanese government cannot be trusted.
Anecdotal evidence posted by matty1, on enenews.com, on March the 6th 2016.
Post 1:
“Tokyo is a thousand times more contaminated than belarus. 85% of the children in belarus have heart defects. Mita and Bove’ give Tokyo 5 years. Do not go to Tokyo. Nothing like this has ever happened. There is a tipping point going on. Tokyo is clamped like an iron fist. A no-persons city. It is criminal to even allow people to go there. People are dying mostly from being immunocompromised , stroke, cardiac arrest. Cancer explosion. There is an explosion of abortions and miscarriages there. Also birth defects.”
Post 2:
“The playground number of 480 msv is not anomolous. Enough rads in 2 hours for 1 year. I was on a train and it had to stop 3 time for ill people. People are living in a dream land.”
29th February 2016 – 3 ex-TEPCO execs indicted over Fukushima nuclear disaster – report
Extract:
The three top officials of Tokyo Electric Power Company (TEPCO) were indicted on charges of professional negligence resulting in death and injury, the Kyodo news agency reported on Monday. The officials are Tsunehisa Katsumata, 75, who was chairman of TEPCO in 2011, and two former vice presidents, Sakae Muto, 65; and Ichiro Takekuro, 69, the report added.
Comment:
There should be a lot more people indicted over the handling of this catastrophe!
The background levels here went up significantly in late January 2016. There was 2.47 times as much rainfall in January 2016 (133.6 mm), compared to December 2015 (54mm). Even with the increased rainfall, the amount of Pb-210 captured for January and December in the rain water filter, was approximately the same.
Pb-210 is the end product of radon daughter decay. There was more Beryllium-7 detected in January 2016. This was probably created from spallation in the upper atmosphere, by recent solar storm activity. No detectable Cesium is being detected in the rain water filter tests.
It is important to understand that when you look at a scintillator test chart like the one above, the peak highs can be deceptive.
The Scintillator device used for testing the rain water filter, is less sensitive with increasing isotope energy.
For example the scintillator may have ~50% efficiency near the low energy Pb-210 peak and ~7% efficiency near the mid energy Be-7 peak. So the maths tells us, that more Be-7 was detected than its peak high would indicate!
At best, the above chart is showing what was detected, it does not quantifying the amount.
17th February 2016 – ACTION ALERT: Join the nationwide citizens’ uprising against the EPA and lead poisoning of our public water supplies
Extracts:
We need 1,000+ samples to really do this right. The more, the better. For statistical certainty, we’d really like to have at least 20 samples from each large U.S. city. Using all these samples, we’re going to build an online USA map of water quality ratings, showing cities with high lead in RED so that everyone can finally see the truth about the safety of their local water supplies.
Don’t Americans deserve to know the truth about what’s in their water? We’ve been LIED to for too long, and it’s time for the lies to stop!
We can no longer trust the government to tell us the truth After the absolute criminal mischief carried out in Flint, Michigan by the Michigan bureaucrats and EPA do-nothings, all Americans now realize we cannot trust the government to tell us the truth about what’s in our water.
Comment:
I think it is a great idea to see citizen testing labs. This way you can get reliable independent information. Government’s are corrupt and can’t be trusted, as evidenced by the lies and ongoing cover up of the Fukushima catastrophe.
18th February 2016 – Radioactive material stolen in Iraq raises fears of Islamic State dirty bomb
Extracts:
The document, dated November 30 and addressed to the ministry’s Centre for Prevention of Radiation, describes “the theft of a highly dangerous radioactive source of Ir-192 with highly radioactive activity belonging to SGS from a depot belonging to Weatherford in the Rafidhia area of Basra province”.
The material is classed as a Category 2 radioactive source by the International Atomic Energy Agency, meaning if not managed properly it could cause permanent injury to a person in close proximity to it for minutes or hours, and could be fatal to someone exposed for a period of hours to days.
Comment:
There are regular reports coming in of highly radioactive material being stolen or being lost!
These reports don’t build confidence in the nuclear industry’s mantra of security and safety!
The words of President John F. Kennedy
July 26, 1963 upon signing the ban on above ground nuclear tests
[excerpts]
“Even then, the number of children and grandchildren with cancer in their bones, with leukemia in their blood, or with poison in their lungs might seem statistically small to some, in comparison with natural health hazards. But this is not a natural health hazard and it is not a statistical issue. The loss of even one human life, or the malformation of even one baby who may be born long after we are gone, should be of concern to us all. Our children and grandchildren are not merely statistics toward which we can be indifferent.”
“Nor does this affect the nuclear powers alone. These tests befoul the air of ALL men and ALL nations, the committed and the uncommitted alike, without their knowledge and WITHOUT their CONSENT. That is why the continuation of atmospheric testing causes so many countries to regard ALL NUCLEAR powers as equally EVIL; and we can hope that its prevention will enable those countries to see the world more clearly, while enabling all the world to breathe more easily.”
“Active seismic faults run across the island, and anti-nuclear environmentalists argue Taiwan is unsuited for nuclear plants.[5] A 2011 report, by the environmental advocacy group, the Natural Resources Defense Council, evaluated the seismic hazard to reactors worldwide, as determined by the Global Seismic Hazard Assessment Program data, placed all of Taiwan’s reactors within the highest risk group of 12 reactors within very high seismic hazard areas, along with some of Japan’s”
The Taiwanese Nuclear power station radiation monitoring system does not appear to be operating at present. That makes it difficult to assess if the earthquake has affected any of the Nuclear power stations. Maanshan Nuclear plant is on the southern tip of the Island.
The closest radiation monitoring stations are in Hong Kong in China, but at present the surface air currents are flowing across the island into the China Sea.
You can find the Chinese Hong Kong Radiation monitors, and the Taiwanese monitoring stations links here,
@Michael, very cost effective live Radon monitoring station equipment has recently become available.
In my opinion, any large underground gas release like Porter Ranch would be releasing Radon or Thoron into the local environment.
The question is how much?
The only way to find out is to test for it.
Here is information on how to set up is a very cost effective real time live Radon and Thoron monitor station. The older pre-built model cost us around AU$250 a year and half ago. It can be built as a kit, or purchased pre-built. If anyone is interested, I would suggest purchasing the latest professional model, as it fixes the vibration and humidity sensitivity issues found in the older model.
You can use the free open source Theremino Geiger software with it to chart Radon levels, in real time on a laptop screen, or portable device. Information on Theremino Geiger software can be found here.
Here is a Radon testing technique using a Geiger Counter. Unfortunately this method doesn’t enable the precise measurement of Radon air concentration. Even so, it will still let you know if there is significant amounts of Radon in the atmosphere.
After rain, testing a paper towel swab of a car bonnet with a Geiger counter can be effective way to test for Radon decay daughters. Unless you have a nuclear event happening, an initial high detection, that decays quickly in a few hours, indicates the presence of Radon decay daughters. If it is a large multi uSv/hr detection, it will take a lot longer before these daughter isotopes decay to near normal background levels.
General suggestions to get the best rain swab results.
It is important to wear surgical gloves, or equivalent.
A. When you do a rain swab test, use a couple of paper towels.
B. Use both sides to wipe over the wet car bonnet.
c. Straighten them out close to the original shape.
d. Then fold it into a shape suitable for the Geiger testing.
e. While you still have your gloves on, squeeze out as much water as you can.
f. Then place it in the zip lock bag. I usually get someone to hold the bag open for me, so I don’t touch the outside of the plastic bag.
h. While outside, take the gloves off, then squeeze out the air in the plastic bag, and seal it.
i. Label, date, and provide general location.
The flat rectangular shape makes it easier to test, and removing as much water as possible improves sensitivity. You don’t know what you have captured in the swab, so remember to keep you hands away from you face, and wash your hands thoroughly afterwards. Also, avoid leaning on the wet car while collecting the swab.
Label the sample with time, date, and location of collection. You, or someone else may be able to do further testing with better equipment in the future
If you are using a Geiger Counter to test the rain swab, take timed measurements in CPM. If Radon washout, it will be approx. half the original counts, after one hour. If it is manly Radon washout it will decay quickly, most of it will have decayed away in about 12 hours.
Having a Geiger counter with a computer charting facility is a great help. Charted here, is Radon daughter washout decay, captured in a rain swab. Most of it had decayed away in 6 hours.
In the Porter Ranch environment until further tests are done, there is no way of knowing if other toxins are also present in the rain. Rain and snow concentrate atmosphere contamination because they collect contaminants as they fall.
In my opinion, if you are getting Radon washout events at high counts or uSv/hr levels, it would be advisable to keep children and pets, out of the rain. In the Porter Ranch area it would probably be wise to wash any locally grown vegetables, herbs and fruit. If you use tank water, I also suggest using a good water filter before use.
@vital1: We have been monitoring the Porter Ranch gas leak and there have been no solid reports we’ve seen that indicate radon is part of the leak in any major way. Where did you get that other than lawyers’ reps floating the notion?
It is not easy to measure for radon in Porter Ranch. It can be done in a number of ways including smart spreading of passive detectors throughout the neighborhood, a tall order with the evacuations and lack of any structure to organize those who would actually obtain such detectors and utilize them in a common manner so the data actually means something. An in-situ portable gamma-scintillation detector runs about $25,000 to $30,000 and requires someone expert to operate it, someone like you vital1 or me.
Until then, speculating on the radon gas content escaping during this methane leak is just that unless there is information out there we are unaware of. This report, as you already know vital1, won’t even check for radionuclides let alone radon.
Significant amounts of radioactive Radon gas is also being released by the Porter Ranch Methane gas leak, not just the toxins mentioned in the USC study below.
Also be aware that when you are exposed to multiple toxins, you can get a toxicity multiplying effect.
A single toxin in the environment can be a hazard, and maybe an organism’s natural biological defense system can deal with this effectively. If an organism has multiple toxins present, radiological and chemical, to deal with at the same time, you get a biological toxicity multiplying effect. The human or animal defense systems become weaker the more toxins it has to deal with.
Biologically, one toxin plus one toxin, does not equate double the toxicity effect. Studies show you can get a multiplying toxicity damaging effect 10 to 20 time greater. The human or animal defense systems become weaker the more toxins it has to deal with. The organism becomes overloaded dealing with too much toxic stress at once.
28th January 2016 – USC researchers to study long-term health effects of Porter Ranch gas leak
Extract:
Methane makes up about 90 percent of natural gas. Methane and other chemicals emitted in natural gas can react in the open-air environment and create other gases and chemicals, such as hydrogen sulfide. Benzene, toluene, ethylbenzene and xylene also have been associated with the emission and are thought to be part of the oily residues in the well and on the walls of the storage facility.
Researchers at USC are interested in investigating these chemical constituents and the long-term effects that might result from breathing in these chemicals.
I just received the day average comparison chart of Cairns and Caloundra, for January 2016
The January day average peaks at Caloundra were less than those recorded for Cairns, see the Cairns and Caloundra Comparison chart below. Cairns is a lot closer to the equator than Caloundra.
Cairns January 2016 Report – “Some spikes at the beginning of January associated with very hot weather. The rest of the month stayed fairly flat, close to my baseline of 0.125 uSV/hr.”
Thanks to the Cairn’s station operator for providing this day average Cairns and Caloundra comparison chart. Cairns is red in this comparison chart, and Caloundra is yellow.
January 2016 Southern Hemisphere Background report (41% above average)
Alert Caloundra 31th January 2016 – The background here has seen a steady increase during January, reaching 64% above average on the 31st January. The 24 hour, 60 second logging chart for the day, showed a significant increase in background levels between 9am to 2.30pm. It was cloudy, but not raining at the time.
24 hour 60 second logging chart for the 31st January 2016
Three minutes and 15 second into this Suspicious Observer video weather report, you will see the surface air flow turn down along the East Coast of Australia from the tropics. Generally we see increased background levels at the monitoring station here, in the warmer months, when we get more air flow from the tropics.
Long term local background information can be found here,
Disclaimer: This is an amateur volunteer run service. Human error can provide incorrect information, and equipment malfunction can produce false readings. Do not rely on, or take action upon information presented here, without further research.
The thought that somebody somewhere could unknowingly consume those fish is a very scary thought. So scary I can’t believe any human being in their right mind would do such a thing. Yet, I know humans do some pretty insanely stupid things, so I wonder. Why else would those fish trolling lights be on… hmm? Did they unload their hefty catch at some far away port and say in came from somewhere else? It would be a crime beyond description.
There are no fish police. At least not at 2:30 in the morning just east of ongoing TRIPLE MELTDOWNS.
“My thought is that if the Southern Hemisphere hovers around +20% for 4 years, then wouldn’t it be safe to assume the percent over pre-Fuku backgrounds in the Northern Hemisphere would be significantly higher?”
Research from the Northern Hemisphere atmosphere bomb testing era, during the 50’s and 60’s, indicates that five to one was the approximate ratio of radioactive contamination that leaked through the equatorial barrier. In other words, about 17% of the atmospheric radiation contamination in the Northern Hemisphere made it into the Southern Hemisphere.
If we assume that the Fukushima Catastrophe has a similar atmospheric dynamic, then a much larger level of Fukushima radioactive contamination has circulated the Northern Hemisphere, compared to what I have detected here in the Southern Hemisphere. The research papers published on the atmospheric Fukushima radioactive contamination releases, support this.
@vital1 Great information, as usual. Thank goodness somebody had pre-Fukushima data for clear comparison.
My thought is that if the Southern Hemisphere hovers around +20% for 4 years, then wouldn’t it be safe to assume the percent over pre-Fuku backgrounds in the Northern Hemisphere would be significantly higher?
Does the Radnet data reflect such a difference? Or is the data so unreliable as to make it useless to really consider. I think I know the answer. 🙁
Southern Hemisphere 2015 Year Background Radiation Report.
Summary
2015 – was 18% above the 4 year pre-Fukushima local average.
2014 – was 20% above the 4 year pre-Fukushima local average.
2013 – was 22% above the 4 year pre-Fukushima local average.
2012 – was 21% above the 4 year pre-Fukushima local average.
In 2015 test results indicated some of the increase in November and December local background levels were possibly from increased Southern Hemisphere volcanic activity. Even taking this into account, the data indicates a gradual decline in local background atmospheric detections from the previous year’s peaks, since Fukushima.
This short animation of Northern, and Southern Hemisphere air circulation, shows why we can get atmospheric detections so far south.
I have also conducted a number of local beach sand, seaweed, and Pacific Ocean plankton tests. If any Fukushima Pacific Ocean Cesium contamination has reached this location, it is at levels below the detection sensitivity of the test equipment used here.
The scintillator test equipment used here is way more sensitive than an average Geiger counter, but it is not as sensitive as the very expensive test equipment available to research or university scientists.
Detailed local background level month and year charts from 2007 to 2015, can be found here.
The December 2015 down pipe rain water filter test shows the usual Lead Pb-210 and Beryllium Be-7. December 2015 rainfall was 54mm. This is less than the rainfall for November 2015 76mm, but there was more Pb-210 detected in December.
Disclaimer: This is an amateur volunteer run service. Human error can provide incorrect information, and equipment malfunction can produce false readings. Do not rely on, or take action upon information presented here, without further research.
Carlsbad is near the Waste Isolation Pilot Plant (WIPP), a large underground nuclear waste repository in New Mexico. WIPP is located approximately 26 miles east of Carlsbad. There were major radiation releases from this facility in February 2014.
29th December 2015 – Carlsbad NM Gamma 5, Do ya think there was a release?
Extract:
RadChick Radiation Research & Mitigation Wow that thanks Julie. Travis Malek she is part od a group where they source rad info daily, i suggest you check them out. The people are awesome there, good info and no drama
Glendale CA radiation station recording a 10 at 6:09 PM on 12/24/15. That is the lowest I’ve ever seen it. Merry Christmas everyone and thanks so much for all that you do!
Thanks to Dr. Sternglass for this research paper below. It clearly demonstrates how environmental radioactive contamination from the nuclear bomb testing era, caused very large declines in Pacific Ocean fish stocks.
The massive amounts of radioactive environmental pollution constantly following into the Pacific Ocean from the Fukushima Nuclear Catastrophe site, would have a similar effect. Fukushima radioactive contamination is lowering the fertility and weakening the immune systems of any sea life coming in contact with it.
Please use Dr. Sternglass’s research paper as a resource to educate people on how radiation contamination from the Fukushima Nuclear Catastrophe, has caused a collapse of the Pacific Ocean food chain.
Quote from Dr. Sternglass’s Research Paper:
“The purpose of the study was to determine whether continued atmospheric testing by France and China or potential releases from underground detonations that might unexpectedly escape into the nearby fishing grounds could have detectable effects on the reproduction of fish populations similar to the unanticipatedly severe effects of low level radiation on the human embryo and fetus (2, 3, 4) recently confirmed by independent studies by other investigators (5, 6).”
08.10.1971 – Fallout and Reproduction of Ocean Fish Populations. E.J. Sternglass, Department of Radiology, School of Medicine, University of Pittsburgh, Pittsburgh, Pennsylvania
Extract:
Nuclear Fallout causes Fish Population Decline,
As will be shown below, very large declines of fish-populations after low-altitude nuclear tests followed by a gradual recovery to pretesting levels have been observed both in the Atlantic and Pacific, strongly suggesting that the eggs of fish and the developing young are far more sensitive to internal radiation from low-level fallout than had been anticipated, very much as in the case of the human-embryo and fetus.
IMO – If the truth is ever told the number of lives sacrificed at Fukushima will someday dwarf Chernobyl.
The number of living things that have been affected and that will be affected by this debacle cannot be estimated. Not to mention those that will never be born because of it.
Maybe the question is now, just how long will it take for TRIPLE NUCLEAR MELTDOWNS, 3 China Syndrome(s), to… do… whatever they’re actually going to do and how long will it take?
I am sure there is somebody somewhere that can or has simulated the oncoming waves of FALLOUT, at current rates, and determined what will happen, in the near and not so near future, to our ecosystems and livelihoods, as we now know it. I sometimes guess at the timeline, I hope, but I realize there’s probably no way of really knowing, so I move forward.
@ Chase, “Many people could have been saved or avoided suffering had the truth been told in a timely manner.”
They decided to protect the nuclear industry rather than the men, women and children. This is unforgivable and criminal, and a crime against humanity.
“It’s been 5 years. I wonder what the real health impacts are?”
There are three nuclear core meltdowns at Fukushima Nuclear Catastrophe site in China syndrome, with an underground river constantly following over them into the Pacific Ocean. The Pacific Ocean is dieing!
The nuclear disaster in Japan is also much larger than the Fukushima site. The Japanese Government admitted in May 2011 that they had 14 Nuclear reactors that had been seriously damaged, not just the 4 at the Fukushima Nuclear disaster site. We have no real information on what has been happening at those other Nuclear Disaster sites, because of the news blackout.
An extract from a Japanese presentation on the subject, that has since been taken down.
“According to Japan’s Nuclear and Industrial Safety Agency (NISA), the earthquake and subsequent tsunami affected fourteen nuclear reactors at four sites along the eastern coast the Fukushima Daiichi site (six reactors), Fukushima Daini site (four reactors), the Ongawa site (three reactors) and the Tokai site (one reactor). The most serious damage occurred at the Fukushima Daiichi Nuclear Power Station.”
Here are fatality and injury reports resulting from this ongoing catastrophe! This is probably just the tip of the iceberg!
USA
Jul 21, 2015 – USS Reagan Sailors Sue for Nuclear Justice
Extract:
Attorney Charles Bonner gives an update on his class action litigation on behalf of military personnel harmed by exposure to Fukushima fallout during an aid mission. The suit targets the plant operator and its manufacturers.
USA
There have already been independent medical reports of 35% spike in infant mortality in the North Western USA, and 48% in Philadelphia.
USA
22nd December 2011 – Peer Reviewed Study Shows 14,000 U.S. Deaths from Fukushima
Extract:
There’s shocking new evidence out that the Fukushima disaster may have led to the deaths of as many as 14,000 people…in America! For more on this – I’m joined by Dr. Janette Sherman – Internist and Toxicologist – and co-author of a new report on the link between an increase in deaths here in America and the ongoing Fukushima nuclear crisis.
8th November 2015 – Chris Busby; Fukushima Thyroid Cancer- The Royal Swedish Academy of Sciences
Extract:
Sweden, like all European States is subject to the EURATOM Basic Safety Standards Directive which contains a clause, an amendment by the European Greens in 1996 at the suggestion of Busby, Alice Stewart, Alexy Yablokov and Rosalie Bertell.
It states that if “New and important Evidence” emerges that the risk model is wrong, all practices involving radiation exposure in the EU must be Justified all over again. Here, Chris Busby attacks the risk model and those who had presented extremely biased science through the day of the symposium.
He draws attention particularly to the recent publication in the journal Epidemiology which reports 120 thyroid cancers in 380,000 children living near Fukushima. This shows an error in the ICRP model of 2600 times.
Comment:
It is very evident from numerous research papers, that the Nuclear industry dose model is seriously flawed. This means all their statements about safety levels are grossly inaccurate.
JAPAN
From the FIOA requests of the NRC transcripts… March 16th 2011 correspondence between the NRC and the Japanese in which they admitted to 5 people having received lethal radiation doses. This was just days after the start of the disaster!
19 March 2015 – Changes in Congenital Anomaly Incidence in West Coast and Pacific States (USA) after Arrival of Fukushima Fallout
Extract:
Consistent patterns of elevated increases are observed in the west (20 of 21 comparisons, 6 of which are statistically significant/borderline significant), by state, type of birth defect, month of birth, and month of conception. While these five anomalies are relatively uncommon (about 7500 cases per year in the U.S.), sometimes making statistical significance difficult to achieve, the consistency of the results lend strength to the analysis, and suggest fetal harm from Fukushima may have occurred in western U.S. states.
“She also said that there were 100,000 shifts shared between the work force that have worked at the Fukushima Daiichi Nuclear Plant so far, also, 4% of 100,000 (4300) workers have reportedly died.”
“Apart from Tepco workers, 64 members of the Self Defence Force and about 300 policemen have also died. They said that those policemen who work at the security check points of the no go zones in Fukushima prefecture are not wearing any protection, therefore, they have been exposed to huge amounts of ionizing radiation.”
Steve Zeltzer, reporting from Japan: One of the things I learned in Osaka from the president of the day laborers is that many of the day laborers being brought into the plant, they’re not being registered and they’re disappearing. There were over 800 day laborers who have disappeared from contact by the union, which means they may have been killed or died during work.
10th March 2015 Japan’s nuclear-related deaths rise by 18%
Extract:
Tokyo – A total of 1 232 deaths in Japan’s Fukushima prefecture over the past year were linked to the nuclear accident four years ago, up 18% from a year earlier, a news report said on Tuesday.
‘One day I was taking a cigarette break with a coworker. When we finished our break, I stood up and called out to my still-seated coworker: ‘Wanna get going soon?’ But he didn’t move. He was dead. The dead body was not returned to his family because of radiation. They poured cement over the body and carted that off to J village area. I have no idea what happened to the corpse after that.’
Declassified FOIA
“100% of the total spent fuel was released to the atmosphere from unit 4.”
“DOE Aerial Measurement Teams have completed two flyovers of the Daiichi site. NRC has received the data and the analyses from the first fly-over.”
– page 6 of the .pdf file
(Around March 18, 2011)
“EXCEPT for ALASKA, all thyroid dose estimates are well below the EPA 5 rem PAG.”
Alaska took a BIG iodine hit. I didn’t know that. Probably Canada too.
Hey people of Alaska, were you informed? 😡
Okay, I’ll say it, “This IS criminal” and “Obama is a bold faced liar”!
“The thyroid estimate is VERY conservative and does not consider intervention actions like distribution of potassium iodide, removing dairy cows from contaminated pastures, or interdicting milk or leafy vegetables contaminated with 1-131.”
It’s been 5 years. I wonder what the real health impacts are? Many people could have been saved or avoided suffering had the truth been told in a timely manner. 😥
10 December 2015 – Declassified U.S. Government Report on Fukushima: “100% of The Total Spent Fuel Was Released to the Atmosphere from Unit 4”
Extracts:
The source term provided to NARAC was: (1) 25% of the total fuel in unit 2 released to the atmosphere, (2) 50% of the total spent fuel from unit 3 was released to the atmosphere, and (3) 100% of the total spent fuel was released to the atmosphere from unit 4.
For example, there was “more cesium in that [Unit 4] fuel pool than in all 800 nuclear bombs exploded above ground.”
Comment:
If 100% of the total spent fuel was released to the atmosphere from unit 4, it means the said removal of the spent fuel rods from unit 4 fuel pool was noting but staged theater for the masses!
Southern Hemisphere Rain Water test Report For November 2015
Considering the rainfall for October (77mm) and November (76mm) were very similar, the amount of Pb-210 detected for November 2015 was significantly greater than October. This suggests there was a lot more Radon-222 in the air here at Caloundra, during November.
At the beginning of November and again on the 14th November, a 40%+ increase in day average backgrounds levels were detected at my location on the East Coast Of Australia, near Brisbane. Tests were conducted to try an establish the source of the elevated background.
There were evening storms on the 14th, during one of these elevated background events, so a car rain swab was collected on the morning of the 15th November. The rain had been sitting on the car overnight. A scintillator test of it was started on the afternoon of the15th. It was tested for ~24 hours.
Radon is formed in the normal radioactive decay of Thorium which produces Radon-220, and Uranium which produces Radon-222. Both of these different Radon isotopes decay slowly into lead.
In the test chart you will see isotope maker peaks for Lead Pb-212 and an X-ray at 77 keV. These are decay daughters of Radon-220. This suggests that Thorium-232 was the source. There are also traces of Lead Pb-210, and Potassium-40. Lead Pb-210 is the decay daughter of Radon-222. This means there was also some Radon-222 in the air at the time.
The test detected trace amounts of Th-232 decay daughters, so the rain swab test chart only shows the tops of the main Th-232 decay daughter and X-ray peaks. A Thorium gas mantle test shows the main Thorium Th-232 decay daughter peaks. I have provided it as a reference. As you can see from the gas mantel test, the equipment here can separate the combined X-ray daughter peak around 89/90 keV, from the main 77 KeV peak.
Sources of atmospheric releases of Thorium-232 could be the recent Indonesian, New Zealand or South American volcanic eruptions, or a mining operation somewhere? There is a lot of volcanic activity in the Southern Hemisphere at present. Because the elevated detections where detected along the entire Eastern Coast of Australia, by numerous private monitoring stations, I am leaning towards volcanic activity, rather than a mining operation.
Cairns November 2015 Report – “After several months of very flat readings, last month had a number of peaks, with the increase starting the last week in October. It appears, the peaks coincide with higher altitude wind coming from the inland and usually very hot days.”
As you can see from the comparison chart below, Cairns had much more dynamic swings in background than Caloundra for November.
Cairns is red in this chart and Caloundra is yellow.
My opinion is that the November 2015 elevated detections are a combination of,
1. The increased background we get every year in the warmer months, as a result of Fukushima equatorial breakthrough.
+
2. An increase from recent Southern Hemisphere volcanic activity.
The local November month average background radiation for November 2014, 2013, and 2012, works out to 0.130 uSv. The volcanic activity, or whatever source created the recent increase, appears to have increased the November 2015 month average local background to 0.137 uSv.
These measurements are recorded by a GammaScout Alert Geiger counter, logging every 60 seconds. The data is downloaded and turned into a day average chart, and eventually a month average chart.
Here are month day average charts for November 2015, 2014, 2013, and 2012, local background radiation levels.
Disclaimer: This is an amateur volunteer run service. Human error can provide incorrect information, and equipment malfunction can produce false readings. Do not rely on, or take action upon information presented here, without further research.
I am pretty sure it’s been said here before over the last four years, but I’ll say it again.
When, at some point, most of the EPA Rad Monitors are turned off or said to no longer function it will be a sad day.
What’s next? Controlling media so much that most people don’t realize that there are TRIPLE ongoing MELTDOWNS in Fukushima… that have been spewing FALLOUT to the atmosphere and sea for 1718 days nonstop.
😐 [sarc]
________________________
➡
Here’s a new site where some regular Web Cam watchers are posting observations. Creating different categories of observation and historical cam related archives.
23rd November 2015 – Ukraine nuclear power plants ‘dangerously’ without power as towers feeding energy to Crimea blown up
Extract:
The apparent act of sabotage in Ukraine’s Kherson region forced an emergency power unloading at several Ukrainian nuclear power plants, which can be extremely dangerous, according to the first deputy director of Ukraine’s energy company Ukrenergo, Yuriy Katich.
Comment:
Independent of the politics, this is a very dangerous situation for the whole of Europe. Nuclear fallout does not recognize national borders, or political beliefs.
“A national radiation-monitoring system enhanced after the Sept. 11, 2001, terrorist attacks isn’t working as intended, with nearly three-quarters of stations not checking for a type of radiation in real time, including ones in New York, Chicago and Los Angeles,” the WSJ piece begins. “Environmental Protection Agency officials confirmed 99 of 135 beta-radiation sensors in its RadNet system … aren’t working and have been turned off. Officials blame electromagnetic interference from sources such as cellphone towers and said efforts to resolve the problem have been unsuccessful.”
It took until 2015 for EPA to pull the plug on a system that didn’t work right since 2001? That begs credulity. But if that is true, it speaks to years of incompetence and indifference through both Democratic and Republican administrations.
“EPA officials said the beta-detection problem cropped up in 2006 when they started putting the real-time monitors into the field,” which, again, sounds dubious. How is it that the beta-detection worked fine from 2001 to 2005 with no apparent problem yet once put “into the field” they failed to work? More malarkey. No explanation for this dubious claim that doesn’t explain how and where this monitors first worked wherever they were stationed. If, however, the problem was shielding against outside interference, why not just increase the shielding?
One apparent problem is that the reporters, bright gents from all accounts we’ve heard, don’t understand how radiation works entirely therefore don’t report the story accurately. Take this sentence: “In instances where only a beta emitter is present, the lack of a working monitor could leave officials unaware of potentially dangerous levels of contamination, they added.” Folks, there are NO places where only a beta emitter is present as gamma radiation is everywhere. It’s what makes up cosmic radiation, radiation from the Sun among other things.
WSJ‘s radiation explanation then expands into more completely false explanations which, naturally, lead to false conclusions. Check the next three sentences out with our critiques in [brackets]: “Gamma- and beta-emitting radionuclides can be carried by the wind long distances from a nuclear event, such as an explosion or power-plant accident [FALSE – gamma radiation is an energy, not a particle, and can’t be “carried by the wind]. Gamma rays from those radionuclides can then travel hundreds of feet or more and penetrate objects [FALSE – gamma travels huge distances, in the millions of miles, not hundreds of feet], including human tissue, according to federal government websites [Really? Which government websites exactly?]. Beta particles generally travel only several feet from their emission source [FALSE – beta particles radiate an inch or two out from the source at most but can be transported around the globe via air, dust and water]. While they can penetrate skin, their main health threat comes if inhaled or ingested in tainted food or water [True].”
While EnviroReporter.com finds it tedious to critique the inaccurate work of other news media, this particular article demands further analysis due to our relationship to this very important subject. And, to be sure, the piece has some excellent information in it when not crippled by unsound science. For example this puzzler: “Officials said they don’t know why some beta monitors still work, including locations in Phoenix, Dallas, Pittsburgh and Washington, D.C.” We know why they still work – they are maintained properly and are switched on.
Now even if the reporters aren’t radiation experts, surely they should have known that the following reported quote clearly doesn’t pass the smell test: ““We can confidently say that this system is fully capable now and fully operational now with the current monitors it has to detect fairly minute levels of radiation,” said Jonathan Edwards, director of the EPA’s radiation protection division.” But the article says that the beta monitors have been turned off – the import of the piece – so how could Edwards’ bold assertion not be called out? Reporting isn’t just serving up quotes; it’s also about analysis such as noting nonsense spun to cover screw ups.
There’s unfortunately more. “EPA officials acknowledged that one major radionuclide—strontium-90, which can get into people’s bones—emits only beta particles. However, they said, an event releasing a large amount of strontium-90 would also release large amounts of gamma-emitting radionuclides that could be picked up.” How in the heck does that work? WSJ says Sr-90 “emits only beta particles” yet, with enough of it, it emits gamma? The fact is it is always emitting gamma in its atomic decay chain.
At this point, it bears noting that the beta, not gamma, signatures of dangerous man-made radionuclides, like strontium-90 and cesium-137, are what tell us if there is something afoot in the air, like a triple meltdown in Japan or a dirty bomb attack in the United States. But even costing only $2 million for EPA “fixed” monitors, which include beta detecting machines, out of an $8.1 billion annual budget, means nothing to the agency according to the article. “Not having the beta monitor is absolutely not a concern of ours,” said John Griggs, director of the EPA’s National Analytical Radiation Environmental Laboratory. Wow.
The rest of the article is accurate, and chillingly so. WSJ faithfully reports a number of convoluted EPA explanations why its radiation detection system is an abysmal failure yet is still world class. The article ends with “The EPA, in a response, said it remains “dedicated to protecting public health and the environment through the use of sound radiation science.””
When there is no data, there is no science, sound or unsound. When the federal agency that is supposed to monitor for dangerous mostly beta radiation in a world that includes terrorist organizations dedicated to America’s destruction like ISIS blows off its responsibilities, people in charge of that agency should be shown the door. They won’t be, though, and RadNet will stay dark and America will remain beta blind.
For two years, EnviroReporter.com was able to show you the barely functioning beta and gamma monitors of EPA’s RadNet so you would know what’s hot and what’s not. We apologize that you – and us – no longer have access to that life-saving information. Now at least you know why.
16th October 2015 – Nuclear waste leaves France for Australia
Extracts:
‘Areva, almost bankrupt, are using a dustbin ship to carry waste, without any serious inspection!’ Denis Baupin a senior lawmaker with the French green party, tweeted shortly before the ship left port.
Yannick Rousselet of Greenpeace France said the ship ‘should not be used’ to carry the nuclear waste, while Nathalie Geismar from Robin des Bois said other ports had found a “staggering number of flaws” in the ship.
21 November 2015 – Indon to ‘block Aust-bound nuclear waste’
Extract:
INDONESIA’S Navy and police reportedly want to close their waters to a ship carrying nuclear waste bound for Australia.
“WE will block the ship because nuclear waste is very dangerous,” sea security coordinating agenda head Vice Admiral Desi Albert Mamahit told The Jakarta Post newspaper.
Comment:
I found most major news outlets in Australia are using this strange truncated head line, Indon to ‘block Aust-bound nuclear waste’. How can these news outlets be considered independent, when they use the same headline!
20th November 2015 – Indonesia to close seas to ship transporting nuclear waste
Extract:
Desi said that MV Trader passed through Indonesian waters three months ago when it sailed from Australia to France. “Our ships are on standby, although the ship is still far from Indonesia. We have information about the ship,” he said.
If MV Trader passed through Indonesian’s sea territory, he said, it had the potential to pollute the country’s waters.
Caloundra Early November 2015 Rain Water Test Report – At the beginning of November and again on the 14th November, elevated backgrounds levels were detected at my location on the East Coast of Australia, near Brisbane. Tests were conducted to try an establish the source of the elevated background.
There were evening storms on the 14th, during one of these elevated background events, so a car rain swab was collected on the morning of the 15th November. The rain had been sitting on the car overnight. A scintillator test of it was started on the afternoon of the15th. It was tested for ~24 hours.
Radon is formed in the normal radioactive decay of Thorium which produces Radon-220, and Uranium which produces Radon-222. Both of these different Radon isotopes decay slowly into lead.
In the test chart you will see isotope maker peaks for Lead Pb-212 and an X-ray at 77 keV. These are decay daughters of Radon-220. This suggests that Thorium-232 was the source. There are also traces of Lead Pb-210, and Potassium-40. Lead Pb-210 is the decay daughter of Radon-222. This means there was also some Radon-222 in the air at the time.
The test detected trace amounts of Th-232 decay daughters, so the rain swab test chart only shows the tops of the main Th-232 decay daughter and X-ray peaks. A Thorium gas mantle test shows the main Thorium Th-232 decay daughter peaks. I have provided it as a reference. As you can see from the gas mantel test, the equipment here can separate the combined X-ray daughter peak around 89/90 keV, from the main 77 KeV peak.
If it was from Fukushima, I would expect to see other Fukushima isotope markers present. Sources of atmospheric releases of Radon-220 could be the recent Indonesian, New Zealand or South American volcanic eruptions, or a mining operation somewhere? There is a lot of volcanic activity in the Southern Hemisphere at present. On the Emergency and Disaster Information Service map, you can see the locations of erupting volcanoes in South America, New Zealand and Indonesia.
Because the elevated detections where detected along the entire Eastern Coast of Australia, by numerous private monitoring stations, I am leaning towards volcanic activity, rather than a mining operation.
—————————————————————–
Southern Hemisphere October 2015 Rain Water Test Report.
As usual, Lead Pb-210 and Beryllium Be-7 were the main isotopes detected in the rainwater filter. Rainfall for October was 77 mm.
Disclaimer: This is an amateur volunteer run service. Human error can provide incorrect information, and equipment malfunction can produce false readings. Do not rely on, or take action upon information presented here, without further research.
There was a general increase in background levels detected by multiple stations in the Southern Hemisphere, in early November. In local rain swab tests, trace amounts of Iodine-129 and Lead-210 where detected, plus Radon-220 and Radon-222 washout decay daughters. The live Radon monitor reached a peak of ~ 1.8 pCi/Lt on the 14th November, during the storm event.
November 2015 Multi Station Detailed Reports:
Alert Caloundra 3rd November 2015 – It was 42% above pre-Fukushima average level on the 3rd November. This is the first alert level since March 2015.
Note: This alert code system here, is not based on any official government alert system. It is one set up by the station operator to indicate significant local increases.
From previous testing, when we reach alert levels here, rain events can cause large radon washouts. We haven’t seen any studies on the heath effects of being exposed to very large Radon washouts. It is suggested, if possible, to stay out of the rain when we have local monitoring station alert levels, and if you do get wet, have a shower when you get home.
Dunedin New Zealand Report 4th November – “What is going on? Levels here from 0.8 to 1.6 pico Curies per litre, and rising …” This is a live Radon monitor detection.
Caloundra 8th November 2015 – Conducting a maintenance check on the GammaScout Geiger counter that is used to collect the day average background here, to confirm that these recent local elevated November detections are not caused by equipment fault, or from dust contamination.
I did find a small white fleck of material on the mica window which I brushed off with a very soft brush. I also cleaned out the whole unit, plus cleaned around the location where GammaScout is located. I also checked all the circuitry for damage, and the possibility that an insect got fried in the high voltage circuit area. An insect short would cause circuit malfunction, and erroneous detections. It all checked out OK. The next data download on the 9th November may confirm if the background elevation was caused by dust contamination, or from the particle found on the mica window.
Caloundra 9th November 2015 – The 24hour chart for the 8th shows a drop in background around 8.30am, after the monitoring Geiger counter was cleaned. Unfortunately there was a significant change in wind direction at the time. Wind started coming from the South, where as before it was manly from the North.
Therefore it is not conclusive at this time, if the Geiger counter cleaning, or the wind change caused the significant drop in background levels, from a day average of 0.148 uSv/hr on the 7th to 0.133 uSv/hr on the 8th.
Cairns 9th November 2015 Report – “My readings in Cairns for yesterday also went up to 0.147 uSv/hr. Will keep an eye on it and will let you know of further development.”
Cairns 10th November 2015 Report – “The reading for Cairns yesterday increased further to 0.166 uSv/hr. The highest reading since Jan this year. I am charging the battery at the beginning of each month, so that should eliminate any problems with that. Will keep you informed about further development.”
Cairns is red in this chart and Caloundra is yellow.
Cairns 11th November 2015 Report – “Yesterdays reading was down to normal again at 0.125uSv/hr.”
Alert Caloundra 14th November 2015 – It was 43% above pre-Fukushima average level on the 14th November. There were a series of thunder storms that passed over the area, followed by heavy rain, that came from the South West in the evening. The local live monitors here showed elevated background levels for most of the day. When the storms passed over, the background level peaked.
Disclaimer: This is an amateur volunteer run service. Human error can provide incorrect information, and equipment malfunction can produce false readings. Do not rely on, or take action upon information presented here, without further research.
vital1 – Thanks and yes I did get your reply. Thanks so much for your consideration. Fukushima and nuclear power in general, is such a scourge on our planet, I fear for all life on earth because of it.
8th November 2015 – Chris Busby; Fukushima Thyroid Cancer- The Royal Swedish Academy of Sciences
Extract:
Sweden, like all European States is subject to the EURATOM Basic Safety Standards Directive which contains a clause, an amendment by the European Greens in 1996 at the suggestion of Busby, Alice Stewart, Alexy Yablokov and Rosalie Bertell.
It states that if “New and important Evidence” emerges that the risk model is wrong, all practices involving radiation exposure in the EU must be Justified all over again. Here, Chris Busby attacks the risk model and those who had presented extremely biased science throught the day of the symposium.
He draws attention particularly to the recent publication in the journal Epidemiology which reports 120 thyroud cancers in 380,000 children living near Fukushima. This shows an error in the ICRP model of 2600 times.
Here are updates on the serious situation at the St Louis West Lake Landfill fire, and Cold Water Creek contamination.
15th October 2015 – Regional West Lake Landfill CommUnity Meeting.
Extract:
Monthly Meeting of Citizens to discuss information about West Lake Landfill (Radioactive Nuclear Waste) and Bridgeton Landfill (Fire). This month the discussion was on the Missouri Attorney General Chris Koster’s document release, review research of forest fires in Chernobyl and how to prepare for an emergency, whether that is a Shelter in Place or Evacuation.
The West Lake land fill is not the only seriously contaminate location in St Louis, Cold Water Creek is another hot area.
28th October 2015 – Residents in St Louis dying in record numbers from World War II radioactive waste
Extract:
Soon enough, one little Facebook page grew from simply getting back in touch, to the alarming realisation that more than 2700 residents reported rare incidents of illness. This was becoming a cancer cluster of epic proportions: 45 cases of appendix cancer, 184 cases of brain cancer, 315 cases of thyroid cancer, 448 cases of auto-immune disease, and so on.
“The rates of appendix cancer, for instance, which is relatively rare — we see about 800 cases across the nation per year. To find seven or eight cases in one zip code or one small geographic area is rather unusual.”
28th October 2015 – 4.5 microSv/h, Koriyama city Incineration plant road side mud
Extract:
Cesium have a low boiling point. Aprox.700 degrees Celsius, 1300 degree Fahrenheit. Garbage incineration easily make Cesium gasification.
Comment:
Japanese Madness, incinerating contaminated waste just spreads the contamination into local communities.
These are very high detections, passing cars, wind and rain will spread this contamination far and wide!
25th October 2015 – Radioactive Dump That Burned in Nevada Had Past Troubles
Extract:
A soundless 40-second video turned over by US Ecology to state officials showed bursts of white smoke and dirt flying from several explosions on Oct. 18 from the dump in the brown desert about 110 miles northwest of Las Vegas.
Comment:
Poster pinksailmatt, in the radiation detection forum, on enenews.com, posted this detection he found on RadNet Las Vegas Nevada. The spike occurred just after the explosion at the radioactive dump site.
Here are the RadNet Las Vegas Nevada readings for the past few days.
Notice the spike on the day of those radiation dump explosions.
These CPM’s were ALL energy levels combined for Gamma.
21 October 2015 – The threat of low-level radiation
Extracts:
NORTH ST. LOUIS COUNTY, Mo. — A study released Wednesday by the World Health Organization said long-term exposure to radiation — even low levels — can dramatically increase the risk of dying from cancer.
Using social media, the neighbors said they’ve documented more than 2,700 cases of cancer, auto-immune diseases and tumors in their area.
Comment:
The St. Louis County and Santa Susana Field Lab sites are clear examples of how radioactive waste in the environment can cause death and illness in large numbers of people living in nearby communities!
The sins of the past affect present, and future generations.
8th October 2015 – Underground fire 300 meters from nuclear waste causes St. Louis to hatch contingency plan
Extracts:
ST. LOUIS – Beneath the surface of a St. Louis-area landfill lurk two things that should never meet: a slow-burning fire and a cache of Cold War-era nuclear waste, separated by just 300 meters.
Although the fire at Bridgeton Landfill has been burning since at least 2010, the plan for a worst-case scenario was developed only a year ago and never publicized until this week, when St. Louis radio station KMOX first obtained a copy.
Southern Hemisphere September 2015 Rain Water Test Report.
The test equipment has had an upgrade.
For testing until now, a Gamma Spectacular GS-1100A sound card spectrometry driver was plugged into the mic input of a laptop. This laptop mic input could only sample the test signal up to 96K 16 bit. A external Xonar USB sound card is now being used instead of the standard laptop microphone input.
This means the test signal can now be sampled at 192k 24 Bit. This has resulted in a significant improvement in sensitivity, particularly at low keV energies.
A paper towel rain filter design was used again this month, rather than the polyester filter used previously. This paper towel filter was sun dried for a longer period than last months filter, so it had less moisture content when tested.
Unfortunately, we can’t read the entire article because it requires payment, but it’s interesting that the mean stream media is reporting on this, isn’t it?
15th October 2015 – Environment Pollution in Finland on Thursday, 15 October, 2015 at 10:32 (10:32 AM) UTC.
Extract:
Radiation and Nuclear Safety Authority of Finland (STUK) has detected a small amount of radioactive substances in the air in the Finnish capital of Helsinki, reported Finnish daily Helsingin Sanomat has reported. The abnormal amount of radioactive substances, including manganese (Mn-54), cobalt (Co-60), and cesium (Cs-134 and Cs-137), were found in early October in samples collected from the city by a STUK’s monitoring station located in northern part of Helsinki.
Comment:
The detection of Cs-134 means that the nuclear event that created this was recent!
3rd October 2015 – Pt. 2 – Fukushima Contamination – Dr. Tim Mousseau
Extract:
“Bio-Impacts of Chernobyl & Fukushima”
Evolutionary biologist Dr. Tim Mousseau shares findings from his unique research on the biological effects of radiation exposure to wildlife from the nuclear disasters at Chernobyl & Fukushima.
Comment:
The extensive independent research information provided in this video presentation by Dr. Tim Mousseau, destroys the myth promoted by the nuclear industry that radioactive contamination has little effect on local wildlife.
The nuclear industry has promoted the idea to the public that the Chernobyl exclusion zone has become a lovely nature reserve, where animals run free and wild. This is clearly a made up fantasy, in an attempt to hide the long term consequence of nuclear contamination on the environment.
Southern Hemisphere Background Radiation Report For September 2015
September 2015 Summary
September 2015 monthly average background radiation level was 5% above the pre-Fukushima average. This is considerably lower than the September 2012 and 2013 average.
September average for 2014 was 5% above the pre-Fukushima average.
September average for 2013 was 15% above the pre-Fukushima average.
September average for 2012 was 13% above the pre-Fukushima average.
Cairns Report:
Cairns is on the east coast of Australia, and it is much closer to the equator than Caloundra, see location map.
Here is the Caloundra and Cairns September day average background comparison chart.
Thanks again to the Cairns station operator for this report, and chart.
“The readings stayed close to my baseline of 0.125 uSV/hr for the whole month. Glad, nothing of significance to report. Yours also look pretty parallel to mine.”
The Caloundra year average charts show a consistent seasonal variation in background levels since Fukushima. Most of the equatorial barrier air flow break through between the Northern and Southern hemispheres, happen in the warmer months. On this page you will find all the month and year average charts for local background radiation levels, from November 2007 to 2015 for Caloundra.
Disclaimer: This is an amateur volunteer run service. Human error can provide incorrect information, and equipment malfunction can produce false readings. Do not rely on, or take action upon information presented here, without further research.
Observation from the Fukushima Webcam:
Spark phenomenon – The number of colored flying sparks/bolts seen has increased since the beginning of this year.
They used to be very rare and happen only after earthquakes or extreme weather. Now it seems like they can sometimes be counted as to ‘how many’ per hour. That’s amazing! I am sure it means something. I just don’t know what. (?)
(can be viewed on youtube videos)
Who knows what may happen when containment(s) blow sky high, cores go rogue and toxic goo of all kinds mix and accumulate for years.
Maybe by 2020 the entire facility will look like a 4th of July fireworks display. 😉
The sample was gathered from raindrops collected on leaves at 11:30 AM. The background reading was from the dry container and paper towel used to gather the rain drops. Looks like the rain added nothing to the count, so this rain from tropical moisture is uncontaminated.
@Chase et al: That wall looks missing around an opening and there seem emissions coming from the hole in the roof but we can’t quite make it out. We can’t see any spraying down the hole, though.
Is Unit One’s spent fuel pool steaming off its water and overheating? Sure looks like it. If so, a big uncontrollable series of events could ensue that will lead to a SFP fire that would become The Unforgettable Fire.
Please keep an eye on this, Chase, and thank you for telling fellow raddies about it.
Observing smoke/steam emissions coming from the hole in the roof of Reactor 1 since 8 am Sept 10th jst. There is also a large panel on the west wall that looks charred. (?) This is something new.
A crane appears to be spraying something down the hole. ?
Southern Hemisphere August 2015 Rain Water Test Report
I used part of a paper towel roll for the rain water filter this month, instead of the usual polyester wool filter. The theory is that it may capture more soluble material than the polyester wool. A test result similar to the polyester filter was observed, only very small traces of Lead-210 and Beryllium-7 were captured. The exception being that the cellulose and water content of the paper appeared to be filtering out very low energy X-rays.
A bit more rain fell this month compared to last month, 159mm for August.
This clean paper towel filter was tested in the lead shielded test chamber for 24 hours, and that test result was then used for background subtraction from the used filter test result.
Disclaimer: This is an amateur volunteer run service. Human error can provide incorrect information, and equipment malfunction can produce false readings. Do not rely on, or take action upon information presented here, without further research.
Just 19 kilometers from three actively spewing melted nuclear reactor cores. That’s 11.8 miles or less than the distance from Radiation Station Santa Monica to downtown Los Angeles and slightly more than the distance between ‘DTLA’ and Radiation Station Glendale California.
All cleaned up, yes? If one were to judge from the numbers of Japanese returning to Naraha Japan, just 100 families of 2,600 households since a trial period of voluntary return begun in April 2015, the answer would be ‘no.’ But the Japanese government isn’t daunted especially since it has to show how normal things are, despite no salvaging of the lost cores deep underground irradiating the groundwater and Pacific Ocean with massive amounts of extremely dangerous radionuclides.
“Our clock started moving again,” Naraha Mayor Yukiei Matsumoto said at a Saturday ceremony held at a children’s park. “The lifting of the evacuation order is one key step, but this is just a start.” The mayor said that “fear” still remained as if that were the main problem. Wow, what incredible hubris and determined stupidity.
That fatal foolishness is not confined to Japan, as Dale pointed out in his comment. In late August 2015, the US Environmental Protection Agency cut off the beta graph feeds to the public that EnviroReporter.com had organized into a coherent monitoring system with our RadNet Air Monitoring. While EPA was kind enough to size their RadNet portal such that it fits our monitoring pages, unless you are expert at navigating the agency’s Byzantine and outdated system, you are beta out of luck. And so is the entire country (and its neighbors).
But wait! It’s all okay, right? After all, Japan is hosting the 2020 Olympics so it has to be all clear and back to business as usual. That business as usual is going to cost plenty.
Thank you Dale, our very own Dr Solar, for maintaining your excellent Radiation Station. We need it, and the other EnviroReporter.com Radiation Stations now more than ever.
RIP, Enviroreporter’s sweet links to RadNet’s Gross Beta Count graphs from selected RadNet locations. It used to be so easy, but now it is quite a chore. It’s still possible to pull the data, but it takes a long time using RadNet’s query function. Exasperating.
On another note, take a look at RadNet’s misleading graphical depiction of individual sampling sites spread across the nation.
All green dots, giving the impression that all sites are fully functioning, and every site is “clear”. We know from many previous reports on the Enviroreporter website, that RadNet is not fully functional. Radnet sites are frequently down or only partially functioning. Yet, the national status map on the RadNet site is all green (I haven’t actually clicked on every dot, but I doubt that all 134 sites are fully functioning). This probably means nothing more than its a marker for the site, and a link to the gamma chart for that site, if available.
That status map would look very different if down sites were grayed out, or colored differently to indicate non-reporting or partial reporting. RadNet’s depiction of the National Status map could be greatly improved.
➡ Low Flying Helicopter Over Pacifica (Bay area) This Week Sept 1, 2015
“The advisory comes from the National Nuclear Security Administration. The helicopter is equipped with gamma radiation sensors.”
” The survey is part of a study by the Department of Homeland Security Domestic NUCLEAR DETECTION OFFICE intended to help improve the ability to detect and measure radiation from the air, the agency said in a statement. The agency conducted a similar survey over the same areas in 2012, according to Berkeley city officials. ”
Southern Hemisphere Background Radiation Report For August 2015
August 2015 Summary
More good news here at Caloundra, there haven’t been any significant upticks or events to report for months now, plus the background levels have stabilized. The background levels are not at pre-Fukushima levels, but close.
August 2015 monthly average background radiation level was 5% above the pre-Fukushima average.
August average for 2014 was 4% above the pre-Fukushima average.
August average for 2013 was 8% above the pre-Fukushima average.
August average for 2012 was 9% above the pre-Fukushima average.
Caloundra and Cairns August day average background comparison chart – Thanks again to the Cairns station operator for this chart and report. Cairns is on the east coast of Australia, and it is much closer to the equator than Caloundra, see location map.
Disclaimer: This is an amateur volunteer run service. Human error can provide incorrect information, and equipment malfunction can produce false readings. Do not rely on, or take action upon information presented here, without further research.
There is no indication of any Sendai meltdown according to the Safecast Tile Map today. In comments to his video rant, the poster Kevin Blanch writes “these rats;;;want a fight they have one with me I was a boxer a never defeated in 4 year wrestler, I know the over aggressive fools, the Nuclear crime rats , want to over leverage there lies, I counter punch at the exact right time in there fucking guts,, let them prf me wrong with there cover up lies,, they can’t, it works both ways you want to cover the truth, it will burn you and I am the one that lit the flame that knocked the nuclear liars the fuck out. Kevin”
That this rant has repeatedly found footing is astonishing. We reluctantly approved these comments with links to the videos for their entertainment value only.
ALERT!…..ALERT!….ALERT!!!!!!!!!!!
RADIATION STATION HARRISBURG NC
POSSIBLE PARTIAL MELTDOWN @ SENDAI..Japan…..Kevin Blanch
I took an outside AIR reading this morning @ 9:35 am……70.4 cpm……unusually high average reading which averages 38 cpm
Inside reading was 32.0 @ 9:47 am……Somethings up!!!
In March 2013, I was sent a resin encapsulated sample of black fungus like material, for testing. It reportedly came from somewhere in the Minamisoma area of Japan. This fungus like material started growing on the concrete and rock surfaces in Japan, after the Fukushima Nuclear Catastrophe. It appeared to be bio-accumulating Cesium.
For those of you who have not looked at a chart like this before, the position of the peaks in the chart indicate which isotopes are present. I placed a pen tip next to a photo of the sample, to give people a clear idea of just how small the sample was. The black sample material only filled up around two thirds of this small sample container.,
This black fungus material sample from Japan, contaminated with Cesium Cs-137 & Cs-134, was encapsulated in resin for safety reasons, so we don’t know how much it weighed. Visually, looking at the encased sample, it appeared to be a few grams, if that. A professional lab reported test results were 117 Bg of Cs-137 and 58 Bq of Cs-134.
I posted the test results on the Internet for discussion, and a weight expert posted this comment in 2013.
“I’m an expert on weighing objects (sell scales, use different ones daily, some precise to .01g). Fungus in that form does not appear to hold too much water weight and would likely weigh less than a gram given the scale. If it jis thin and flakey type fungus, it may be under .25-.5g. Is it thick like a mushroom cap or more like lichen? I’ve only observed extremely thin fungi growing on concrete, and I would err on the very low side. My best guess is 0.3g.”
My reply:
“That means the black fungus sample from Japan is very, very, hot.
Test results 117 Bg Cs-137 and 58 Bq Cs-134
117 + 58 = 175 Bq x (1000 grams/0.3 grams) = 583,333 Bq/Kg of Cesium
Even if it was 10 times greater in weight 3 grams, it would still be 58,333 Bq/Kg of Cesium.”
If the weight expert estimate of 0.3g is correct, then this was highly contaminated material!
You wouldn’t want your family living in an area with this amount of radioactive contamination! Any so called expert or government official, telling people it is safe for their families to live in highly contaminated areas like this, are criminally negligent in my opinion.
AIKEN COUNTY, S.C> (WRDW) — SRS confirms the lockdown has been lifted. SRS was on lockdown after a possible threat caused emergency response to the site. According to a release from SRS, an offsite law enforcement investigation found no explosive residue or device on inspected truck.
The Pacific Ocean is dying! The huge amount of radioactive contamination, conservatively equal to 10,000 Hiroshima nuclear bombs, has been released from the Fukushima Nuclear Catastrophe site. The Fukushima nuclear catastrophe site is still releasing huge amounts atmospheric radioactive contamination, plus thousands of tons of highly radioactive contaminated water is still flowing into the Pacific Ocean every day!
There are an increasing number of media reports coming in, of Pacific Ocean fish, whales, birds and other sea creatures dieing in large numbers. The Fukushima radioactive contamination would be lowering the fertility and weakening the immune systems of any sea life coming in contact with it. As immune systems become weakened, it would be logical to expect viruses and bacteria that would normally be under check, to become more infectious. This radioactive contamination could also potentially stimulate viruses and bacteria to mutate into more infectious strains.
This massive amount of radioactive environment pollution has resulted in the Pacific Ocean food supply crashing! Hence the large number of reports of seals, whales and birds etc., washing up on the west coast of North America, starving to death.
Thanks to Dr.Sternglass, who passed away in early February, for this research paper below. It clearly demonstrates how Nuclear contamination from the nuclear bomb testing era caused a significant crash in Pacific Ocean fish stocks. If this was the case then, it would be logical to assume that the Fukushima Nuclear Catastrophe is having a similar effect.
Quote:
“The purpose of the study was to determine whether continued atmospheric testing by France and China or potential releases from underground detonations that might unexpectedly escape into the nearby fishing grounds could have detectable effects on the reproduction of fish populations similar to the unanticipatedly severe effects of low level radiation on the human embryo and fetus (2, 3, 4) recently confirmed by independent studies by other investigators (5, 6).”
08.10.1971 – Fallout and Reproduction of Ocean Fish Populations. E.J. Sternglass, Department of Radiology, School of Medicine, University of Pittsburgh, Pittsburgh, Pennsylvania
Extract:
Nuclear Fallout causes Fish Population Decline
As will be shown below, very large declines of fish-populations after low-altitude nuclear tests followed by a gradual recovery to pretesting levels have been observed both in the Atlantic and Pacific, strongly suggesting that the eggs of fish and the developing young are far more sensitive to internal radiation from low-level fallout than had been anticipated, very much as in the case of the human-embryo and fetus.
32.5 mm rain fell in July, and the chart shows very small traces of the usual Pb-210 and Be-7. In this chart I have CPS on the Y axis to show activity, and have turned off Y log to show linear scaling. This is only a test chart of the polyester part of the rain water filter system design.
Disclaimer: This is an amateur volunteer run service. Human error can provide incorrect information, and equipment malfunction can produce false readings. Do not rely on, or take action upon information presented here, without further research.
RADIATION STATION HARRISBURG NC….8/6/2015
Quick 10 min. shower from W to E this afternoon.We are in a drought here…
1…277.1 cpm @ 2:35 pm
2…33.1 cpm @ 2:45 pm background
……8.37 x background
Will upload to YouTube shortly
Has anyone informed you and your readers that the Nuclear Regulatory Commission (NRC) is considering replacing the present “Linear No Threshold” radiation-dose model (which basically says there is NO safe dose of radiation) to something called HORMESIS, which is the idea that low-level radiation is “good for you.”
It gets worse.
There are 4 more recommendations they are considering.
” (1) Worker doses should remain at present levels, with allowance of up to 100 mSv (10 rem) effective dose per year if the doses are chronic.
(2) ALARA [As Low As Reasonably Achievable] should be removed entirely from the regulations. The petitioner argues that “it makes no sense to decrease radiation doses that are not only harmless but may be hormetic.”
(3) Public doses should be raised to worker doses. The petitioner notes that “these low doses may be hormetic. The petitioner goes on to ask, “why deprive the public of the benefits of low dose radiation?”
(4) End differential doses to pregnant women, embryos and fetuses, and children under 18 years of age. ”
What this means is that YOU can be exposed to as much radiation as a nuclear worker! And children and pregnant women will no longer have lower-dose protections. And that industry, etc. would no longer have to attempt to keep exposures to the public “As Low As Reasonably Achievable.”
The NRC is requesting that the public comment on this.
Everyone, PLEASE submit a comment telling your opinion/analysis of this.
If you prefer, here is where you can submit your comment anonymously:
LOWEST NUMBER OF RADNET BETA STATIONS WORKING SINCE WE BEGAN LISTING STATIONS:
FUNCTIONING BETA STATIONS
There are 124 EPA RadNet stations across America monitoring gross beta and gamma radiation. The following numbers are how many of the beta stations are online at these 124 locations.
August 4, 2015 – 30 July 6, 2015 – 36
June 1, 2015 – 37 May 23, 2015 – 35
May 8, 2015 – 34 April 7, 2015 – 34
March 29, 2015 – 34 March 18, 2015 – 35
March 11, 2015 – 33 February 1, 2015 – 35
January 31, 2015 – 35 January 30, 2015 – 34
January 14, 2015 – 37 December 27, 2014 – 37
December 17, 2014 – 36 December 10, 2014 – 37
December 2, 2014 – 31 November 23, 2014 – 39
October 1, 2014 – 40 September 1, 2014 – 40
August 6, 2014 – 44 July 28, 2014 – 43
July 21, 2014 – 42 July 14, 2014 – 44
July 7, 2014 – 39 June 30, 2014 – 42
June 19, 2014 – 40 June 2, 2014 – 44
May 5, 2014 – 42 April 13, 2014: 46
January 19, 2014 – 42 July 9, 2013 – 60
I found this yahoo news item about a major 20 ton piece of equipment being being removed successfully from a fuel pool at Fukushima’s wrecked Dai-ichi power plant reactor number 3. I’m glad to see there is progress, but 40 years to clean up and decommission? That is a very long time, and I don’t know if it will be long enough.
July average for 2014 was 5% above the pre-Fukushima average.
July average for 2013 was 5% above the pre-Fukushima average.
July average for 2012 was 9% above the pre-Fukushima average.
Caloundra and Cairns July day average background comparison chart – Cairns is on the east coast of Australia, and it is much closer to the equator than Caloundra, see location map.
Disclaimer: This is an amateur volunteer run service. Human error can provide incorrect information, and equipment malfunction can produce false readings. Do not rely on, or take action upon information presented here, without further research.
I am hopeful that no more old technology, high energy, fission style nuclear plants will be built. The costs are high, the risks are high, and the consequences of accidents are grave. With so much arguing against it, the only businesses willing to pursue it are those who stand to profit when governments are willing to take on the costs, risks, and consequences. Who would be foolish enough to enter into such a Faustian bargain? Of course, when governments partner with business under such terms, they gamble that the apathy and ignorance of the governed will allow the assumption of costs and risks which are too great for too long a period of time.
I think that the more likely outcome will be increasingly attractive alternate forms of energy generation. Naturally, we have great hopes for low density energy sources such as wind, solar, geothermal, tidal, and wave. All of that will help of course, but I don’t rule out that safer forms of nuclear power will eventually be developed. High and low energy fusion power plants will someday become feasible, and that’s when I think the equation will rebalance toward safer more sustainable nuclear energy sources. I’m hoping that unsafe fission plants will be replaced with safer fusion energy generation technologies. This will enable a more politically palatable conversion effort toward lower costs, lower risks, and both lower quantities of nuclear waste and less harmful forms of nuclear waste. Personally, I don’t think we are that far from such improved nuclear technologies. Let’s just hope it will be in time to avoid the next “Black Swan Event”.
@Chase: It is folly of astronomical scale that can and probably will kill the planet. The clock just keeps on ticking as Lights Out shows. There is no escaping it. Most of our species, the poorest of them, don’t even know what’s at stake – their and their children’s future. But they will suffer all the more. Denial of this Earthnocide by Man won’t change anything, won’t stave the crumbling of Nuclear Rome. The crimes against unborn humanity continue to mount. But as long as there is at least one voice of reason, like yours Chase, there is hope. The question becomes what to hope for and how to make it manifest in the most effective of forms.
😡
Every time I hear the words ‘Nuclear Deal’ repeated it makes me grit my teeth in anger. There is no deal except for those who stand to profit.
Have Chernobyl and Fukushima’s TRIPLE MELTDOWNS been forgotten?
The only ‘Nuclear Deal’ that makes sense to me is the one where worldwide all Nuclear Power Plants are dismantled and banned from the planet. Now that would be a REAL DEAL. Anything less is an incalculable risk and a moral injustice against every living thing. Seems to me that should be clear to even the most simplest of minds.
We have free power all around us in the form of wind, waves and the sun to name a few. Harnessing these energies has always been right in front of us, yet we are sold/told that using Nuclear Power to boil water is somehow a good thing.
Nuclear Power in the USA
(Updated June 2015)
“Following a 30-year period in which few new reactors were built, it is expected that six new units may come on line by 2020, four of those resulting from 16 license applications made since mid-2007 to build 24 new nuclear reactors.” http://www.world-nuclear.org/info/Country-Profiles/Countries-T-Z/USA–Nuclear-Power/
Nuclear Power in the USA
(wikipedia)
“In August 2012, the US Court of Appeals for the District of Columbia found that the NRC’s rules for the temporary storage and permanent disposal of nuclear waste stood in violation of the National Environmental Policy Act, rendering the NRC legally unable to grant final licenses for any further new nuclear power plants.[174] This ruling was based on the fact that the Yucca Mountain waste repository had never received a license due to its license application being withdrawn by the DOE nor had any viable alternative waste repository been proposed. So long as this ruling stands and this impasse on waste disposal exists, no additional nuclear plants can ever be licensed for operation in the United States.”
So why are we still building/subsidizing new ones?
Nuclear Matters (how cute)
“As of 2014, the U.S. nuclear industry has begun a new lobbying effort, hiring three former senators — Evan Bayh, a Democrat; Judd Gregg, a Republican; and Spencer Abraham, a Republican — as well as William M. Daley, a former staffer to President Obama. The initiative is called Nuclear Matters, and it has begun a newspaper advertising campaign.” https://en.wikipedia.org/wiki/Nuclear_power_in_the_United_States#Debate_about_nuclear_power_in_the_U.S.
@vital1: WOW! That is astonishing. That the Japanese government would allow this speaks volumes as it is their own people who are the glowing guinea pigs. It bears repeating that the California Highway Patrol, as documented on this website, considers anything 3 times background to be a Hazardous Materials situation which necessitates the appropriate protocols to protect life and property. This radiation reading, in a park in a country that will host the 2020 Olympics, is over 83 times the CHP’s Haz-Mat limits! Maybe the Shot Put competition could be held in this park. Call it the Hot Put.
@ Michael, “Most folks don’t know if this is a high level and its implications but a comparison to typical background would be illustrative.”
Thanks for pointing that out. Here in Australia where I am located, it would be 201 times our pre-Fukushima background, or 251 times greater than the Japan pre-Fukushima average background.
Needless to say, you wouldn’t want your children playing in a park with radioactive contamination detections that enormously high!
@vital1: What would be the normal reading range? Most folks don’t know if this is a high level and its implications but a comparison to typical background would be illustrative.
26th July 2015 – 20 μSv/h still detected in Fukushima city
Extracts:
On 4/23/2015, a citizen’s group detected 20.1 μSv/h in Fukushima city. It was in the river area of Abukuma-gawa river, where is open for everyone as a park.
It was over scale of the dosimeter tested by Ministry of the Environment so the radiation level was confirmed by scintillation survey meter TCS-172B.
No stations near by on it, or any other networks, seem to be showing any elevated detections. Therefore it maybe just equipment malfunction, but as usual it maybe worth keeping an eye on it.
List of International live radiation monitoring stations.
M2.7 Explosion – 4km WNW of Junction City, Oregon report on USGS.
Time
2015-07-24 20:36:02 (UTC)
2015-07-25 06:36:02 (UTC+10:00) in your timezone
Times in other timezones
Nearby Cities
4km (2mi) WNW of Junction City, Oregon
24km (15mi) NW of Eugene, Oregon
28km (17mi) NW of Springfield, Oregon
36km (22mi) S of Corvallis, Oregon
80km (50mi) SSW of Salem, Oregon
Are the high radiation detection at Eugene Oregon and the USGS detected explosion 4km (2mi) WNW of Junction City Oregon related, I have no idea???
Date: Wednesday, August 5th Time: 4PM sharp- A moment of silence will be observed at 4:15pm, so please arrive early Location: Chain Reaction peace sculpture, 1800 block of Main Street at the Santa Monica Civic Center
Please join us on August 5th to remember Hiroshima and Nagasaki and grow the movement for a nuclear weapons free world.
On August 6th, 1945 (August 5 in North America), the United States dropped the first atomic bomb over Hiroshima, Japan, killing 130,000 people. Three days later, a second bomb exploded over Nagasaki, killing 70,000. Other countries developed their own nuclear weapons, and humanity became hostage to the ever-present threat of nuclear annihilation. Today, there are more than 15,000 nucelar weapons in the global nuclear arsenal, most of which are far more powerful than the bombs that devastated Hiroshima and Nagasaki. Whether by accident or intent, we remain at risk – and all that we hold dear hangs in the balance. Read more on our website.
There was also a lot less Lead Pb-210 than Beryllium Be-7 in June’s rainwater filter test. In summer we tend to see much more Pb-210 detected in the rain water tests here, when the air masses tend to come from a northerly direction.
There was also a possible trace detection of Cesium-137. It was a very small detection, less than one Cesium-137 gamma ray detection every ~100 seconds. There was no corresponding Cesium-137 32 X-ray detection to help confirm that it was Cesium-137. At these low detection levels, the amount of low energy 32 keV Cesium-137 X-ray present, may be too small to be detected, so there is a degree of uncertainty to it being a definitive Cesium-137 detection.
Rainfall for June was 78.2 mm.
Less Pb-210 in the filter means less Radon-222 was in the air. This was also reflected in the local live Radon monitor.
Disclaimer: This is an amateur volunteer run service. Human error can provide incorrect information, and equipment malfunction can produce false readings. Do not rely on, or take action upon information presented here, without further research.
Watched an ABC TV show called ‘The Whispers’ on Hulu.com. (free) Episode 4 – Meltdown
😐 The disinformation was obvious. Disturbing in a way.
The story line involves an NRC worker and an FBI agent. In short, in this episode, they are trying to stop a meltdown at a Nuclear Plant somewhere near DC.
After stating such things like… “we would have to evacuate a 6 mile zone”, (I almost laughed), and a couple of other played down numbers they then needed to flood the reactor with salt water and the one agent said “Oh, you mean like Fukushima.”
I was surprised they mentioned Fukushima at all, but then I thought about how, what they said and the way they said it, ‘implied’ that Fukushima didn’t meltdown because they saved it using this method.
🙄
Millions watch that show. They may now think they know something that’s been falsely planted in their brain without even realizing it.
External gamma environmental levels in East Los Angeles at 9 microrems per hour at 9:00am on 7/10/15.
Instrument: Wm B. Johnson and Associates GSM-501
Cal: 6/15
The activists at Green Action Japan are urging folks to sign a Change.Org petition demanding that the Japanese government and Tokyo Electric Power Company stop gushing radioactive goo from the wrecked triple reactors at the Fukushima Daiichi nuclear power plant into the Pacific. While this petition is likely to have no effect on the situation, it is still important that EnviroReporter.com readers sign it as we did.
Not convinced it’s important because mainstream and so-called alternative media don’t cover this travesty? Then check out our Fukushima – The Perfect Crime? for an introduction into our comprehensive Fukushima investigation.
There are 694 signatures right now.
[As of July 14 at 8:21 am PDST, there are 1,855 signatures!]
June 2015 saw a decrease in month average background levels compared to the last couple of years. June saw more Southern Ocean air reach this location, hence the lower background level. A number of significant solar radiation storms occurred in June. No significant increases in local background radiation levels were detected during these solar storm events.
June 2015 monthly average background radiation level was 3% above the pre-Fukushima average.
June average for 2014 was 7% above the pre-Fukushima average.
June average for 2013 was 7% above the pre-Fukushima average.
June average for 2012 was 3% above the pre-Fukushima average.
Caloundra and Cairns June day average background comparison chart
Cairns is on the east coast of Australia, and it is much closer to the equator than Caloundra. It is much more likely to get Northern air flows during the cooler months than Caloundra, see location map.
Comment by Cairns station operator:
“The readings stayed fairly close to my longer term baseline of 0.125 uSv/hr. The solar events affecting earth around the 20th of June, did not have any noticeable influence on the readings.”
In this chart, Cairns is red and Caloundra yellow.
On this page you will find all the month and year average charts, for local background radiation levels from November 2007 to 2015. The most recent data suggests the amount of airborne contamination reaching this location has decreased significantly.
Disclaimer: This is an amateur volunteer run service. Human error can provide incorrect information, and equipment malfunction can produce false readings. Do not rely on, or take action upon information presented here, without further research.
2nd July 2015 – Radiation spikes after wildfire in Chernobyl exclusion zone
Extracts:
Ukrainian nuclear inspectors have measured a significant increase in radiation in the Chernobyl exclusion zone caused by heavy wildfires raging in close proximity to the crippled nuclear power station.
Air near the desolated settlement of Polesskoye in the Chernobyl zone is contaminated with the radioactive element cesium-137. Its content in the air has reached a level called “sequence above the norm” (approximately ten times the norm), the State Nuclear Regulatory Inspectorate of Ukraine (SNRI) reported on Wednesday.
7/2/2015 @ 11:54am
External gamma ambient level in East Los Angeles is constant between 8-9 Microrems per hour. This is normal ambient levels for this area.
Instrumentation: Wm B. Johnson and Associates GSM-501
29.06.2015 – High Alert: Ukraine Asks OSCE to Check Radiation Levels Over Donetsk
Extract:
It was earlier reported that an explosion that occurred at a Donetsk chemical factory on June 16 could have led to damages at the radiation storage site as it triggered the detonation of underground ammunition depots.
HIGHEST RADIATION READINGS SINCE FUKUSHIMA MELTDOWNS BEGAN MARCH 11, 2011
Rain test off my car with INSPECTOR+. Been some time since last test. Thunder/lightning storm moving SW to NE approx. 20 min. A NEW record CPM count since 7/4/2011!
1…12.34 X 1,000 = 12,340 CPM….6:08 pm
2…881.3 CPM reverse side napkin….6:21 pm
3…29.5 CPM inside background….6:32 pm
[Above was 418.3 times background]
Compare that to July 4, 2011 when 2 thunderstorm readings taken ……..
1…12.27 X 1,000 = 12,270 CPM 1st shower
2…37.75 CPM inside background
[Above was 325.03 times background]
3…10.47 X 1,000 = 10,470 CPM
4…32.21 CPM inside background
8:00 pm SAME RAIN SAMPLE IN PLASTIC BAG: 63.3 CPM^^ or 5.7 CPM alpha radiation. Alpha makes up 21.9% of overage. Sample #3 – 7:45 pm RAIN: 69.0 CPM^^ or 60.5% HIGHER THAN BACKGROUND
7:30 pm INT RSSMC: 43.0 CPM^^
4:55 pm SAME RAIN SAMPLE IN PLASTIC BAG: 54.1 CPM^^ or 14.1 CPM alpha radiation ALPHA ALONE 34.8% HIGHER THAN BACKGROUND. Alpha makes up 50.9% of overage and is not the product of radon daughters/progeny as proved in Beta Watch. Sample #2 – 4:30 pm RAIN: 68.2 CPM^^ or 68.4% HIGHER THAN BACKGROUND
4:15 pm INT RSSMC BG: 40.5 CPM^^
Sample #1 – 8:15 am INT RAIN: 45.8 CPM^^ or background
8:00 am INT RSSMC BG: 43.6 CPM^^
These recent I-131 and other isotopic detections suggest there are still nuclear fission events occurring in the underground molten coriums at Fukushima. If these detected isotopes are not from Fukushima, then there must have been another recent major nuclear accident that has not been made public!
21st May 2015 – Iodine-131 detections in Finland and Norway preceded by detections in Japan.
Extract:
Iodine-131 levels in Gunma prefecture sludge skyrocketed on their May 1 report to the highest readings since the huge Fukushima emissions of July 2013. These analyses were actually done in April 21-23. This area is to the southwest of the Fukushima plant.
On May 12, I-131 was found in Chiba prefecture drinking water (not sludge). So it looks like the latest fission event is still going on.
The radiation data, however, is actually pretty solid. Zr-97 in Germany, I-131, Co-60, Nb-95, Ru-103, Cs-134 & Cs-137 in Finland, I-131 also in Norway, Sweden and Switzerland. Widespread upticks and “glitch dots” across Europe. A system slow-down for the USA… It makes me wonder.
The health effects of microwave non ionizing radiation, which is used in wifi devices tablets, and mobile phones is accumulative. Your risk of damaging health effects increases with exposure intensity, and with the length of time you are exposed.
In my opinion after doing lots of research on this subject, I have concluded that being exposed to significant amounts of non ionizing radiation and ionizing radiation at the same time is much more damaging than being exposed to just one type of radiation!
If I was living in the Northern Hemisphere particularly Japan and North America, I would be making a significant efforts to also significantly reduce both my non ionizing radiation and ionizing radiation exposure.
Wireless Risk Management
For wireless convenience, we are placing at risk the health of generations of children!
All mobile wireless devices are a source of microwave radiation. Microwave radiation was classed as a 2B carcinogen by the WHO in 2011, so limiting your exposure is important. Large numbers of independent peer review studies are showing this could potentially be a major health issue. All ionizing or non ionizing radiation is cumulative. Pregnant women, children, and and particularly girls, are much more sensitive to radiation that adults.
There is no safe level of microwave radiation exposure for children. In this video British microwave military expert Barrie Trower, explains why tablets, wireless computers, baby monitors, cell and cordless phones, plus other microwave radiation devices are NOT safe for children.
In this video “National Day Of Action Against Smart Meters”, with Jerry Flynn, there is reference to a US government document going back to 1976 listing all the health hazards caused by wireless devices and concludes, “This should be kept secret to preserve industrial profit.”
Wifi in Schools, The Facts
Cancer Officially Number One Cause of Childhood Death in U.S.
Practical things you can do to reduce your family’s exposure to Microwave radiation.
The more wireless devices you have turned on in your house at one time, the more intense will be the microwave radiation exposure to your family and the neighbours. Think about it. In a home of a family of four, each person could have a mobile phone, a tablet computer, their own laptop, a cordless phone system, Xbox game console, wireless access point, or mobile broadband device.
All of these devices radiate significant amounts of microwave radiation individually. Combined, this adds up to a very significant exposure. Train the family to turn them off, or use alternative technologies! Gee, I don’t even own a mobile phone, and I’ve survived! Some people are far more sensitive than others to this type of radiation, and can suffer significant symptoms, in a very short period of time.
Ideally stop using wireless devices altogether and use wired connections, or at least use methods to reduce you and your families exposure. Doing this not only limits your exposure, but also the exposure to everyone around you too! When it comes to microwave radiation, distance is your friend. Each doubling of the distance from a microwave transmitting device, quarters the radiation exposure.
1. Turn them off when not in use! This has an added benefit, that it lessens the time available for someone to hack into the device. Wireless devices such as printers, access points and tablets, can send out very strong microwave signals constantly, when left on.
2. Lower the wireless signal transmission strength to the lowest possible level you can, to get everything working well with a 3 to 4 bar signal strength. A lot of wireless modems, and access points will allow you to turn down the wireless transmission signal strength in their software settings.
3. Place wireless access points, and mobile broadband device as far away from you as practical. I have suggested to lots of people with mobile broadband devices, that they put it on a 5 meter USB extension cable. This is so they can get the device away from them. They can then also use it like an aerial, to find the best signal strength location. Don’t place these devices on your lap or on your person. Young guys will be frying the family jewels, for older guys it may not matter. 🙂
4. Only have the device’s wireless function turned on when necessary. Remember, there can be more than one wireless type built into a device, wifi as well a blue tooth etc. Turn off other built in wireless devices, if you are not using them. This will also improve security.
5. Do not sleep with these devices in your bedroom, or under your pillow. What is society coming to, for me to even have to mention this. 🙂 Not only is this a fire hazard, but also a health hazard.
6. Replacing a cordless phone system with an old style corded phone can greatly reduce the amount of microwave radiation emanating through your house, and your head.
Watch these two very informative videos on the biological effects of microwave radiation, based on lots of independent research from all over the world.
This short animation of Northern, and Southern Hemisphere air circulation, shows why we can get detections so far south.
May 2015 Summary
May 2015 saw a decrease in month average background levels compared to the last three years. When Southern Ocean air reaches this location, we see lower background averages. More Southern Ocean air reaches this location in the cooler months and winter, hence the significant seasonal variation in background levels. This May has seen significant Southern Ocean air flows.
May 2015 monthly average background radiation level was 4% above the pre-Fukushima average.
May average for 2014 was 13% above the pre-Fukushima average.
May average for 2013 was 7% above the pre-Fukushima average.
May average for 2012 was 7% above the pre-Fukushima average.
Here is an May 2015 comparison chart between Cairns and Caloundra, from the station operator located near Cairns. Cairns is on the east coast of Australia, and it is much closer to the equator than Caloundra. It is much more likely to get Northern air flows during the cooler months than Caloundra, see location map. In the chart, Cairns is red and Caloundra yellow.
Thanks to the North Queensland monitoring station operator for creating this chart. “The two bumps in the graph were coincidental with winds coming from the inland, from NW, instead of the predominantly SE airflow from the Pacific.”
On this page you will find all the month and year average charts, for local background radiation levels from November 2007 to 2015. The most recent data suggests the amount of airborne contamination reaching this location has decreased significantly.
In the warmer months I will try a new filter design. I don’t think the polyester and carbon filters are very efficient at capturing water soluble salts.
Disclaimer: This is an amateur volunteer run service. Human error can provide incorrect information, and equipment malfunction can produce false readings. Do not rely on, or take action upon information presented here, without further research.
“In most people with primary brain tumors, the cause of the tumor is not clear. But doctors have identified some factors that may increase your RISK of a brain tumor. Risk factors include:”
“- Your age. Your risk of a brain tumor increases as you age. Brain tumors are most common in older adults. However, a brain tumor can occur at any age. And certain types of brain tumors occur almost exclusively in children.”
➡ “- EXPOSURE TO RADIATION. People who have been exposed to a type of radiation called ionizing radiation have an increased risk of brain tumor. Examples of ionizing radiation include radiation therapy used to treat cancer and radiation exposure caused by atomic bombs.”
“- More common forms of radiation, such as electromagnetic fields from power lines and radiofrequency radiation from cellphones and microwave ovens, have not been PROVED to be linked to brain tumors.”
[…but they might. hmm…?]
Brazil, Alert level detections from two different sources.
An email from a contact just came in.
I’m currently in the extreme south of Brazil. 2 days ago, something unusual happened: the background went from the usual 0.013 to 0.017 to above 0.030mR/h for few minutes. No weather change was happening at the moment.
This event could be just equipment failure. My second counter wasn’t around for me to confirm.
——————————–
After this email arrived I had a look at the Brazilian live private monitors, and one on the Radmon network has been getting very elevated detections.
Getting elevated detections from two different local sources around the same time, means it is statistically more likely that these are genuine detections and not equipment malfunctions.
“Nature doesn’t need people.”
“People need nature. ”
[applause!]
This puts it in perspective. That’s what most people lack when it comes to the subject of the ongoing TRIPLE MELTDOWNS and the nonstop FALLOUT from Fukushima. Looking past today and tomorrow and where the next meal or paycheck will come from is the extent of the perspective for most of the people I know.
The increase in gamma counts in Fairbanks may have two origins: dust from 200 miles of the Tanana River floodplain. The river is low, leaving a lot of silt exposed to the wind. Plant pollen [birch, aspen, alder] is also in the wind and can carry radioactivity absorbed earlier by trees. Winds from the south and east are redistributing cesium and other hot stuff that was dropped in the initial reactor explosions and fires in 2011. When pollen and dust go airborne, it registers on EPA’s monitor. Take no solace from the ‘small’ numbers. This stuff is incredibility poisonous, half a gram can kill thousands and render landscapes uninhabitable for hundreds, perhaps thousands, of years. More? Search: low dose radiation effects [sudden heart attack is my favorite].
Mobile camera sensors are made up of a large number of very small light sensitive pixels, that are also sensitive to ionizing radiation. If you stop all light from reaching the the solid state mobile camera sensor, then mostly only ionizing radiation Beta or Gamma can turn on a pixel.
By counting the number of active pixels each second, in a totally dark environment, you can roughly calculate the amount of radiation it has been exposed to. Even though this mobile app provides adjustment for the different sensitivities of camera sensor types, and sensor background noise, it is important to check at the app site for mobile phone suitability.mic
Look forward to your article on China’s impact upon America’s environment.
This is a significant change. Thank you for the summary.
“EnviroReporter.com has not found such a high degree of alpha in its sampling in thousands of previous tests conducted over the last four years.”
– Michael Collins
What is the increased alpha possibly indicating?
IMO – It indicates that… the ongoing global catastrophe at Fukushima is obviously not improving nor is it going to be any time soon.
People should be aware and prepared. Exactly what that means, I’m not so sure. I guess when the Kardashians start wearing ‘masks’ as a fashion statement, then maybe people will catch on.
I wish the EPA wasn’t a farce.
I wish lungs had replaceable filters. 🙁
The first summer 2015 EnviroReporter.com air radiation analysis for Southern California shows a significant uptick in alpha and beta according to a dust analysis completed June 1. Results show radiation registering at 325.7 percent of background levels.
This means that the dust reading in its entirety was over three times background. The U.S. Environmental Protection Agency considers radiation three times background or above to be “significant.”
The California Highway Patrol maintains a three times background trip level to trigger a hazardous materials response by the agency. Hazmat protocols include use of respirators and other body and breathing protections when dealing with a radiation source ionizing at this level or above.
A spring 2015 examination performed April 17 at Radiation Station Santa Monica, which along with eight affiliated radiation stations across America and Australia have completed over 7,322 tests and reports since March 15, 2011, showed radiation at just 78.8 percent above normal.
The first tests of summer also indicate a high presence of alpha radiation which, by itself, comprised 75 percent of the overage with beta making up the other 25 percent. Indeed, the alpha detected alone was over 168 percent of background levels of radiation.
EnviroReporter.com has not found such a high degree of alpha in its sampling in thousands of previous tests conducted over the last four years.
Alpha radiation, which can be stopped by a piece of paper or plastic, is nevertheless the most dangerous to human health of the main different types of radiation: alpha, beta, gamma and X-ray. Ingestion through drink, water or breathing are the main pathways for alpha radiation into people and animals.
While alpha particles are positively charged and are relatively heavy, blocking them is easier than beta or gamma because they travel a short distance before losing energy. Nevertheless, alpha radiation is between 20 to 1,000 times more dangerous to the human organism due to their “relative biological effectiveness” in causing cell-death and cancer according to numerous sources.
EnviroReporter.com‘s periodic beta testing of dust acquired from three HEPA filter machines in Santa Monica is in response, in part, to the fact that the EPA’s Los Angeles RadNet beta detecting graphs online have been absent for several years. The L.A. RadNet gamma station appears to be continuing to function.
A June 1 tally of RadNet found only 37 out of 124 beta stations functioning across the United States and Puerto Rico. Large metropolitan areas like New York City, Boston and Chicago all have no beta detection graphs working. States like Florida, with five RadNet locations, have no operating beta graphs at all.
The working beta stations reveal four month highs were found across America. Hitting this dubious milestone included Montgomery Alabama, Tucson Arizona, San Bernardino County California, Hartford Connecticut, Fort Wayne Indiana, Baltimore Maryland, Grand Rapids Michigan, Concord New Hampshire, Toledo Ohia, Pittsburgh Pennsylvania and Madison Wisconsin.
Beta radiation includes fission products from nuclear reactors including Cesium-134, Cesium-137 and Strontium-90. Massive amounts of these beta radionuclides have escaped into the air and Pacific Ocean at Fukushima Japan which is in its fifth year of an ongoing triple meltdown that began March 11, 2011 after an earthquake and tsunami destroyed most of a huge reactor complex there.
EnviroReporter.com has been testing various media for this escaped radiation ever since. Its highest detections of radiation in the environment came in late 2013 with rain ionization in Death Valley National Park coming in at dozens of times background.
Until the EPA ever gets its RadNet system fully operational, Americans will only have a partial idea of how ‘hot’ with radiation its air is. Failure to maintain this system leaves the country at a huge loss should radiological releases happen due to nuclear plant malfunctions and meltdowns as well as terrorism by an expanding list of American enemies who vow to destroy it.
BY THE NUMBERS:
Radiation Station Santa Monica, California USA
June 1, 2015
12:40 pm INT SAME HEPA DUST IN PLASTIC BAG – ALPHA TEST: 64.8 CPM^^ which suggests strong alpha radiation presence. A plastic bag will block alpha radiation meaning that of the background overage, beta was [64.8 – 41.5 =] 23.3 CPM^^. The total amount over background was [134.7 – 41.5=] 93.2 CPM^^. The amount of alpha radiation detected was this total minus the beta component of it [93.2 – 23.3 =] 69.9 CPM^^ The ALPHA RADIATION ALONE IS 168.4% OF BACKGROUND HIGHER which is astonishing.
12:25 pm INT RSSMC BG: 41.5 CPM^^
12:10 pm INT HEPA DUST from two HEPA filters, one Ionizer/HEPA filter from May 20 to today, or 43 days total: 134.7 CPM^^ which is 2.25 TIMES BACKGROUND HIGHER In just 61% of the time of the last period, the sample was 2.88 times higher over background than in the prior period.
May 20, 2015
4:45 pm INT HEPA DUST from two HEPA filters, one Ionizer/HEPA filter from March 11 to today, or 70 days total: 68.1 CPM^^ which is 78.8% ABOVE BACKGROUND which is just 20% of the radiation over background from the last period which was half as many days. This is a welcome reading and result.
4:30 pm INT RSSMC BG: 38.3 CPM^^
+++
June 1, 2015 Nationwide Radiation Report
BETA GRAPH ANALYSIS
Since our last report April 17, 2015 (below in archives), Montgomery AL soared to a four month high May 10 topping ~365 CPM; Anchorage AK saw its crucial beta monitoring cease March 24 but sputtered to life April 28 and shows June 1 to be a mild ~40 CPM; Fairbanks AK hit 150 CPM May 22; Phoenix AZ May Day was perhaps a good watch-word on May 1 with a ~520 CPM spike; Tuscon AZ hit a four month high May 12 with a sizzling ~435 CPM May 12; Little Rock AR registered ~135 CPM May 5; Fort Smith AR registered 100 CPM June 1; Anaheim CA‘s beta graph shows just ~45 CPM June 1 which is small consolation for their Anaheim Ducks’ historic debacle; Fresno CA smashed through previous highs hitting ~970 CPM November 11 and then the graph died December 2 leaving a huge hole in California airborne beta monitoring – as of June 1 it’s still blank but it’s gamma graph is active; Bakersfield CA hit ~440 CPM May 28; Los Angeles CA‘s beta graph stopped in March 2014 never to return in America’s second largest metropolitan. Our June 1 HEPA filter debris test found hot dust registering positive for alpha radiation which came in alone at 168.4% of background higher which is astonishing; Riverside CA‘s graph gave out September 15, 2014 never to return; San Bernardino County CA smashed through a four month high of ~610 CPM on May 8 which is about twenty times normal; San Diego no longer has a working beta graph because it died January 15 after months of erratic fits and starts but gone for good in a town with a huge Navy base which makes the station’s inoperability careless in the extreme; Hartford CT jumped to a four month high May 30 with ~125 CPM; Washington DC registered just ~35 CPM June 1; still not one beta monitor out of five works in Florida which is amazing and maybe because the gamma’s high activity suggests something really hot in the Sunshine State where citrus has tested positive for Fukushima-originated Cesium-134 since the meltdowns began; Augusta GA no longer has a working beta graph in a very active environment, unfortunately, giving out August 25, 2014 never to return; Ft. Wayne IN had a malfunctioning beta station from February 5 through March 9 but hit a four month high May 24 with a jolting ~340 CPM; Baton Rouge LA was just ~20 CPM June 1; Orono ME is the farthest functioning beta station away from the triple meltdowns at Fukushima Dai-ichi, Japan, and this lovely town has the lowest readings sometimes down into the single digits for days at a time like June 28 with it in the single digits around 9 CPM; Baltimore MD‘s beta and gamma graphs are now ‘on’ and functioning properly with the city hitting 200 CPM May 18, a four month high; Worcester MA blew through ~320 CPM September 28 and has spiked three times in November over 200 CPM and then its beta station died December 9 and then briefly be reborn Christmas Day only to die, for good, the next day and joined Boston in the dead beta graphs group; Grand Rapids MI got up to a four month high May 15 with ~175 CPM; St. Paul MN was blowing through 300-350 CPM regularly before its beta station died October 16, 2014 not to return in this important upper Midwest center until the last two days where it read a scant ~35 CPM June 1; St. Louis tested ~40 CPM June 1; Lincoln NE topped 300 CPM on May Day; Concord NH registered a four month high May 12 with ~195 CPM in an area with normal background around ~25 CPM; Albuquerque NM registered ~260 CPM May 7; Buffalo NY tested at 150 CPM May 30; New York City NY is not functioning as it hasn’t for years but its gamma gross count is sort of jumping around like LA’s gamma is – just one difference, NYC’s gamma is much more active which is one thing New Yorkers can brag about: they’re hotter than Los Angelenos even if their crucial beta station is on the fritz; Syracuse NY showed ~160 CPM November 26 and then the beta graph died December 1 and never came back plus its gamma station is poorly maintained as evidenced by the scant and inaccurate readings, dying once again completely May 5; Charlotte NC‘s graph died January 13 but came alive May 6 hitting ~145 CPM May 19; Raleigh NC hit ~170 CPM July 24, 2014 and cut out and still hasn’t come back on, a real loss in the South; Toledo OH hit a four month high May 8 with ~210 CPM; Corvalis OR was ~105 CPM June 1Pittsburgh PA soared to a four month high May 7 topping ~225 CPM; Puerto Rico‘s beta graph doesn’t work but the gamma remains somewhat active; Amarillo TX is one of the hottest sites in the country was just ~80 CPM last night after topping ~910 CPM April 27; Dallas TX spiked to ~245 CPM May 28; Ft. Worth was just ~40 June 1; Salt Lake City UT‘s beta station is still down since a huge beta increase over 200 CPM in early May 2014 and remains knocked out; and Madison WI hit peaked at a four month high May 25 with a chart-topping 350 CPM.
@vital1: Outstanding comments that both horrify and give hope. That Tokyo had higher tap water contamination levels than Fukushima City should make that health conscious country concerned, don’t you think? Apparently not. It is easier to feign ignorance than face up the the fission flowing out of the faucet courtesy of the triple Fukushima meltdowns more out of control than ever, especially if you live in a ‘don’t rock the boat’ culture. How many American and Australian athletes are training their hearts out to make it to the 2020 Tokyo Olympics miles only to be greeted by hot water and all that’s cooked with it? Or the millions of tourists and business people visiting, and soaking in, the Land of the Rising Radiation Levels? The denial is staggering.
But perhaps not as staggering as what you bring us in the way of news about China’s “insane” plan to build over 70 (SEVENTY – not a misprint) nuclear reactors upwind of Japan and North America with ridiculously substandard safety controls. It is slow motion national suicide which won’t just sink this country of over a billion. China’s impact upon America’s environment is the subject of an upcoming EnviroReporter.com exposé.
That’s why Denise Anne and I are thrilled you’ve shared how we can turn our smart phones into nuclear radiation monitors. But first, vital1, since you have more equipment, experience and skills in the world of radiation detection than the most of us, can you tell us how it works?
Using a mobile phone app to turn an Android and iOS Mobile phone into a Geiger counter. A cheap way to get a basic Geiger counter when you’re on a budget.
An independent review on how effective this Geiger counter app can be, when set up on an Android or iSO mobile phone. The youtube video also shows how use, and set it up.
Go to the app creators web site, to check out which models of mobile phones it will work on.
25th May 2015 – China warned over ‘insane’ plans for new nuclear power plan
Extract:
He Zuoxiu, a leading Chinese scientist, says the country is not investing enough in safety controls after lifting of post-Fukushima disaster reactor ban.
He said: “They want to build 58 (gigawatts of nuclear generating capacity) by 2020 and eventually 120 to 200. This is insane.”
@vital 1 et al: Astonishing story and all the more horrifying now that the brave 25-year-old sailor has been apprehended, Britain won’t charge him with the Official Secrets act for this whistleblowing, according to the Guardian. That way the allegations won’t be examined publicly. And the American press is muted as both CNN and the New York Times haven’t covered this at all. But we are right now:
Unlike climate change, eliminating nuclear weapons is not only possible, it is going to be mandatory for the survival of the species. Luckily, America’s nukes run on such an old system that it can’t be hacked into by hostile groups like, say, ISIS. So what to do? Drop a cool $355 billion over the next decade on nukes alone, part of a 30-year trillion dollar splurge on the scourge of the planet. And you wonder where your taxes are going?
18th May 2015 – Nuclear disaster waiting to happen’: Royal Navy probes Trident whistle blower’s claims
Extracts:
McNeilly, a weapons engineer, who allegedly served from January to April this year on board the HMS Victorious, claims that a number of security lapses and technical faults with the Trident missiles carrier exposes the UK nuclear deterrent to potential terrorist attacks that “would kill our people and destroy our land.”
This short animation of Northern, and Southern Hemisphere air circulation, shows why we can get detections so far south.
Tritium Detection?
I delayed publishing the April 2015 rain water report because of ongoing technical discussion regarding the possible detection of Tritium, in this months water filter test.
There are very small amounts of naturally occurring Tritium in the atmosphere. It can be created in trace amounts by spallation in the upper atmosphere, by cosmic rays or from releases from a nuclear power plant or nuclear accident.
It is only conjecture at this point that it is Tritium, and has not been confirmed. It could equally be another isotope, or a technical issue with the equipment at these very low energy keV detection levels.
Both Iodine I-129, and Beryllium Be-7, which were detected in this months water filter test can also be created by spallation in the upper atmosphere, by cosmic rays or from releases from a nuclear power plant or nuclear accident.
There was a lot of solar storm activity last month, and it takes around two weeks for spallation products to reach the surface of the planet.
Lead Pb-210 is the decay daughter of naturally occurring Radon decay. It can also be released from a nuclear power plant, or nuclear accident. At present there is no conclusive evidence that any of the latest isotope detections here at this location are from Fukushima.
Disclaimer: This is an amateur volunteer run service. Human error can provide incorrect information, and equipment malfunction can produce false readings. Do not rely on, or take action upon information presented here, without further research.
@vital1, Dale & Chase: Thank you for the invigorating discussion. Our rain samples confirm what we’ve thought – the forest fire adjacent Chernobyl made aloft radiation, but not enough of it to disperse over the West Coast of the USA as pre-supposed by the anonymously-run optimalprediction.com. If it’s there, it’s too low to count.
May 14, 2015
3:00 pm INT RAIN sample: 37.5 CPM^^ or background
2:45 pm INT RSSMC BG: 41.3 CPM^^
1:30 pm INT RAIN sample: 43.8 CPM^^ or 21.3% ABOVE BACKGROUND but we consider normal per subsequent sample reading
1:15 pm INT RSSMC BG: 36.1 CPM^^
May 8, 2015
10:00 am INT RSSMC BACKGROUND: 37.5 CPM^^
9:30 am INT RSSMC RAIN remnants sample: 40.6 CPM^^ or background April 18, 2015
7:00 pm EXT Pacific Ocean water sample taken with paper towel: 34.5 CPM^^ or background
6:45 pm EXT Background including paper sample towel at Pelican Cove, Palos Verdes CA: 39.0 CPM^^
This short animation of Northern, and Southern Hemisphere air circulation, shows why we can get detections so far south.
April 2015 Summary
April 2015 saw a decrease in month average background levels compared to the last three years. When Southern Ocean air reaches this location, we see lower background averages. More Southern Ocean air reaches this location in the cooler months and winter, hence the significant seasonal variation in background levels. This April has seen significant Southern Ocean air flows.
April 2015 monthly average background radiation level was 8% above the pre-Fukushima average.
April average for 2014 was 22% above the pre-Fukushima average.
April average for 2013 was 9% above the pre-Fukushima average.
April average for 2012 was 12% above the pre-Fukushima average.
Here is an April 2015 comparison chart between Cairns and Caloundra, from the station operator located near Cairns. Cairns is on the east coast of Australia, and it is much closer to the equator than Caloundra. It is much more likely to get Northern air flows during the cooler months than Caloundra, see location map. In the chart, Cairns is red and Caloundra yellow.
Thanks to the North Queensland monitoring station operator for creating this chart.
On this page you will find all the month and year average charts, for local background radiation levels from November 2007 to 2015 for Caloundra. Historically, the recorded pre-Fukushima local background here was low, averaging around ~0.1 uSv/hr. This data has allowed the tracking of changes in local background levels, plus the detection of radioactive clouds passing through.
The most recent data suggests the amount of airborne contamination reaching this location, has decreased significantly.
Disclaimer: This is an amateur volunteer run service. Human error can provide incorrect information, and equipment malfunction can produce false readings. Do not rely on, or take action upon information presented here, without further research.
@Chase: Yes, there is a lot of red in nuclear power’s ledger (traditional high power fission reactors). The economics of nuclear power has always hidden those costly parts of the equation away. Thank you for pointing out those high costs and the continuing long term threats to the environment that they pose.
The point of the article I posted was mostly about bringing renewable energy, chiefly wind and solar, into the same “always available” category as nuclear. Doing so inexpensively would make wind and solar, with battery storage, compete head to head with nuclear power without all of the risky, poisonous attributes of nuclear fission.
I also mentioned fusion as a safer form of nuclear power, and I do hope that one day mankind will master that technology. Not that it doesn’t present it’s own risks, but those risks will be much lower than fission technology. Some of the large scale “hot” fusion technology uses tritium and deuterium fuel, and these elements can also be harmful. There are other forms of fusion power, so-called Cold Fusion, or Low Energy Nuclear Reactors, that may also prove feasible. These methods might also provide round the clock power but have much safer materials and waste products. Hopefully, they would replace fission reactors when the fission reactors are retired or when fission technology is finally judged to be too risky to continue operating.
And, let’s just hope fission reactors are the most dangerous technology we ever implement in search of limitless energy. I don’t want to think about what might go wrong with manmade exotic matter or black holes.
“The economics of renewable energy versus nuclear power may be changing,…”
IMO – There never was an ‘economic’ comparison of renewable sources to nuclear power and there never will be.
That was one of the Nuclear Power Industry’s first lies and probably the one LIE that’s most easy to understand. Not counting the simple numbers like comparing the cost of 1 Nuclear Plant to the number of windmills or solar panels that could be installed with that money. Then, there’s the long term storage of radioactive waste. Again, there is no such thing as ‘safe’ long term storage. What’s the REAL COST of that? The answer is, there is no number! 300 years 10,000 years 24,000,000 years is how long some of this stuff will still be contaminating the planet. Nuclear Proponents are robbing the future in order to boil water today.
The insidious nature of radioactive contamination’s transport vectors guarantees that at some point, when a barrel breaks, a fuel pool no longer cools or when tectonic plates move and the underground storage facilities are breached there will be contamination. Sure, it may take a few decades or even a few thousand years, but as it stands now, it will happen. (Example: WIPP) That’s if it’s not illegally dumped first. We know that happens more than we care to think about, but it does. What’s the cost of that?
Now add in the cost/value of the contaminated areas of the planet we already have and it should be really clear there is no economic comparison. What is the value of damaged DNA? What is the cost to mother earth? There is no way to put a number to such an immoral atrocity.
I also have no doubt that more MELTDOWNS will occur. Yes, time is of the essence.
‘There will be meltdowns’
“Presentation held in Loviisa 12.1.2010. Gordon Edwards is math & physics professor from Canada who increases awareness of nuclear power to prevent the harm that the mere self-sustaining thrive of the industry leads to.”
The CONS of Fusion Power:
“Given that the fusion approach, will not, failing any miraculous breakthroughs, be ready by the time we need it, which is very soon if not now, it could be argued that it makes more sense to spend those billions of research dollars on something that will be.”
(It may not be realistically achievable large scale.)
“[Fusion] It is not expected to be commercially available until somewhere around 2050. If you believe the projections on climate change, we pretty much need to have our energy house in order by then, with a dramatically lower carbon footprint that needs to begin dropping yesterday. The DOE has forecast that the US can meet 80% of its electricity demand from renewables by that time using existing technology while Denmark will be fulfilling 100% of its total energy needs with renewables by then.”
(We don’t need it.)
…more
Cons of nuclear fusion
· Unproven at anything resembling commercial scale.
· No full scale production expected till at least 2050
· Commercial power plants would be extremely expensive to build
· Requires extremely high temperatures. Difficult to contain
· Could produce a net negative amount of energy (gee, that would suck)
· IF cold fusion could be achieved, it would be much easier to implement.
· The billions in research funding could be spent on renewables instead http://www.triplepundit.com/special/energy-options-pros-and-cons/fusion-power-pros-cons/
@Dale: Waiting for the next nuclear accident, courtesy of the Sun itself, does not seem to be addressed and with the odds of a full scale catastrophe setting alight spent fuel pools at 12 percent in the next decade. Should “all fronts” include nuclear, especially the 70+ new reactors China is envisioning, without addressing this? That doesn’t even address the intractable problem of nuclear waste and proliferation.
Can nuclear power ever be made to be as safe as solar or wind power, backed by utility scale batteries? Can fission reactors and their poisonous radioactive fuel/waste ever be safely stored? How many years and how much will it cost to invent “safer” fusion reactors? While such technology may eventually be developed, we may be much closer to developing large utility scale batteries than solving either long term safe storage of radioactive waste or developing new, safer fusion reactors.
Personally, I would like to see progress on all fronts. Reduce and phase out unsafe nuclear technology. Safely store existing radioactive fuel and waste (at least as long as it takes to either remove it from planet Earth or transmute it into something less harmful). Develop safe fusion power, renewables, and utility scale energy storage. There is no shortage of ideas to transform our energy industries, but we may be short of one thing, — time. Time to put together a comprehensive plan to address all of these issues before we experience another nuclear accident.
A news story today, 5/4/15, that radioactive waste from Tennessee is going to start heading to the Nevada Test Site by truck fairly soon. Significant concerns, all along the truck route, if there is an accident where one of the large containers falls off the truck. But, at least we get a brief look at what the truck and cargo combination will look like. So if you’re using U.S. 40 to drive cross country, if you see one of these babies steer clear. See photo & article at: http://www.reviewjournal.com/news/nevada/test-run-signals-start-nuclear-waste-shipments-nevada
I made a comment here in March 2015 about the Chernobyl seclusion zone being closed for several weeks because of a terrorist threat. Now we have a zone closure because of Fire threat. Just seems odd to me. Maybe there’s more going on at Chernobyl than we are told? That’s seems like how it’s consistently worked in the past. I know it’s speculation on my part, but what are we supposed to do?
Visible smoke plume seen on April 28 MODIS satellite image (natural-color composite). Zone of Alienation shown as red circle. International borders are yellow. Visible plume extends at least 60 km into Belarus.
Michael, the Belarus state run background radiation monitoring page has gone down. I am presently getting a 404 page error. Belarus borders the Ukraine near the contaminated Chernobyl forests, it also has forests highly contaminated by the 1986 Chernobyl nuclear catastrophe.
It was working the last time I looked, which was last night here in Australia, this would be early morning on the 2nd May for the USA. There appeared to be a slight uptick in background levels in Eastern Belarus the last time I looked. I do not have enough information to clarify if this was a natural variation for that area of Belarus, or a result of the Chernobyl forest fires.
@vital1: The resuspension of Chernobyl radiation through these forest fires is going to be picked up somewhere. Your links are superb. Thank you for keeping us on top of this as it has implications for the region and world.
HAZMAT in Ukraine on Thursday, 30 April, 2015 at 08:36 (08:36 AM) UTC.
Extract:
Radioactive ashes and dust caused by the forest fire in exclusion zone of Chernobyl nuclear power plant is expected to fall today in Kiev – during the previous days of the fire the radioactive precipitation fell in Belarus.
Chernobyl forest fires are something to take notice of, and keep and eye on, particularly if you are living in Europe.
29th April 2015 – Forest / Wild Fire in Ukraine on Wednesday, 29 April, 2015 at 03:07 (03:07 AM) UTC.
Extract:
Fire has engulfed a large sector of woods in the exclusion zone around the destroyed Chernobyl nuclear power plant. Ukrainian prime minister Arseniy Yatsenyuk says the fire is being brought under control. It is unclear if the fire has hit parts of the zone heavily contaminated by radiation from the 1986 reactor explosion and fire. A 30-kilometer (18.6-mile) zone around the plant is off-limits to most people except for workers constructing a new shelter to cover the destroyed reactor’s building, and to visitors on short trips. The explosion and fire left some sections of the zone heavily contaminated, while other parts were less damaged. Interior Minister Arsen Avakov said Tuesday the fire involved about 400 hectares (1.5 square miles).
07.07.2012 – Chernobyl’s radioactive trees and the forest fire risk
Extracts:
“Pine damages easily. Wind blows it down. Insects infest it. Drought makes brush into perfect tinder which can all too easily catch fire. And these dying radioactive plantations are considered too dangerous and expensive to clear.
If ignited, one expert likens the potential effect to setting off a nuclear bomb in Eastern Europe. Wind could carry radioactive smoke particles large distances, not just in Ukraine, but right across the continent.”
“Sergiy says more big wildfires in Chernobyl like the one in 1992 would be catastrophic for Ukraine’s image, and potentially devastating for farmland right across Europe.”
“Berries are highly efficient at soaking up and storing radionuclides, huge quantities of which were dispersed over large parts of the Soviet Union and Western Europe by smoke plumes from the explosion. ”
“It is blueberry season, and they are selling them by the plastic pint glass. You could pull in to haggle, but Sergiy Zibtsev, a professor from the Forestry Institute at the Kiev University of Life Sciences does not recommend it. They are laced with radioactive strontium.”
Comment:
The civil war in the Ukraine posses unforeseen threats to people across Europe. With a lot of scarce resources going to the civil war effort, neglect of Chernobyl’s forests could be a major health issue for people living across Europe!
“Michael, we definitely need a lot more people to wake up to how serious the Fukushima Nuclear Catastrophe is, plus how widespread the environment damage is. ”
– vital1 April 24, 2015 at 3:13 am
The media PR headlock/stranglehold is extremely tight.
However…
I would like to see a roving random question asked of those on the street. Maybe Michael and Denise could make a video? I am guessing that many would be knowledgeable, some would respond with anger and others would pretend to not care.
I would ask questions like these to start.
➡ Regarding Fukushima and it’s Nuclear Power Plants:
is…
A. the crisis over?
B. the situation in cold shutdown?
C. it like a banana or an X-ray?
D. radiation (fallout) diluted?
E. mitigation something you think about?
etc…
IMO – People are somewhat aware, but because of peer pressure and political correctness many are afraid to speak or they have issues with revealing their true thoughts because of the psychological severity of the catastrophe itself. It’s a powerful control mechanism. It might be an interesting experiment.
“At the heart of the tale are several men, leaders of the Canadian mining industry, who have been major donors to the charitable endeavors of former President Bill Clinton and his family. Members of that group built, financed and eventually sold off to the Russians a company that would become known as Uranium One.”
Should this tale prove true, Hillary Clinton could be facing a criminal inquiry that will make her bid for President more a road to a Republican return to the White House. Arrogance + stupidity + greed + uranium = Time in the ‘big house,’ not the White House.
LONDON, 24 April, 2015 − World group seeks ban on uranium and nuclear power
Extracts:
Uranium mining across the world should cease, nuclear power stations be closed and nuclear weapons be banned, according to a group of scientists, environmentalists and representatives of indigenous peoples.
The declaration applauded the expansion of renewable energy and the significant strides in phasing out nuclear power following the growing awareness that “nuclear power is not a cost-effective, timely, practical or safe response to climate change”.
The Symposium’s co-president, Dr. Dale Dewar—a physician who is associate professor at the University of Saskatchewan and is co-author of the book, From Hiroshima to Fukushima to You—summed up by saying: “We are calling on national and international leaders to protect our planet and our populations from any further nuclear catastrophes. Anything less would be irresponsible.”
I can’t believe they’re going to hold the Olympics in Tokyo. The entire area is dangerously radioactive. Everything from the streets to the food is contaminated. If I were a participant I’d have to bow out. What a tragedy.
Michael, we definitely need a lot more people to wake up to how serious the Fukushima Nuclear Catastrophe is, plus how widespread the environment damage is.
Report just in, another very high radiation detection. Children had been playing in this Tokyo park, up until now!
24th April 2015 – Tokyo park closed after extremely high radiation levels found, prompting child health fears
Extract:
Soil underneath a slide at the park in Toshima ward in the north-west of the Japanese capital showed radiation readings of up to 480 microsieverts per hour, the local administrative office said.
@vital1: Thank you for this excellent analysis. It makes the most sense, this Toxicity multiplying effect combined with rising sea water temperature. Smart and absolutely critical insights that will be ignored but all here.
Earth Day, the day most people pat themselves on the back for using cloth bags and ‘caring’ about the environment. It might as well be called Smurf Day for all it matters. That’s why we’re blessed to have such superb insights from you, vital1. The only other thing I read of note on Smurf Day was Bloomberg’s Beyonce Beats Environment as Media Favors Celebrity News which says “Beyonce Knowles, the pop singer and actress, gets 11 times more mentions in U.S. media than stories about deforestation and five times more than the ocean’s health, according to a report by the Project for Improved Environmental Coverage non-profit group. Environmental stories made up less than 1 percent of headlines last year, its survey shows.”
We shall reap what we have sown. Some us, however, are doing something about it. Thank you fellow raddies.
Radiation contamination of the environment on the scale of the Fukushima nuclear catastrophe, has much broader effects than just detectable increases of radiation in air and water spreading out from Japan. It affects the dynamics of the entire biosphere!
In my opinion it is not just the radioactive contamination from Fukushima directly poisoning the sea, and causing the large Pacific Ocean die offs. It is a combination of interrelated factors, because everything is interconnected.
The Toxicity multiplying effect.
North Pacific Ocean water is now a mixture of toxic industrial chemicals washed out to sea during the tsunami, and a verity of radioactive isotopes, not just Cesium, but also Tritium, Strontium, Americium, and Plutonium, etc. A lot of these isotopes are heavy metal toxins, as well as being radioactive. All this has now been added to the toxins that were already in the Pacific Ocean before Fukushima.
A single toxin in the environment can be a hazard, and maybe an organism’s natural biological defense systems can deal with this effectively. If an organism has multiple toxins present radiological and chemical, to deal with at the same time, you get a biological toxicity multiplying effect. The human or animal defense systems becomes weaker the more toxins it has to deal with.
Biologically one toxin, plus one toxin, does not equate to double the toxicity effect. Studies show you can get a multiplying toxicity damaging effect 10 to 20 time greater. The human or animal defense systems becomes weaker, the more toxins it has to deal with. The organism becomes overloaded dealing with to
much toxic stress at once.
All this weakens the immune systems of humans, plants and animals. So we could see viruses that would normally be under check become more infectious , or viruses mutate into more infectious strains.
In the long term more humans, plants and animals life may die from the indirect effects of the radioactive contamination, as a result of the weakened immune systems, or from virus mutations.
Atmosphere damaged.
Extreme UV levels are now being detected in both Northern and Southern Hemisphere, spring and summer. I am suggesting that the increase in Northern hemisphere UV has been caused by atmosphere damage from the large amount of ionizing radiation released into the Northern Hemisphere upper atmosphere, by the Fukushima Nuclear Catastrophe.
Extract:
“Aquatic wildlife is particularly vulnerable Phytoplankton are at the start of the aquatic food chain, which account for 30 per cent of the world’s intake of animal protein.
Phytoplankton productivity is restricted to the upper layer of the water where sufficient light is available. However, even at current levels, solar UV-B radiation limits reproduction and growth.
A small increase in UV-B exposure could significantly reduce the size of plankton populations, which affects the environment in two ways. With less organic matter in the upper layers of the water, UV radiation can penetrate deeper into the water and affect more complex plants and animals living there. Solar UV radiation directly damages fish, shrimp, crab, amphibians and other animals during their early development.
Pollution of the water by toxic substances may heighten the adverse effects of UV radiation, working its way up the food chain. Furthermore less plankton means less food for the animals that prey on them and a reduction in fish stocks, already depleted by overfishing.”
A possible new cause for upper atmosphere damage is from the large Fukushima krypton-85 and other radioactive releases. This is creating a Planetary Thermal Imbalance & Extreme UV Levels. Planetary Thermal Imbalance is indicated by record breaking extremes in worldwide hot and cold temperatures. The large difference between hot and cold creates extreme weather events.
A lot of Kryton-85 was released by the Fukushima Nuclear catastrophe.
Extract:
“The study shows that krypton-85 from nuclear fission enhances air ionization and, thus, interferes with the atmospheric-electrical system and the water balance of the earth atmosphere.
If Krypton-85 continues to increase, changes in such atmospheric processes and properties as atmospheric electric conductivity, ion current, the Earth’s magnetic field, formation of cloud condensation nuclei and 57 aerosols, and frequency of lightning may result and thus disturb the Earth’s heat balance and precipitation patterns.”
These Krypton-85 induced consequences call for Krypton-85 monitoring.
A 1992 German risk study of a NPP core melt down on the upper Rhine river concluded that.
1. Strontium-90 levels would skyrocket, and reach a peak levels around 5,000 days later. Strontium-90 levels would then stay high for around another 40,000 days + !
We are already seeing reports of skyrocketing levels of Strontium-90 being detected in the ground water tests, at the Fukushima Nuclear Catastrophe site.
2. Cesium-137 would reach peak levels after 10,000 days.
Interestingly, Tepco has has tried to implemented the counter measures suggested in this document, at the Fukushima Nuclear Catastrophe site. They have not had much success so far.
(Note: that the charts in this document are log scale.)
If this study is correct, these increases will continue long into the future!
All the wars, and strife in the world at present is analogous to people fighting each other on a sinking boat. We urgently need the whole world to cooperate, and focus on mitigating the Fukushima Nuclear Catastrophe.
A robot shows the glowing green inside one of the damaged Fukushima nuclear plants. It’s a pretty impressive video, I thought readers might want to take a look. The text says that the radiation levels aren’t as high as expected… The camera image displays up to 8 Sv/hr, though. I’m glad that these areas can now be surveyed, that shows progress in the cleanup effort. But, the damage is done. We need these images to underscore the danger from nuclear accidents. http://www.cnn.com/2015/04/20/asia/japan-fukushima-second-robot/index.html
HAZMAT in Mexico on Thursday, 16 April, 2015 at 04:49 (04:49 AM) UTC.
Extract:
Authorities issued an alert for several Mexican states on Wednesday after thieves snatched potentially deadly radioactive material used for industrial radiography.
“Being close to this quantity of unprotected radioactive material for hours or days could be fatal,” the statement warned. It was the latest case of radioactive material being stolen in Mexico. In December 2013, thieves took a truck containing highly radioactive cobalt-60, but they were apparently unaware of the cargo within the vehicle. Authorities ultimately arrested and hospitalized several suspects in that case after recovering the potentially lethal material.
The Mosterhamn private monitoring station in Norway just went ballistic at 78.34 uSv/hr, and most likely a false alarm, but worth keeping and eye on. Correction 664 uSv/hr!
I have also noticed over the last couple weeks is Grimsby private station located on England’s East coast, on radmon.com, constantly detecting elevated levels of background radiation.
By the charts, the equipment appears to be operating normally. This suggests significant radiation from a local source is passing through the area.
March Southern Hemisphere 2015 Rain Water Test Report
Summary:
Again this month we see trace detections of Beryllium Be-7 and Lead Pb-210, nothing that we could definitively qualify as Fukushima contamination. Beryllium Be-7 can be made by spallation in the upper atmosphere, during solar events, and takes around two weeks to reach the surface. Lead Pb-210 is a decay daughter of Radon Rn-222. Both these isotopes can also be released from a Nuclear accident.
No were near as much water went through the rain water filter this month (68mm), as last month (426.6mm).
Roof down pipe filter design for rain water testing.
Rain Filter Test Chart (The chart is minus background.)
In this chart I have CPS on the Y axis to show activity, and have turned off Y log to show linear scaling. This is only a test chart of the polyester part of the rain water filter system design.
Disclaimer: This is an amateur volunteer run service. Human error can provide incorrect information, and equipment malfunction can produce false readings. Do not rely on, or take action upon information presented here, without further
research.
The email about the daughter who consumed some ‘potentially’ rad-hot tuna ‘possibly’ packed in the USA, (comment by vital1 on the Food Lab page), is probably just the tip of the iceberg when it comes to how the radioactive contamination transport vectors will sooner or later find a path to… somewhere.
I read an article in “The Independent”, linked by drudgereport.com, concerning some foods produced in the Fukushima area, alledgedly finding their way to Taiwan and possibly the UK. Since the contamination in and around the damaged Fukushima nuclear plants has yet to be fully cleaned up, and likely won’t be cleaned up for many more decades, I am concerned about the prospect of foods produced and distributed from contaminated areas making their way onto store shelves everywhere with inaccurate labeling. While the emissions from the damaged Fukushima plants are not as great as they once were, I think it is still something to be wary of. Now, I think it is prudent to be careful with some imported foods regardless of labeling. I don’t necessarily stop consuming them entirely, but I do check them if I have concerns. If I can’t rely on the labels, I guess I will have to be a lot more concerned.
@Chase & vital1: Your words, Chase, put wind in our sails as they make us proud. The best work on this online news website is yet to come. We are nothing without you and folks like vital1. Thank you.
Imagine this: Look at the havoc our greedy plundering of the sub-atomic world has gotten us in just the last 100 years. One hundred years ago, Madame Curie was still convincing French officers in the trenches of World War I that her horse-drawn wagon, with a big boxy X-ray machine in it, could help save wounded Alliance soldiers. Now, she is long gone – dead from radiation poisoning – but her lab books are so radioactive with radium that they are kept under leaded glass away from the public. 100 years. Atomic bomb explosions, meltdowns, spills, ruined seas and land all in a failing effort to harness the power of the Sun when the Sun is already there. And so are we exposing this fatal folly.
HAZMAT in Canada on Wednesday, 08 April, 2015 at 03:09 (03:09 AM) UTC.
Extracts:
A search was carried out on Tuesday in Malbaie for what authorities believe were radioactive materials destined for export, the Canada Border Services Agency has announced.
A permit is required to export such dangerous materials, the CBSA noted. The investigation is still ongoing and the RCMP, the Canadian Nuclear Safety Commission and the Sûrete du Quebec were all present on the scene.
The substances were destined for export, but Roby would not indicate which country they were destined for.
Comment:
I get the impression that this is a more serious situation than authorities are letting on.
HAZMAT in Vietnam on Monday, 06 April, 2015 at 17:43 (05:43 PM) UTC.
Extract:
It remains a question why it took such a long time for the steel mill to notice the disappearance of the capsule, believed to contain highly radioactive cobalt-60. The province’s department of science and technology told the press on Monday that one can be exposed to radiation with the level of 2.5 millisieverts per hour when being about 10 centimeters from the Pomina 3 plant’s capsule. That level is alarmingly high considering the annual dose limit for general public is 1 millisievert.
Comment:
Read my post on scrap metal contamination below, to get a better idea of how much highly radioactive contaminated material is getting into scrap metal recycling system.
EnviroReporter.com is my #1 rad information site!
(No others even compare.)
The data and links contained in these archives and articles contain a lot more than just comments. The FACTS stand out.
I have actually went back and read from the beginning of this forum every comment at least once.
(took me a full day)
In my opinion Michael and Denise and other commenters here are not ‘preachers’ they are ‘teachers’. They share their knowledge freely and for that I thank them.
I have a feeling that someday, maybe soon(?), that this site will become an even greater asset to those who seek the knowledge of how we got here and why the illusion of ‘safe’ Nuclear Power was a scam/lie that has robbed the future of everyone’s clean air and water.
I wonder if future historians, if there are any, will call this the Age of Fallout or the Age of Suffering? Maybe both. 😥
I explain the basics to people who want to know more about the issues of Fukushima’s TRIPLE MELTDOWNS and the Nuclear Industry’s stranglehold on us all as best as I can. I can debate tactfully and verbally joust with best of ‘the experts’ now. Thanks mostly to the vast knowledge contained in these pages.
@Chase: Thank you so much. Yours is an excellent observation. Allow me to add to it. Beyond the X-ray levels of gamma these poor creatures are enduring, they breath in, and eat from, this despoiled water, ruined by the greed and hubris of man.
Please share with your friends at your favorite forum and beyond, Chase, as Buesselor’s now oft-repeated hooey just keeps coming unchallenged. RadNet Air Monitoring – April 7, 2015 Nationwide Radiation Report: https://www.enviroreporter.com/radnet-air-monitoring-data/-data/-data/
@Michael – Excellent reply to Ken Buesselor oceanographer. I hope he reads this along with millions of others.
We now know that a single X-ray can damage a human fetus.
So…
Imagine the ocean creatures, large and small, who are in it 24/7/365. That means that sea creatures are getting 4 times more radiation exposure per day than a human swimming for 6 hrs.
That means every 3 months they get an X-Ray or 4 per year.
Question:
I wonder how many X-rays it takes to dissolve a starfish? 🙁
(Just rolling with the X-ray compare.)
Better question:
How much Fuku-Goo does it take to dissolve a starfish or affect it’s immune system?
April 7, 2015
9:15 pm INT RAIN SAMPLE 4: 39.6 CPM^^
9:00 pm INT RSSMC: 37.2 CPM^^
6:20 pm INT RAIN SAMPLE 3: 40.0 CPM^^
5:30 pm INT RAIN SAMPLE 2: 45.4 CPM^^ which is 13.8% above background but within the Inspector Alert nuclear radiation monitor’s conservative +/-15% margin of error meaning the reading is BG. [Note that in all three rain samples, radon progeny/daughters do not impact the reading as there is none in this area.]
5:15 pm INT RAIN SAMPLE 1: 39.1 CPM^^
5:00 pm INT RSSMC: 39.9 CPM^^
While EnviroReporter.com‘s Spring investigations up the southern and central California coast, testing Pacific waters at multiple locations, yielded repeated samples reading at background, the April 6, 2015 edition of the Salem Oregon Statesman Journal newspaper reported that Fukushima radiation has reached North American shores much farther north off a dock in Victoria Island in British Columbia, Canada. While this unfortunate development isn’t surprising to any of the readers, viewers and listeners of EnviroReporter.com over the last four years, one quote from a self-proclaimed Fukushima radiation expert quoted in the article rang out loud and clear to us:
“Even if the levels were twice as high, you could still swim in the ocean for six hours every day for a year and receive a dose more than a thousand times less than a single dental X-ray,” said Woods Hole chemical oceanographer Ken Buesseler. “While that’s not zero, that’s a very low risk.”
Buesseler’s claim is patently false. The cesium-134 and cesium-137 in the Pacific water is not dangerous from its gamma radiation like the immense gamma blasts of “a single dental X-ray” because these beta-emitters can be swallowed when swimming in the ocean or ingested from marine life exposed to the radioactive ‘goo.’ Comparing swimming in an ocean with Fuku goo to a dental X-ray is ludicrous but easily slipped past most readers.
This reckless claim was made out of ignorance or something worse but to have this person repeatedly quoted in mainstream media saying this kind of misleading nonsense gives the reader, and especially the users of the Pacific, the less than true notion that everything is A-Okay. Unfortunately, reporters in this country are usually so inept at radiation science that Fuku hooey blown their way goes by unchallenged.
EnviroReporter.com actually knows its radiation so when we say there is no goo in the water we tested along the central and southern California coast – so far – you can trust it. We reported our results March 24 (which are followed here by our April 7 Nationwide Radiation Report).
March 24, 2015
Below are five different Pacific Ocean measurements that were taken between March 6 and March 21, 2015. From north to south, Carmel River State Beach to Topanga State Beach, is a distance of over 300 miles. Three samples from Topanga State Beach, Latigo Canyon beach and Sycamore Canyon Beach were tested wet from sampling towels dipped into the Pacific and then allowed to naturally dry over three days and retested. All six tests for these three sites came in at or below background. It is important to note that natural radiation in Pacific Ocean samples we tested did not register above background. This is crucial information as it will impact discussion of future Pacific Ocean tests at these sites that come in significantly over background. In other words, any future overages will not be able to be dismissed as the water’s “natural” radioactive content.
March 24, 2015
5:35 pm INT RSSM *DRY TOWEL* PACIFIC OCEAN SAMPLE drawn at Sycamore Canyon Beach at at 3:10 pm March 21: 43.8 CPM^^ (background)
5:20 pm INT RSSM *DRY TOWEL* PACIFIC OCEAN SAMPLE drawn at beach at bottom of Latigo Canyon at 2:30 pm March 21: 39.1 CPM^^ (background)
5:05 pm INT RSSM *DRY TOWEL* PACIFIC OCEAN SAMPLE drawn at Topanga State Beach at 2:00 pm March 21: 37.2 CPM^^ (background)
4:50 pm INT RADIATION STATION SANTA MONICA BACKGROUND (BG): 39.6 CPM^^
March 21, 2015
10:05 pm INT RSSM *WET* PACIFIC OCEAN SAMPLE drawn at Sycamore Canyon Beach at at 3:10 pm earlier in day: 43.2 CPM^^ (background)
9:50 pm INT RSSM *WET* PACIFIC OCEAN SAMPLE drawn at beach at bottom of Latigo Canyon at 2:30 pm earlier in day: 39.7 CPM^^ (background)
9:35 pm INT RSSM *WET* PACIFIC OCEAN SAMPLE drawn at Topanga State Beach at 2:00 pm earlier in day: 42.3 CPM^^ (background)
9:20 pm INT RADIATION STATION SANTA MONICA BACKGROUND (BG): 38.9 CPM^^
March 8, 2015
2:25 pm EXT Carmel River State Beach Pacific Ocean water: 55.3 CPM^
2:10 pm EXT Carmel River State Beach background: 64.7 CPM^^
Readings across the United States were not as encouraging as the results of EnviroReporter.com‘s Spring investigation up the California coast. It is important to remember the following when reviewing our April 7, 2015 report following:
Readings of 100 CPM or more indicate significant beta radiation activity. Three times background readings could mean a hazardous situation exists and protocols discussed and reported on in EnviroReporter.com since March 11, 2011 should be noted. See that below the tilde symbol (~) before some rad readings means mathematically approximate.
Maybe a malfunction, no stations near are indicating any increase in background level. Worth keeping and eye on to see if any other stations nearby increase.
This short animation of Northern, and Southern Hemisphere air circulation, shows why we can get detections so far south.
March 2015 Summary
There was an increase in the March month average background levels.
March 2015 monthly average background radiation level was 33% above the pre-Fukushima average.
March average for 2014 was 31% above the pre-Fukushima average.
March average for 2013 was 32% above the pre-Fukushima average.
March average for 2012 was 24% above the pre-Fukushima average.
Technical details:
Around the 19th March Earth had a G4 level geomagnetic storm, the largest Geomagnetic solar storm to hit Earth for a long time.
This proves that background here, near sea level, is not greatly influenced by solar storms. At least to a G4 solar storm level rating.
———————————-
From the station operator located near Cairns. Cairns on the east coast of Australia, is much closer to the equator than Caloundra.
“As you mentioned before, there was no noticeable influence on the readings, by the solar events we had during last month. Since the last cyclones, my readings here were quite flat and steady. That’s what I like to see….”
A comparison chart of Cairns (Red) and Caloundra (Yellow) background levels for March 2015.
Towards the end of March the background levels at Caloundra went through dynamic swings. This significant drop in background occurred during a rain event here. The 22nd March had 32.4mm of rain, and 23rd, 24.2 mm. Rain does not necessarily bring fallout with it. It depends what directions the surface wind and rain are coming from.
(Note: The 4yr average referred to in the charts, is the 4yr pre-Fukushima average.)
What the coloured alert levels, in the bar charts indicate.
Disclaimer: This is an amateur volunteer run service. Human error can provide incorrect information, and equipment malfunction can produce false readings. Do not rely on, or take action upon information presented here, without further research
Significant Past Incidents
At the Dijon conference the US Nuclear Regulatory Commission (NRC) reported that it is notified of about 200 lost or stolen radioactive sources each year and that since 1983 20 sources had been accidentally melted at steel works and other foundries. According to other sources, 65 meltings have occurred world-wide 9. IAEA says it is aware of 49 meltings world-wide at 1998:
…an increase of 40% within the last two years….This situation is aggravated by increasing amounts of scrap originating from decommissioning of nuclear reactors, weapons and submarines. As a result, radioactive materials entering the public domain in an uncontrolled manner are creating a serious risk of radiation exposure for workers and the public as well as excessive costs for plant decontamination and waste of product to be borne by the metal industry.
As of June 1997 the database maintained by the US Nuclear Regulatory Commission showed over 2300 reports of radioactive materials found in recycled metal scrap 10 (emphasis added)
Tip of an Iceberg?
In the US the NRC believe the 200 reports of lost, stolen or abandoned sources they receive each year probably represents the tip of the iceberg.
Comment:
You really need to read this article to get a clear idea how wide spread and large, the Radioactive Contaminated Scrap Metal issue is!
Title:
”Chernobyl nuclear power plant explode threat March 8, 2015”
“The Chernobyl nuclear power plant has daily lives in emergency mode, the station deployed additional forces of protection, law enforcement work. Nuclear club have brought not only over Ukraine.”
“Ukraine’s nuclear facilities headache the whole of Europe, constantly straining and Western and Russian citizen. A country that is on the verge of economic collapse, where a civil war, and illegal armed groups do not just roam with guns and tanks move on, nuclear facilities are transformed into a potential threat to regional scale. In Ukraine, a new round of nuclear blackmail.”
“State Inspectorate for Nuclear Regulation of Ukraine, translated into enhanced security mode, waiting for an attack on nuclear facilities – Chernobyl NPP and Zaporizhzhya.”
“On February 24, the SBU has received information that March 8, 2015 at the Chernobyl Nuclear Power Plant will be implemented explosion. Information came from an unknown person on the phone. Law enforcement agencies in Ukraine during the day tried hard to detect explosive device, but to no avail, the bomb was not found. However, the protection of the object has been strengthened, introduced a special permit regime.”
“In addition to the Chernobyl nuclear power plant, stronger version of the protection introduced and Zaporizhzhya, where just waiting for the attack. SBU traditionally full responsibility for the provocation imposes on pro-Russian terrorists.”
– translated via google
IMO – As long as these DNA destroying monstrosities exist we will always live with this fear. The really sad thing is, other ways, better ways of boiling water exist. Windmill farms or solar panels are not a target for terrorist threats nor do they require an evacuation zone or a long term radioactive contamination storage facility. 😉
Chernobyl exclusion zone shut down because of terrorist threat that came on February 24th, 2015.
I stumbled upon this while watching a new youtube user bionerd video.
I can find no other web search information regarding this.
*Translated via google translate.
“Yesterday, February 24, the SBU anonymous caller who said that on March 8, 2015 an explosion on a 3-unit of the Chernobyl nuclear power plant. This UNN to law enforcement.”
“According to security officials, in connection with a bomb threat reinforced checkpoint regime and increased protection of the object SSE “Chernobyl NPP”.
My maternal ancestors have lived in the Appalachian Mountains of Pennsylvania since the beginning of remembered time, carving out a living in the woods and drinking spring water. Those mountains are, to us, the family’s Garden of Eden. Back in 1975-1978, I would fly into and out of Washington, D.C. at least twice each month, and while looking out the airplane window, I would see the unmistakeably shaped stacks of Three Mile Island Nuclear Generating Plant. At the time, I would think about my long dead ancestors, and wonder how their spirits felt about this modern invasion of their woodland paradise.
Less than a year after I left for California, the “Three Mile Island Accident” occurred. At the time, there was little word on television or in the West Coast newspapers about what was occurring. I really did not have a clue, nor did my relatives still living in the sylvan paradise of rural Pennsylvania. Now, on the anniversary of the accident 36 years later, the world knows what has happened. A brief bullet point summary which appeared online:
If Michael Collins had written a 36th anniversary article, it would have had more meat, more heart, more outrage. But even with the bare bones outline, my heart is heavy because I was not smart enough, in 1979, to call my relatives and tell them to “Get the hell out”. But they are stubborn mountain people, and would not have left their land which is so bound up in their identity.
My children and grandchildren now live down wind of both San Onofre and Diablo Canyon. If an accident were to occur at either nuclear plant, they would have about 1 day to get out. I have told them “When it happens get out”, to flee to the Gulf Coast so we can figure out what to do over the long run. Will they listen? Probably not, given the stubbornness of the daughters-in-law. So the most precious lives of the grandchildren will be irreparably damaged, like the children in Ukraine and Japan, because their mothers will not want to leave the city where they have lived since childhood and because the deadly harm coming their way cannot be seen or heard.
An even more frightening prospect is “the government” not letting them get out. To understand “government think” in a nuclear crisis, some day read “Chernobyl Murders” a novel in English by Michael Beres, about the attempt of a pregnant nuclear plant worker to flee when her dosimeter went off, and the attempts of the Soviets to stop her from fleeing to relative safety.
As a thinking society, we are so much smarter than we were in 1979, when the Three Mile Island nuclear accident happened 36 years ago. Today, talk to your family and close friends about making an evacuation plan, and get them to intellectually and emotionally commit to leaving quickly. Think through what to do if the “way out” is blocked by traffic, or by “government officials” because their mindset is little different than that of the Soviets in 1986.
March 24, 2015
Below are five different Pacific Ocean measurements that were taken between March 6 and March 21, 2015. From north to south, Carmel River State Beach to Topanga State Beach, is a distance of over 300 miles. Three samples from Topanga State Beach, Latigo Canyon beach and Sycamore Canyon Beach were tested wet from sampling towels dipped into the Pacific and then allowed to naturally dry over three days and retested. All six tests for these three sites came in at or below background. It is important to note that natural radiation in Pacific Ocean samples we tested did not register above background. This is crucial information as it will impact discussion of future Pacific Ocean tests at these sites that come in significantly over background. In other words, any future overages will not be able to be dismissed as the water’s “natural” radioactive content.
March 24, 2015
5:35 pm INT RSSM *DRY TOWEL* PACIFIC OCEAN SAMPLE drawn at Sycamore Canyon Beach at at 3:10 pm March 21: 43.8 CPM^^ (background)
5:20 pm INT RSSM *DRY TOWEL* PACIFIC OCEAN SAMPLE drawn at beach at bottom of Latigo Canyon at 2:30 pm March 21: 39.1 CPM^^ (background)
5:05 pm INT RSSM *DRY TOWEL* PACIFIC OCEAN SAMPLE drawn at Topanga State Beach at 2:00 pm March 21: 37.2 CPM^^ (background)
4:50 pm INT RADIATION STATION SANTA MONICA BACKGROUND (BG): 39.6 CPM^^
March 21, 2015
10:05 pm INT RSSM *WET* PACIFIC OCEAN SAMPLE drawn at Sycamore Canyon Beach at at 3:10 pm earlier in day: 43.2 CPM^^ (background)
9:50 pm INT RSSM *WET* PACIFIC OCEAN SAMPLE drawn at beach at bottom of Latigo Canyon at 2:30 pm earlier in day: 39.7 CPM^^ (background)
9:35 pm INT RSSM *WET* PACIFIC OCEAN SAMPLE drawn at Topanga State Beach at 2:00 pm earlier in day: 42.3 CPM^^ (background)
9:20 pm INT RADIATION STATION SANTA MONICA BACKGROUND (BG): 38.9 CPM^^
March 8, 2015
2:25 pm EXT Carmel River State Beach Pacific Ocean water: 55.3 CPM^
2:10 pm EXT Carmel River State Beach background: 64.7 CPM^^
@vital1 et all: There is definitely a correlation between what a bunch of fracker North Dakotans are sitting on top of the huge Bakken “shale play” as it is referred to in a landmark 2013 Environment America report Fracking by the Numbers – Key Impacts of Dirty Drilling at the State and National Level. North Dakota, in the report’s latest numbers from 2012, was third in America, behind Colorado and Texas, with 1,713 fracking wells drilled that year. But it climbs to Number Two with Goo when it comes to wastewater generating a mind-boggling 1.2 billion gallons of radioactive wastewater in 2012.
That hot water has to go somewhere and now the North Dakota legislature has made sure that North Dakotans won’t know where or how much their land and groundwater is going get of this secret deadly goo. It’s clear that North Dakotans got exactly what they voted for as this decidedly ‘red’ (Republican Party) state isn’t about to let radioactive water ruin their cheap gas buzz. Future generations of North Dakotans may end up despising their ancestors for this grievous behavior but by then, it’ll be to late to do anything about it.
Frackie, I guarantee you, is delighted. The wastewater generated by her secret fracking chemical cocktails will remain just as secret, if not more.
18th March 2015 – Shield North Dakota from radiation, not information
Extracts:
Do Herald readers know that the North Dakota Legislature is about to pass legislation making virtually any information about radioactive materials and radioactive waste in North Dakota confidential?
The proposed rule changes by the Health Department would let the level of radioactivity disposed of in North Dakota increase by a factor of 10. It also would let this disposal take place in special industrial waste sites.
HAZMAT in Poland on Friday, 20 March, 2015 at 06:29 (06:29 AM) UTC.
Extract:
On the 6th of March 2015 total of 22 containers with Co-60 category 4 and 5 (activity between 40 MBq and 500 MBq on 2015-03-06) radioactive sources were stolen from a storehouse in Poznan. Aggregated activity of the stolen sources equals about 7 GBq. An investigation to determine the course of events and the current location of stolen sources is carried out by the police. :
Comment:
These are really hot items. I hope they track down, and recover these items soon.
20th March 2015 – Electronic scanners detected radioactive material in a shipment of sanitary pads at Rafik Hariri International Airport in Beirut.
Extracts:
The Lebanese Finance Ministry said the 30 crates of feminine hygiene products, weighing a total 1,221 pounds, were seized Friday at Rafik Hariri International Airport in Beirut after electronic scanners detected radioactivity in the shipment.
The discovery came amid a crackdown on radioactive goods being shipped into Lebanon. Officials said customs agents at the same airport detected radioactivity in a shipment of cellphone covers imported from China in February.
March 18, 2015
9:45 pm INT RSSM BG: 40.5 CPM^^
9:30 pm INT West Los Angeles Basin RAIN SAMPLE: 89.4 CPM^^ which is 2.2 TIMES BACKGROUND. Aberrent storm system came in over Radiation Station Santa Monica from the northeast, which was unusual. So is the significantly higher than normal reading.
I was sitting in the local coffee shop this morning when I read a National Geographic article about Superfund sites (like Hanford, WA) in the US.
I did not realize there are more than 1700 sites and that 95 sites are currently considered ‘out of control’. Only 360 are considered ‘cleaned up’ by the EPA. While more than 1160 are under construction.
This article shows some astonishing points and charts. Yet, as I read it, I see ‘blips’ of irrational logic.
Such as…
“No one talks about the dump anymore. …House prices are up again”, he said, “and most residents have stayed put”. His wife got breast cancer, but he doesn’t blame the landfill. He’s come to respect it since the EPA intervened: It’s so heavily managed that, unlike people in neighboring towns, he doesn’t worry about mudslides. – from article
“We don’t have any regrets,” Apostol said. “Where else can you go?” He could have moved, he admitted, but the commute from Montebello was too good. Living next to a waste site may not be ideal. But neither is bad traffic. – from article
Comparing toxic contamination to mudslides and freeway traffic is a clear misdirection. The resident not placing blame on the landfill causing his wife’s cancer also seems odd to me and probably very shortsighted. (What about future offspring?)
“Forty percent of Americans will be diagnosed with cancer during their lifetime, mainly the result of random errors in their DNA that arise as cells divide. As a risk factor, pollution in general ranks below smoking, obesity, diet, alcohol, and several viruses.” – from article
Maybe, if people could breath and swim they might not smoke, overeat or drink too much. Then, they could also build up their immune system to fight off viruses like we’re supposed to.
When I interviewed Sinn Féin president Gerry Adams for the Pasadena Weekly, I was accompanied by EnviroReporter.com‘s editor Denise Anne Duffield. I’d known Gerry since 1986 when I first interviewed him in Belfast in the six counties of northern Ireland. When it came time for photos, Gerry said “Put Denise between us – she’ll make us look better!”
Indeed, Gerry was right as the following photo attests.
Maniacs indeed, Chase. Why let simple facts get in the way of fatal assumptions? The only antidote to the blizzard of hooey that surrounds the industry is to look at the hard facts. That’s why EnviroReporter.com‘s 7,322+ special tests and reports count so much – You’ve got to be able to trust the numbers.
“Last year, 10.7 million bags of rice were checked for traces of contamination. Zero point zero per cent tested positive. To fulfil this task, Fukushima’s officials had to invent a machine which could mass-measure products for radiation, similar to a Geiger counter on a conveyor belt.”
That doesn’t sound very plausible to us considering, for example, vital1’s latest comment which says:
12th March 2015 – Hong Kong Finds Radioactive Contamination in Sample of Japanese Tea
Extract:
A sample of powdered tea imported from the Japanese prefecture of Chiba, just southeast of Tokyo, had 9.3 times the legal maximum level of radioactive cesium 137 allowed in food, the Hong Kong government announced late Thursday evening.
Those numbers add up but you won’t read that in the NZ Herald. According to the paper, there was zero radiation in tons of Fukushima rice but a place to the southeast of Tokyo, about 150 miles from the triple meltdowns, has tea hot enough to heat itself. Yes, Chase, that is maniacal.
Indeed, of the 7,322 tests and reports we count, this vital information wasn’t even included the hundreds of food tests vital1 details in our Radiation Food Lab!
These examples of pure ‘everything is okay’ baloney versus stellar radiation detection are part of the reason why we emphasize the numbers – how many detections, how many of what and how much radiation.
March 13, 2015
WIPP Begins Underground Decontamination Activities
“Activities are underway in WIPP’s underground facility to address the radioactive contamination that remains as a result of the February 14, 2014 event. Employees are using a MODIFIED piece of agricultural spraying equipment that allows them to apply a fine water mist to the walls and floor. The water dissolves the salt and washes it down to the floor. When the salt recrystallizes, it encapsulates the contamination and prevents any re-suspension of radioactive particles.”
“Employees performing these tasks are taking all necessary precautions, including wearing appropriate personal protective equipment.”
“Recovery Plan outlines the necessary steps to resume LIMITED waste disposal operations in the first quarter of calendar year 2016.”
“Key elements of the recovery plan include strengthening safety programs, regulatory compliance, decontamination of the underground, increasing ventilation, mine stability and underground habitability, and additional workforce retraining. Additionally, findings and recommendations from the investigations of both the truck fire and the radiological release will be incorporated into WIPP actions moving forward.”
So… it’s obvious that the experts never planned for even a single canister accident in the first place.
It’s almost funny to me that they state that the findings of the radiological release will be incorporated into WIPP actions ‘moving forward’. I am guessing, but the findings will be ‘they don’t have a clue’ and the recommendation will be, to close the door. I wonder how much it cost to determine that? 🙄
One canister takes out a facility for over 2 years. Is it just me or is every nook and cranny of the Nuclear Industry a money sucking machine controlled by maniacs? 😐
March 15, 2015: Since exactly four years ago on March 15, 2011, just four days after the triple meltdowns at Fukushimi Dai-ichi Japan began, EnviroReporter.com has produced more than 7,322 special tests and original reports including 2,819 measurements and analyses from nine affiliated Radiation Stations and 4,503 samples and radiation experiments from Radiation Station Santa Monica California. EnviroReporter.com has over 1,890,968 readers and 1,572,073 viewers along with the 21,130 people who have seen Radiation Station Glendale California‘s continuous online streaming. Over 190,172 viewers have watched 90 original videos on our YouTube channel and we’ve received tens of thousands of Facebook ‘likes’ for our site, investigations and Facebook channel. Thank you for your support as we celebrate these milestones on the Ides of March.
We marked the fourth anniversary by wrapping up an investigative run up the central coast of California as part of three different investigations including Diablo Canyon and the Sea of Fuku Goo let loose by the triple meltdowns. Negative Pacific Ocean water radiation findings near Morro Bay and just south of Carmel. This area encompasses Big Sur. Last year we showed in Fukushima – The Perfect Crime? that there were indications of this goo as far south as Santa Cruz Bay up the coast from Carmel. This is welcome news. So was the fact that none of the food we tested show heightened radiation as we document in Eat Me!
Last year we also showed the abysmal state of media coverage of Fukushima and we’re delighted today to see a good piece in the Los Angeles Times, of all places, about the unhinged multi-billion “cleanup” going on in Fukushima today. We’d like to think the paper was influenced by our coverage to kick with it and sure enough they have.
They say: The truth isn’t always black or white….but what if it was, and you still couldn’t tell?
As we mark the fourth anniversary of the ongoing nuclear disaster at Fukushima, we reflect on the Japanese government’s final verdict: The tragedy was a product of collusion and lack of transparency by the nuclear industry and its regulators. We ask, “could that happen here?”
One of the lessons of Fukushima has long been lost on the American people, especially those in Southern California, is that it can happen here, especially in earthquake country. Now with fracking nearly coast to coast, the entire nation is turning into earthquake country.
Note that the following numbers of our reporting foray include our latest HEPA filter tests which show Los Angeles air surging even higher in beta radiation than in the previous period tested:
March 11, 2015
5:00 pm INT HEPA DUST from two HEPA filters, one Ionizer/HEPA filter from February 7, 2015 to today, or 33 days total: 176.9 CPM^^ which is 3.9 TIMES BACKGROUND HIGHER.
4:30 pm INT BG: 45.5 CPM^^
March 8, 2015
2:25 pm EXT Carmel River State Beach Pacific Ocean water: 55.3 CPM^
2:10 pm EXT Carmel River State Beach background: 64.7 CPM^^
Bubble of Fear: Surreal Photo Series Highlights Fukushima
“… a jarring reminder that all is not well in Fukushima. French photographers Carlos Ayesta and Guillame Bression (collaborating as Trois 8) present ‘Bad Dreams?’, a series of photographs calling attention to the eerie continued desolation of the Fukushima Daiichi power plant and surrounding areas that were contaminated with radiation following the earthquake, tsunami and nuclear disaster of 2011.”
March 7, 2015 – Estimation of Radionuclides in Sand and Soil Samples in the United States
Extract:
The 2012-2013 soil study consisted of 48 samples, 22 Cs137 detections, 6 of which (or 12.5%) had Cs137 activity ranging from 4.9 – 19.1 Bq/kg with Cs134 activity ranging from 3.4 – 5.8 Bq/kg. The Cs134/137 ratio ranged from 0.27-0.84 with an average of 0.49 and a median of 0.52. This 2014 study consists of 60 samples, 30 Cs137 detections, 10 of which (or 16.7%) had Cs137 activity ranging from 5.7 – 10.2 Bq/kg with Cs134 activity ranging from 1.2 – 3.4 Bq/kg. The Cs134/137 ratio ranged from from 0.21-0.46 with an average of 0.34 and a median of 0.3.
Comment:
This would have to be one of the largest privately conducted, publicly available radiological surveys, I have seen conducted in the USA since Fukushima.
This more than just a survey of Cesium, it also includes the Uranium and Actinium Series, Thorium Series, Neptunium Series, Cobalt-60 and more.
7th March 2015 – Discovery of radioactive tritium in snow and ice outside a Hope Creek building at levels 500 times higher than federal water quality standards.
Extract:
The latest cold snap has delivered a troubling surprise at PSEG Nuclear’s Salem/Hope Creek reactor complex: Discovery of radioactive tritium in snow and ice outside a Hope Creek building at levels 500 times higher than federal water quality standards. At an estimated 10 million picocuries per liter in a confined area, it was the second-highest concentration reported in any tritium leak and pollution incident nationwide.
This short animation of Northern, and Southern Hemisphere air circulation, shows why we can get detections so far south.
February 2015 Background Summary
Pretty much the same as last month. We see a drop in the month average background level for February 2015, and the rain water test shows manly Beryllium Be-7, and Lead Pb-210. The traces Iodine I-129 and Uranium U-235 showing up in the previous years rain water tests, are now below the reliable detection levels of the equipment here.
The good news is that background levels here have stabilized, at least at this location in the Southern Hemisphere. I still detect the occasional event. These detection events are generally not as large, or as frequent as previous years.
February 2015 monthly average background radiation level was 30% above the pre-Fukushima average.
February average for 2014 was 40% above the pre-Fukushima average.
February average for 2013 was 39% above the pre-Fukushima average.
February average for 2012 was 37% above the pre-Fukushima average.
Technical details:
(Note: The 4yr average referred to in the charts, is the 4yr pre-Fukushima
average.)
What the coloured alert levels, in the bar charts indicate.
Beryllium Be-7 can be made by spallation in the upper atmosphere, during solar events, and takes around two weeks to reach the surface. Lead Pb-210 is a decay daughter of Radon Rn-222. Both these isotopes can also be released from a
Nuclear accident.
Roof down pipe filter design for rain water testing.
Rain Filter Test Chart (The chart is minus background.)
In this chart I have CPS on the Y axis to show activity, and have turned off Y log to show linear scaling. This is only a test chart of the polyester part of the rain water filter system design. The Polyester filter actually captured more than the carbon filter.
Glendale rain activity measures near normal March 2nd, 2015
44.2 CPM sample from brief but intense shower
40.2 CPM background
Even though the rain shower was briefly intense and produced 1/8″ of rain in about 30 minutes, there was no thunderstorm activity. The radiation measurement was only about 10% above background, well withing normal variation of background levels. This is good news!
23th February 2015 report from a contact located near Cairns, in North Queensland Australia.
“I had the alarms set at 0.400 uSv nearly going continuously from about 13:00 till about 17:00 with peaks close to 0.700 uSv. We had a local thunderstorm around 16:30 with about 4mm of rain.
The rain seemed to have replaced the lower air, with air from higher altitudes and stopped the frequency of the alarms to close to zero after 18:00.The readings are still well above of what I have recorded as background before, which was around the 0.130 uSv level for the recent months without any events. The daily average increased again to 0.177 uSv. Keep watching, how it develops further.”
Here is a chart comparing February day background averages of Caloundra (yellow) and near Cairns (red) Queensland Australia. Ignore the red line peak at the beginning of the February, as the Cairns Geiger counter was being used to test an imported food item at the time. The monitoring station near Cairns is a lot closer to the tropics, than the Caloundra Queensland monitoring station.
Two cyclones hit Northern Australia at that time, and it is suggested that these weather events created this uptick in background detections.
Comparison chart, (Thanks to the Cairn’s monitoring station operator for creating this chart.)
March 1, 2015
2:45 pm INT RSSMC BG: 42.3 CPM^^
2:30 pm INT RSSMC rain sample: 48.6 CPM^^ or 14.9% above subsequent background which is within the Inspector nuclear radiation monitor’s +/- 15% conservative margin of error.
11:15 am INT RSSMC BG: 41.0 CPM^^
11:00 am INT RSSMC rain sample: 42.3 CPM^^ or background with no radon daughters per usual.
February 28, 2015
9:15 pm INT RSSMC RAIN SAMPLE: 40.9 CPM^^ or background and once again showing Santa Monica rain is not impacted by radon progeny.
8:50 pm INT RSSMC BG: 40.6 CPM^^
February 22, 2015
12:05 pm INT RSSMC BG: 41.0 CPM^^
11:40 am INT RSSMC RAIN SAMPLE: 50.4 CPM^^ or 22.9% above subsequent background
Here’s an IAEA video about Fukushima’s decommissioning.
Juan Carlos Lentijo, Director of the IAEA Division of Nuclear Fuel Cycle and Waste Technology speaking.
Fukushima Decommissioning Mission:
A Report from the Team Leader
Published on Feb 17, 2015 3 min
My general observations:
Maybe I look at things differently, but when I watch this video I noticed…
1. The heavy lead suits worn by the workers.
2. The lack of ‘eye protection’ in many cases.
3. Almost no females involved in these groups.
4. Everybody looks over the age of 50.
5. None of the TEPCO workers are smiling.
Video states that are 70 new Nuclear Reactors planned. 🙁
Personally I don’t think ‘decommissioning’ is a good word to describe what is occurring around the ongoing TRIPLE MELTDOWNS. I am not sure what word could even come close to describing it. (?) I don’t think there is a word that covers working in a man made Hell. 😐
@vital1: I heartily concur. According to the “Prepared Remarks of NRC Chairman Stephen G. Burns, Platts 11th Annual Nuclear Energy Conference, February 17, 2015 – Washington, D.C.,” sent to us by the U.S. Nuclear Regulatory Commission, the NRC is going to do even less than it has already.
Even though the NRC is overseeing five new reactors being built, “the NRC is being scrutinized by its stakeholders for its responsible use of resources,” according to Burns. That means the nuclear power industry wants the NRC to pare back its already woeful oversight of America’s aging and increasingly dangerous reactors.
“The agency’s FY 2016 proposed budget reflects the NRC’s efforts to demonstrate its responsiveness to the new context in which we find ourselves,” Burns said of the NRC happily caving in. “The proffered budget reflects a proposed reduction of 140 full time equivalent employees, and a reduction of $27.3 million from the FY 2015 submission. I also expect that the NRC’s FY 2015 fee rule, which will be published in the coming months, will reflect a reduction in licensee annual and hourly fees that are a result of decreases to account for lower than anticipated staffing needs.”
Burns bragged of “right-sizing the agency” and “streamlining” it which just must make those government-subsidized atomic titans of industry rub their gooey hands together with joy. Craven, outrageous and criminal does not begin to describe what added dangers this potentially puts us in.
Feeling safer, America? Or should I put that ‘the world’ as what melts down goes around the globe as Fukushima readily shows.
In my opinion Industry self regulation doesn’t work. There is to much self interest to take short cuts to save money. The regulator gets squeezed to cut costs, which means public and worker safety are placed at risk. I have seen this so many times across multiple industries.
The problem with the Nuclear industry is one major accident can contaminate half a country, and leave its land and water contaminated for centuries!
Do cyclones draw Fukushima radioactive air contamination through the equatorial barrier, into the Southern Hemisphere?
Caloundra (Queensland Australia) 22th February 2015 – The remnants of Tropical Cyclone Marcia came and went, the day average background here actually dropped then rose.
The dip in the day average occurred a day before the degraded Cyclone Marcia was closest to here. We had around 330 mm rain over a few days. This suggests whatever was in the air was being washed out.
Geiger counter testing of a car bonnet rain swab collected on the 20th, 630 cpm or ~1.0 uSv/hr. Not nearly as high as other rain event tests.
When placed in the scintillator there was very little Radon-222 present, again not nearly as high as previous rain swab tests. The rain swab is also not showing any significant Be-7 or Pb-210, as recent rain test have shown. Radon levels were low averaging around ~ 0.5 pCi/l over that period. As the tail of Cyclone Marcia left the area we had a wave of radiation pass through. Haven’t seen this type of radioactive cloud stand out event since late 2011, 2012, and 2013.
(Caloundra is in Southern Queensland and Cairns is in Northern Queensland Australia.)
Report from a contact near Cairns in North Queensland, 20th February 2015
“I would like to report an unusual event yesterday. Yesterday 20. Feb 15 between 17:00 and 18:00 the alarm set at 0.400 uSv on my Gamma Scout kept sounding continuously. The daily average reading after midnight was 0.167 uSv, a value, that I have never had that high since I started using the instrument about a year ago. As per this morning, the readings still persist around the 0.150 to 0.160 uSv mark. There does not appear to have been any serious solar events. The weather here has been sunny, up to 33 C hot and humid.”
Category 4 cyclone Lam also hit the Northern Territory of Australia, as category 5 Tropical Cyclone Marcia hit Queensland Australia. For two cyclones to hit Australia at the same time is very unusual.
I wonder what it must be like to work for the NRC. I can imagine a TYPICAL EVENING going home to the wife and kids and giving the lowdown on what happened at work that day.
“Yes, honey… I assisted in stopping a Nuclear Core Meltdown today that may have saved every living thing on the planet from having it’s DNA damaged. Only a ‘tiny’ amount of radiation was released, we averaged out the RISK so it was low enough for Federal standards to be met yet again. I am hoping for an even better day tomorrow. I feel Nuclear Power is now even safer knowing we have chainsaws and axes at the ready too… don’t you? Could you be so kind as to bring me a glass of wine dear, oh… just bring the whole bottle.”
– NRC worker (anonymous)
@vital1 et al: What would be the new chairman of the U.S. Nuclear Regulatory’s take on all this be? Look at a couple of snips from what NRC Chairman Stephen G. Burns Platts said at the 11th Annual Nuclear Energy Conference February 17, 2015 in Washington, D.C.
“The agency’s FY 2016 proposed budget reflects the NRC’s efforts to demonstrate its responsiveness to the new context in which we find ourselves,” said Burns. “The proffered budget reflects a proposed reduction of 140 full time equivalent employees, and a reduction of $27.3 million from the FY 2015 submission.”
So increased challenges means cut the NRC by 140 positions? Wow. They aren’t paid for by the taxpayer but by the nuke power industry, folks.
“Although the agency’s workload in many areas is getting smaller, I would be remiss if I did not mention that the agency and industry have expended a significant amount of effort to address the lessons learned from the accident in Japan,” Burns continued. “For instance, I recently visited the North Anna nuclear plant in Virginia, and focused on looking at that licensee’s post-Fukushima modifications, particularly those designed to address beyond-design-basis accidents. I thought it remarkable the level of planning that has gone into considering what might go wrong, from the color coding of emergency electrical connections, to the stockpiling of extra equipment, and even the acquisition of axes and chainsaws to remove debris that might hamper plant staff in responding to plant conditions.” [Our emphasis]
That’s it then, folks! Reduce staff hugely and get those axes and chainsaws handy. This is your NRC. Feeling safer?
18th February 2015 – More cracks found in Belgian nuclear reactors
Extracts:
“What we are seeing in Belgium is potentially devastating for nuclear reactors globally due to the increased risk of a catastrophic failure. Nuclear regulators worldwide must require reactor inspections as soon as possible, and no later than the next scheduled maintenance shutdown. If damage is discovered, the reactors must remain shut down until and unless safety and pressure vessel integrity can be guaranteed. The nuclear industry, already in crisis, is faced with an ageing nuclear reactor fleet at increasing risk of severe disaster.”
In reaction to the findings, the Director-General of the Belgian nuclear regulator of the Federal Agency for Nuclear Control (FANC), Jan Bens, has said that this could be a problem for the entire nuclear industry globally. He added that the solution is to begin the careful inspection of 430 nuclear power plants worldwide [1].
2012 – Large list of nuclear accidents, “Let The Facts Speak, An Indictment Of The Nuclear Industry.”
Extracts:
“In introducing a document of this kind, the first thing to note is that the text speaks for itself. This is not a work of analysis or opinion, but a straightforward chronology of accident, incompetence and disaster spanning seven decades.”
“We owe a debt of gratitude to all those who have documented the accidents and crimes committed within these pages, those who came before, took a hard look at the reality of the nuclear industry, and chose not to look away.”
Comment:
Thanks to Australian Greens Senator for Western Australia Fremantle, and his researchers for updating this large list of nuclear accidents. Also thanks to Kevin Blanch for pointing to this document, in one of his recent Youtube videos.
9th February 2015 – State Finds Radioactive Material In Vermont Yankee Groundwater
Extracts:
The Vermont Health Department says for the first time it has found the radioactive isotope Strontium-90 in ground water at the Vermont Yankee nuclear plant in Vernon.
“This is more or less not surprising for a nuclear plant that’s operated for 42 years, not surprising given the fact that there have been leaks and Strontium found in the soil,” he said.
On 2/1/2015 I detected hot rain in Glendale, CA, along with a similar detection by Michael Collins in Santa Monica, CA. Our two locations are separated by about 15 miles. My reading of 121 CPM rain was surprising since I had not seen anthing this active in our area for some time. I wondered if this was just a fluke, or was something different happening now. I commented how surprising the storm was since it moved in quickly, and was even accompanied by lightning. However, 3.3 times background was even more surprising once Michael and I had checked our samples.
Unfortunately, we don’t see a lot of rain in the Los Angeles area during the ongoing California drought. However, I was traveling to the San Francisco area this past weekend and had an opportunity to check the rain in Union City, CA. Union City is located in the San Francisco Bay area about 350 miles NW of Los Angeles.
There were two storms in the Bay area last weekend. I was a little late arriving to the Bay area on Saturday and I did not sample the first storm. Sunday morning at 9:00 AM, I sampled the second storm which was moving very rapidly and was accompanied by 45 mph winds. It was heavy rainfall at 7:00 AM, and at 9:00 AM it was easing quite a bit so I took two samples which were slightly active, measuring 43.3 CPM, and 42.9 CPM compared to background radiation at 29.3 CPM. Later in the day there was clearing followed by a light shower. I took another sample at 3:00 PM and found that it was right at background, 28.0 CPM.
I’m thinking that the more vigorous the storm, the more vertical mixing there is in the atmosphere. Strong updrafts and downdrafts may be bringing radidoactive particles down from higher aloft where the can be washed out to the ground by the rain. It’s a just a theory, but what we really need to know is, where is it coming from and what, exactly, are the radioactive particles involved. I doubt they are radon daughters, since these storms sweep in from the Pacific. Santa Monica in particular is literally right on the coast, Union City, too, is right off San Francisco Bay, and the wind and rain had been moving in rapidly for hours before I took my samples.
‘Liquidators and workers insist [it is] nothing serious but just to be on the safe side it is not recommended to open doors and windows and to stay outside for long.’
The pre-Fukushima four year recorded average here was ~ 0.1 uSv/hour. The recorded low background levels have allowed the detection of any changes in background levels since Fukushima.
The GammaScouter Geiger counter 2007 to 2011 data recording was once a week from 2007 to early 2011. It doesn’t show much seasonal variation. Statistically the 2007 to 2011 data is not as accurate as the GammaScout recorded 2012 to 2015 data, as it is now recording local background levels every 60 seconds.
Pre-Fukushima 2007 to 2011 local background level chart.
The peak in the pre-Fukushima background level chart around September 2008 was probably an experiment being carried out at the time.
After Fukushima a seasonal variation showed up in the year average charts. Northerly winds tend to come from the equator in the warmer months. In the cooler months, it tends to come from the Southern Ocean. The station location is on a headland, so there can be significant changes in background levels as the wind changes from North to South.
After you average out the season differences here, the yearly increase since Fukushima has averaged around 21%.
The 2012 year average was 21% above the pre-Fukushima 4 year average.
It showed significant waves coming through. When it was from a Northerly direction, background went up. When wind direction was from the Southern Ocean, background tended to go down.
Now the increases showing on the 24 hour charts are much more averaged, and no where near as dynamic. This suggests that what ever was in the air in 2011 and 2012 that crossed the equatorial barrier, has had time become more evenly distributed into the southern hemisphere air mass.
It would be nice if other locations had pre and post Fukushima long term publicly available background data. This would
make a lot easier to see accurately what is happening worldwide.
As radiation fallout does not fall evenly, there will be areas that have seen significant background increases, and other areas that only seen small increases.
The sccc charts for the location in the Southern Hemisphere are saying that ‘basically’ you’ve been at 40% or greater from pre-fuku background for the fourth consecutive year.
Common sense would suggest that the Northern Hemisphere must be much higher. And certain parts, like the west coast from Alaska to Mexico, should be even higher yet.
Are there any data charts anywhere that would accurately and clearly show our [USA] average background increase?
Known FACT: It has increased because of ongoing TRIPLE NUCLEAR PLANT MELTDOWNS.
Unknown: By ‘how much’?
Are we, or have we, been getting a consistent low dose or ‘uh oh’ doses of radioactive contamination? …or both?
IMO – Both!
__________
Side note:
A general observation, but perhaps worth noting for historical purposes. Over the last 2 weeks I have met 6 people who have within the last 4 years had THYROID nodules or issues. Only 1 was over 50. That seemed VERY odd to me. Many people do not speak of their medical issues. How many more are there hiding in a radioactive thyroid closet? Is it here and even though we see it in front of us we still all hang on to the notion that ‘this just can’t be true’?
Southern Hemisphere January 2015 Rain Water Test Report
Summary:
As you can see there was more Beryllium Be-7 detected than Lead Pb-210 this month. January rainfall was 149.2 mm.
Beryllium Be-7 can be made by spallation in the upper atmosphere, during solar events, and takes around two weeks to reach the surface. Lead Pb-210 is a decay daughter of Radon Rn-222. Both these isotopes can also be released from a Nuclear accident.
My view is that because of the upper atmosphere damage caused by the Fukushima nuclear catastrophe, and a weaker magnetosphere, smaller solar events are now having a greater impact on the Earth’s upper atmosphere. This is a possible explanation for the increased Beryllium-7 detections in rain water washouts here.
I have provided two test charts, one is the normal minus background. The other uses a new SuperDeconvoluzione feature in Theremino 6.7 that provides results that are very similar to those obtained with the expensive high purity Germanium detectors.
Rain Filter Test Chart (The chart is minus background.)
In this chart I have CPS on the Y axis to show activity, and have turned off Y log to show linear scaling. This is only a test chart of the polyester part of the rain water filter system design.
Disclaimer: This is an amateur volunteer run service. Human error can provide incorrect information, and equipment malfunction can produce false readings. Do not rely on, or take action upon information presented here, without further research.
@vital1: Excellent report showing how much hotter things have gotten in the Southern Hemisphere, in the most ancient land on Earth, Australia. Your reports and authoritative and essential Radiation Food Lab on EnviroReporter.com make us all richer in knowledge, knowledge that can protect lives. Thank you.
@All: More number crunching but at least today’s rain in the western Los Angeles Basin seems cool for radiation, unlike the last storm:
February 7, 2015
5:00 pm Jan. 30 RSSMC INT RAIN SAMPLE #2: 41.1 CPM^^ over a ten minute average.
4:30 pm INT WEST LOS ANGELES BASIN RAIN SAMPLE: 45.3 CPM^^ or 7.1% above background which is less than the Inspector’s +/-15% conservative margin of accuracy meaning this rain contained no additional radiation. It also demonstrates how, as always, radon progeny/daughters do not impact readings at Radiation Station Santa Monica CA.
4:20 pm INT BG: 42.3 CPM^^
1:30 pm INT HEPA DUST from two HEPA filters, one Ionizer/HEPA filter from January 10, 2015 to today, or 28 days total: 116.8 CPM^^ which is 2.8 TIMES BACKGROUND HIGHER.
1:15 pm INT BG: 41.5 CPM^^
This short animation of Northern, and Southern Hemisphere air circulation, shows why we can get detections so far south.
January 2015 Summary
There as been a small decrease in January background. This is good news, and means that background levels are not increasing at present, and have stabilized. At least at this location in the Southern Hemisphere.
January 2015 monthly average background radiation level was 40% above the pre-Fukushima average.
January average for 2014 was 41% above the pre-Fukushima average.
January average for 2013 was 52% above the pre-Fukushima average.
January average for 2012 was 43% above the pre-Fukushima average.
Technical details:
(Note: The 4yr average referred to in the charts, is the 4yr pre-Fukushima average.)
On the 26th January 2015 it was 80% above pre-Fukushima average levels on the 26th January. This put the monitoring station into it’s second alert level. It was a hot, humid, fine day.
What the coloured alert levels, in the bar charts indicate.
The system that brought hot rain to Southern California January 30, covered in High radiation detected in L.A. rain, chugged east through the American southwest and southeastward over Mexico.
Dale Ramicone of Radiation Station Glendale California had virtually the same amount of beta-emitting radiation in his rain sample, 3.2 times background coming in at 121.2 Counts Per Minute (CPM) that we did at Radiation Station Santa Monica California. Our results were 3.3 times background at 131.7 CPM.
We noticed several interesting phenomena with the storm’s advance over Arizona. During the rains, beta radiation levels in Phoenix and Tuscon actually went down. This may be due to the fact that the storm system could have washed out the high airborne radiation while it was raining. The EPA RadNet stations are air sensors, after all, and seemed to pick up less beta during the precipitation.
The object of our attention is beta radiation. Once again, several significant beta stations have gone offline while a couple of crucial ones are sputtering to life.
Readings of 100 CPM or more indicate significant beta radiation activity. Three times background readings could mean a hazardous situation exists and protocols discussed and reported on in EnviroReporter.com since March 11, 2011 should be noted. See that below the tilde symbol (~) before some rad readings means mathematically approximate.
Since November 23, 2014 (below in archives), Montgomery AL hit ~170 CPM December 16 but has settled down around 50 CPM in the last few days; Anchorage AK also hit a four month high reaching ~165 CPM December 13 which is the first time it has reached that dubious milestone since EnviroReporter.com began tracking its beta radiation totals in this increasingly active area; Fairbanks AK also hit a four-month high inching past the previous ~245 CPM October 31, topping ~255 CPM Christmas Day 2014; Phoenix AZ in the Grand Canyon State is getting hammered with beta rads and hit a four-month high November 27 with ~735 CPM; Tuscon AZ, which nearly topped 450 CPM October 31 also hit the beta jackpot November 27 with a solid 700 CPM in an area where folks move to breath the clean and dry desert air; Little Rock AR has been settling down and hovered just under 100 CPM February 1; Fort Smith AR hit 250 CPM December 1; Anaheim CA‘s beta graph started working August 7 then went dead completely August 15, and now has been back since November 25 showing three 300 CPM days in this latest period; Fresno CA smashed through previous highs hitting ~970 CPM November 11 and then the graph died December 2 leaving a huge hole in California airborne beta monitoring; Bakersfield CA has gone off the charts – in excess of 1,000 CPM – half a dozen times in early to mid-November, and then blazed though 1,000 CPM again in this latest period seven times; Los Angeles CA‘s beta graph stopped in March 2014 but the gamma seemed quite jumpy in late December through mid-January 2015. A January 10 RSSMC triple HEPA filter debris test found hot dust coming in at 10.1 times background; Riverside CA‘s graph gave out September 15 after repeatedly slamming through the ‘Oh NO!’ threshold of 250 CPM and has stayed out leaving Southern California in the dark about a basic need-to-know environmental concern; San Bernardino County CA hit a four month high of ~345 CPM January 21; San Diego no longer has a working beta graph because it died January 15 after months of erratic fits and starts; Hartford CT is back to humming along at low numbers with ~22 CPM February 1; Washington DC was just ~35 CPM yesterday but hit 150 CPM twice December 17 and 26; still not one beta monitor out of five works in Florida which is why EnviroReporter.com editor Denise Anne Duffield and I don’t buy Sunshine State citrus; Augusta GA no longer has a working beta graph in a very active environment, unfortunately, giving out August 25, 2014 never to return; Ft. Wayne IN has exceeded 200 CPM twice for this reporting period which is actually an improvement; Baton Rouge LA‘s four-month high was hit November 10-11 with ~290 CPM but it has settled down registering ~35 CPM February 1; Orono ME is the farthest functioning beta station away from the triple meltdowns at Fukushima Dai-ichi, Japan, and this lovely town has the lowest readings sometimes down into the single digits for days at a time; Baltimore MD‘s beta and gamma graphs are now ‘on’ and functioning properly which is great news and shows that the New Year is getting busy with four days over 100 CPM; Worcester MA blew through ~320 CPM September 28 and has spiked three times in November over 200 CPM and then its beta station died December 9 and then briefly be reborn Christmas Day only to die, for good, the next day; Grand Rapids MI got up to ~315 CPM December 1; St. Paul MN was blowing through 300-350 CPM regularly before its beta station died October 16 not to return in a place where beta has soared since the triple meltdowns began according EnviroReporter.com’s extensive archive of beta readings for this important upper Midwest center; St. Louis tested ~310 CPM December 16, a four month high; Lincoln NE hit a four-month high January 3 soaring to ~460 CPM; Concord NH hit ~195 CPM December 17; Albuquerque NM also hit a four-month high December 17 with a whopping ~860 CPM; Buffalo NY tested at ~210 CPM November 18 and jumped around going over 100 CPM half a dozen times in the latest period; New York City NY is not functioning as it hasn’t for years but its gamma gross count is sort of jumping around like LA’s gamma is – just one difference, NYC’s gamma is much more active which is one thing New Yorkers can brag about: they’re hotter than Los Angelenos; Syracuse NY showed ~160 CPM November 26 and then the beta graph died December 1; Charlotte NC topped 220 CPM Christmas Eve bringing with it the gift of a four month high though the graph died January 13 so who knows now; Raleigh NC hit ~170 CPM July 24 and cut out and still hasn’t come back on, a real loss in the South but we do have Radiation Station Harrisburg North Carolina for occasional rain radiation tests including one November 17 which showed hot rain radiating at 9.9 times background; holy Toledo OH was ~210 CPM December 17; Corvalis OR is trending higher in 2015 with ~205 CPM January 9Pittsburgh PA was ~215 CPM December 16; Puerto Rico‘s beta graph doesn’t work but the gamma remains low and steady; Amarillo TX hit 1,000 CPM January 7 and 15 at one of the hottest sites in the country for reasons not fully understood; Dallas TX goes Texas-big topping 350 CPM twice in the period before the monitor mysteriously began registering in the single digits January 20 until now; Ft. Worth hit a four month high with 360 CPM January 20; Salt Lake City UT‘s beta station is still down since a huge beta increase over 200 CPM in early May 2014 and remains offline in a state that could use the now-available Mitt Romney’s guiding hand to get that beta station up and atom; and Madison WI hit a four-month high November 25 charting ~460 CPM and was only ~40 CPM February 1.
@Chase: Excellent observations from someone who really knows what he’s talking about. Our hot Los Angeles rain was tested, videotaped and written about in a new post soon to go up later today. Don’t miss it, Chase and fellow raddies.
When I see a significantly higher reading, like EnviroReporter.com #2 rain sample Jan 30, I usually go back about 5 days to see what was happening on the Fukushima webcam live recording.
When I took a look to the morning videos for the 25th of January webcam archives on youtube, I find several recordings that have been ‘clipped’ short. (?) To me this is usually an indication that issues were happening that ‘they’ don’t want anyone to see. Sometimes people record there observations as they see it, knowing that the archive footage may disappear. Normally the archive recording is compressed at 20x speed to be 1 hour in 3 minutes.
😐 – ONLY 7 seconds here, but it’s obvious things are not going well.
Morning January 25th
yt user – Fuku1live
2015.01.25 09:00-10:00 jst
January 30, 2015
4:00 pm: RSSMC INT RAIN SAMPLE #2: 131.7 CPM^^ which is 3.3 times BACKGROUND which is HAZARDOUS. As previously reported, California Highway Patrol considers anything over 3 times background to be a tripwire for a HazMat (hazardous materials) situation necessitating appropriate protective protocols. Keep children and pregnant women from directly being exposed to this rain shower. Wet clothes should be taken off once at home and washed normally. This is the first really hot rain in Los Angeles in a while. Act appropriately.
3:40 pm: RSSMC INT RAIN SAMPLE: 107.7 CPM^^ which is 2.7 times BACKGROUND. Radiation Station Santa Monica California is not impacted by radon progeny/daughters as we have noted, shown and proved multiple times since March 15, 2011 when our Fukushima fallout-oriented multi-media radiation testing began.
3:25 pm: RSSMC INT BG: 39.9 CPM^^
@vital1: That is a remarkable repeating pattern, too remarkable to seem random. Yet the only nuclear site we could find near the Sunshine Coast, Australia, is the Narangba food irradiation plant which seems unlikely as a source. This is a stumper.
@All:
January 26, 2015
6:35 pm: RSSMC INT RAIN SAMPLE: 47.2 CPM^^ which is well within the Inspector’s conservative +/-15% margin meaning the rain is at BACKGROUND. This also shows, once again, that Radiation Station Santa Monica California is not impacted by radon progeny/daughters as we have noted, shown and proved multiple times since March 15, 2011 when our Fukushima fallout-oriented multi-media radiation testing began.
6:15 pm: RSSMC INT BG: 43.5 CPM^^
Note: This alert code system here, is not based on any official government alert system. It is one set up by the station operator to indicate significant local increases.
Caloundra (Queensland Australia) 26th January 2015 – It was 80% above pre-Fukushima average levels on the 26th January. This put the monitoring station into it’s second alert level. It was a hot, humid, fine day.
The spread sheet I use, also has a formula set up to calculate average background from 12 midnight to 8 am. The 12 midnight to 8am average on the 26th was greater than the whole day average.
This is very unusual, for these elevated background events to be so precisely cyclical.
The only thing I can think of at present, is a weather related cyclical break through of the equatorial barrier.
India, US reach nuclear deal; Obama uses executive powers to waive intrusive checks
Sachin Parashar,TNN
Jan 26, 2015, 01.54 AM IST
“The US has agreed to India’s proposal to build a risk-management insurance pool of Rs 1,500 crore to provide cover to suppliers who shunned the civil nuclear agreement because it made them liable to pay compensation in the event of a nuclear accident.”
There was no mention of Fukushima by the POTUS during the State of the Union Address, yet within a week he’s peddling Nuclear Power. Don’t these leaders realize that there are ongoing TRIPLE out of control NUCLEAR MELTDOWNS that are not even approachable by humans or robots.
Sometimes I get the feeling that the Nuclear Proponents are themselves ‘out of control’. Where’s the point counter point public discussion on such issues. Oh… there is none.
@Another Simi Mom: These chilling events, reported here by you so eloquently, belies the lethality of set in place nuclear bombs called reactors. Putin’s see-saw behavior makes this likely to go very wrong as his arrogance, along with stupid strategic moves, blind him to the consequences of destroying the plant. His ‘land bridge’ would be a very hot one indeed. Please keep these updates coming.
On January 19, 2015 I commented about the fighting between Ukrainian and Russian forces creating the risk of accident at the Zaphorizia Nuclear Power Plant, the largest in Europe with 5 reactors. The risk could come from armed attack or rocket bombardment.
(Note that there are English spellings of Zaphorizia, phonetic spellings of the Ukrainian word for Zaphorizia, and phonetic spellings of the Russian word for Zaphorizia. I am using the shortest English spelling. It’s all the same nuclear plant and the same territory, no matter how you spell it.)
In essence, it’s clear that the goal of the Russians, having invaded and held both Crimea and much of Ukraine’s Donetsk Oblast (a province), is that the Russians will want to control the land between Crimea and SW Russia. That land bridge is Ukraine’s Zaphorizia Oblast and Donetsk Oblast.
Mariupol is 185 kilometers from the Zaphorizia Nuclear Power Plant.
Grad rockets are notoriously hard to precisely target, which is an important point to be made as to the Zaphorizia Nuclear Power Plant, because the likely route the Russian military operatives choose to take, to seize a wide land bridge between SW Russia and Crimea, will put the nuclear plant even closer to the rocket fire.
Vladimir Putin has bragged that if he wanted to, he could have his tanks and troops in Warsaw in 2 weeks. Instead, it appears the Russians’ current plan is to use ethnic Russian lunatics who have lived in Donetsk and Zaphorizia Oblasts as their mouth pieces, and the Russian equivalent of navy seals and green berets leading regular Russian forces, to slowly move towards Crimea and take the land bridge territory they desire, with the Zaphorizia Nuclear Power Plant in the way.
Today, in another context, someone quoted Winston Churchill’s 1938 book “While England Slept”. I see no sign that any European country has any interest in protecting the Zaphorizia Nuclear Power Plant from Grad rockets fired by lunatics or faux separatists. Will one of us be the one to write the nuclear version of “While NATO Slept”?
Every now and then I come across tidbits of information that might be important to file in ones back brain.
Such as…
The time factor when taking KI Pills after a Nuclear Accident. The warning TIME FRAME, which we had, was never officially issued. 😐
I did not realize how critical the KI TIME FACTOR was!
The KI Pill – TIME FACTOR –
Time (Hours) of KI prophylaxis —– Effectiveness
96 h before radioiodine exposure — 5%
72 h before radioiodine exposure — 32%
48 h before radioiodine exposure — 75%
24 h before radioiodine exposure — 93%
At time of radioiodine exposure —- 99%
1–2 h after radioiodine exposure — 85% – 90%
3–4 h after radioiodine exposure — 50%
8 h after radioiodine exposure —– 40%
24 h after radioiodine exposure —- 7%
Source: modified from Sternthal et al;
WHO – World Health Organization
The NRC mentions ‘time’, but leaves out the important part.
“When potassium iodide is ingested, it is taken up by the thyroid gland. In the proper dosage, and taken at THE APPROPRIATE TIME, it will effectively saturate the thyroid gland in such a way that inhaled or ingested radioactive iodines will not be accumulated in the thyroid gland. The RISK of thyroid effects is REDUCED.”
– NRC
A look back in history: Here’s an excerpt from a comment I left here on May 13th 2011. (radiation-station/#comment-42478)
The comment: May 2011
“What will be the first affects or signs of illness in people and/or “other” life forms that will be noticeable as a result of Fukushima? I understand the long term affects such as cancers, but what are we going to see first and how long if not already will it be? What are doctors currently seeing from those who have entered the no go zone?
I asked this because over the last week I have had 3 people, who know little to nothing about what’s going on make a statement that seemed down right odd to me. It really seemed strange because a couple of days prior to the first person’s statement I felt the same thing, but I “sluffed” it off as allergies or psychological. (or both)
Each of these people, independently, and at separate times said “Wow, it feels like my thyroid is vibrating!”. They were almost word for word. I did not say anything because I am not a Medical Professional and I would not want anyone to panic or give someone false information. My reply was, it’s probably just allergies. But, I have to admit it, I was silently thinking, this is VERY weird. Especially since I’ve never heard anyone say that before in my life and then, 3 times in one week. hmmm… I thought? So I came here to ask.
I know this sounds a bit silly, but I would like to know.”
– Chase
___________
>> I am certain now (Jan 2015) that my thyroid and many others got dosed in the days and weeks following the meltdowns at Fukushima.
Coming up on 4 years later and some of these questions have been answered.
Here are some of the radiation monitoring networks closest to the conflict area in the Ukraine. If the situation does deteriorate, these may help keep track of any major radiation releases.
Global Radiation Monitoring Network Drag and zoom World map to see Romanian, and other European monitoring stations stations (P)
Ukraine Nuclear Power Plants Place mouse cursor over NPP location to see its background level, and mouse click onto the NPP location see more monitoring stations. (G)
1/19/15 6:30PM Pacific Time: We just got home from dinner, where my son’s twitter was blowing up with news about very intense fighting between Russian and Ukrainian troops in South Eastern Ukraine.
BBC America is running a tag line at the bottom of their TV screen saying there is heavy fighting in South Eastern Ukraine in Donetsk and Luhansk. They’ve now put up a story online as well. http://www.bbc.com/news/world-europe-30878406
We are digging for more information about security at the Zaphorizia Nuclear Power Plant and its 5 reactors.
Right now kyivpost.com has a story saying that 382 Russian soldiers have been killed in Ukraine in the past 3 days.
kyivpost.com also has a story saying the fighting between the Russians and Ukrainians is intense.
kyivpost.com also re-reports CNN story from 10AMish Ukraine time 1/20 that Ukrainian Prime Minister Yatsenyuk admitted that more Russian troops and supplies came into Ukraine from Russia yesterday (1/19).
I am concerned that in closing the gap between Russia’s old SW border and Crimea, that the Russians will take all of the Oblasts along the Sea of Azov including the Zaporizhia and its Zaphorizia Nuclear Power Plant which is on the Dnieper River. Zaporizhia Oblast is NE of Crimea and on the coast route from SE Russia to Crimea. See map at: http://en.wikipedia.org/wiki/Zaporizhia_Oblast#mediaviewer/File:Zaporizhia_in_Ukraine_%28claims_hatched%29.svg
The Zaporizhia Nuclear Power Plant is on the south side of the big lake shown on the map at the northern border of Zaporizhia.
(Link to a photo of the 5 reactors by typing “Zaporizhia Nuclear Power Plant” into Wikipedia English, and when the article comes up on the left click on the word Русский and the Russian version of the article will come up with the good photo of the nuclear plant.)
FYI In Anglicized Russian word for Zaporizhia is spelled “Zaporozhye” and you may see it written that way in some news stories or on some maps.
(Link to a photo of the 5 reactors by typing “Zaporizhia Nuclear Power Plant” into Wikipedia English, and when the article comes up on the left click on the word Русский and the Russian version of the article will come up with the good photo of the nuclear plant.)
The population of Zaporizhia Oblast is approximately 75% Ukrainian and 20% Russian, so it certainly looks like there would be a significant fight right near the Nuclear power plant.
It will not be wonderful for the world if fighting, rocketing and sabotage occurs around the Zaporizhia Nuclear Power Plant.
This shows the human side of a Nuclear Catastrophe.
CBS TV 60 Minutes
Bob Simon reports on the aftermath of the disaster in Fukushima, Japan, and finds toxic ghost towns frozen in time.
( August 24, 2014, 7:23 PM – 14 minute segment) http://www.cbsnews.com/videos/fukushima-three-years-later-2/
Some items of note:
> Inside some buildings workers can only stay for 2 1/2 hours at a time in FULL protective outfits.
> One former resident is allowed back to the site of his home 10 times a years for ONLY 5 hours. That’s with wearing protective gear.
> Children can no longer visit their ancestors graves. It’s too radioactive. 🙁
IMO – Nuclear Power is NOT SAFE. The RISK to everything is not calculable or insurable.
Ukraine Zaporizhzhya Nuclear Plant Accident Cover Up? by Peter Daley
11 January 2015
The Ukrainian civil war greatly increases the chances of a major nuclear event occurring in Europe! Ukraine has four nuclear power plants operating, and Zaporizhzhya is Ukraine’s and Europe’s largest. A number of independent Internet news sources, provide evidence that a serious nuclear accident occurred at the Zaporizhzhya nuclear plant, in the Ukraine in late November 2014.
Here is a summary of circumstantial evidence gathered from separate reports.
1. An alleged hacked conversation between two Ukrainian Officials, discussing a very serious and deteriorating situation at the Zaporizhzhya nuclear plant.
2. Leaked official report of the incident, indicating significant radioactive releases. At present, there is no confirmation that this document is genuine.
3. Romanian report of a Radioactive cloud being present in Romania after a recent nuclear accident in Ukraine.
4. Large Romanian background radiation detections from different Romanian private radiation monitoring stations, occurring around the same time the news reports of problems at the Zaporizhzhya nuclear plant surfaced.
All this circumstantial evidence above is weighted against news reports stating that everything is fine.
Example:
Ukraine denies radioactive leak on Zaporizhzhya nuclear plant 30th December 2014
Extract:
Life News newswire published documents which it said came from Ukraine’s emergencies ministry, and showed that a leak at the power plant had led to a spike in radiation over the past two days, exceeding permitted norms by 16 times.
Three officials from Ukraine’s emergencies ministry, energy ministry and the plant itself told Reuters there had been no leak.
The following leaked conversation took place during the Zaporozhye incident is between Tyshenko (General Director of Nuclear Power Plant) and Torbayevsky ( Head of Emergency Readiness). The questions this should raise because the information coming to light reflect a possible situation like this are enormous.
November 28th
Tyshenko 8:12 PM- Vasili what the hell is going on over there?
8:24 – Tyshenko – Why aren’t you answering?
8:58 – Torbayevsky – Vacheslav Alexaivich, forgive me for not answering. We have an emergency. The Third Unit shut down. I am already there. Ignatchencho is with me. Krasnogorov is coming.
Tyshenko – fuck! Why the hell didn’t you tell me immediately? Do you understand the danger this will mean for us? We will be thrown in prison, you as well. Leaving now, will be there in hour.
Torbayevsky – Need to contact Chech specialists from Skoda. Its their equipment.
November 29th
Tyshenko and Krasnogorov, head engineer at plant ZGD
20:34 Tyshenko – Fiador, how are things?
Krasnagorov – Things are not good. The casket on the upper unit cannot take the pressure. Seems we screwed around with this improper material long enough.
Tyshenko – Don’t whine. You need to understand that no one asked me about any of it.
Krasnagorov – Even back then I was saying that this is not going to end well. We needed to do testing first. Its not just the caskets that are the problem. Its with the fuel as well.
Tyshenko – I said don’t whine! These are the orders the ministry gave. They warmed their hands on it already (they made their money) and let this fuck them now (let them deal with the fallout).
Krasnagorov – Understood.
December 2nd
7:48 Tyshenko and Stefansky (Assistant Plant manager)
Stefansky – Vacheslav Alexaivich as soon as you left, journalists flooded us. They are hanging out at the security checkpoint. What do I say to them?
Tyshenko 8:01 am – Listen, I am fucking barely able to stay on my feet (tired). Can’t you come up with something? Say that it is an electrical short circuit or some other shit like that, but about the reactor not a word! Blab, and I will turn you inside out (skin you)! Thats it, out, I’m getting a few hours sleep and will be back.
December 2nd
8:53 Tyshenko and Torbayevsky
Torbayevsky – Vacheslav Alexaivich, we have a leak.
Tyshenko – fuck! Where are you?
Torbayevsky – I’m at the station with the personnel, trying to fix it, but its a dead number (no use).
9:31 am Tyshenko – Ok, I called to the top. We need to be quiet now or we’ll be sent to Donbass as volunteers. Do You understand?
Torbayevsky – Understood.
12:17 Tyshenko – Vasili, I’ve been called to Kiev immediately. Figure this out without me.
Torbayevsky – What do we do with the personnel? We need to evacuate people, radiation is off the charts! And locals need to be warned. We already started dumping into the water supply from the cooling system. Very soon we will have a second Chernobyl.
Tyshenko – Don’t panic! We were told to be quiet. We’ll be quiet!
Torbayevsky – Vacheslav Alexaivich! Do you understand we can no longer keep silent? This is a catastrophe! Here in a 100 kilometer radius, nothing will be left alive! fucking sky is already glowing! (inside joke about radiation)
Tyshenko – Listen! I am flying to Kiev. Wait for a call. For now don’t answer any questions and don’t talk to anyone.
Zero Hedge – Is Ukraine Hiding A Huge Radiation Leak At The Largest Nuclear Power Plant In Europe?
Extract:
Today, we get information of a leaked report sourced from three different place unconfirmed for now (but RT is trying to verify) that Ukrainian nuclear scientists misled the public and a radioactive leak has been detected citing the country€™s emergency services claiming that levels of radiation are 16.3 times the legally permitted norm.
Romania borders the Ukraine. This article if translated correctly, presents the possibility of radiation from a Ukrainian nuclear accident being detected around the northern border area of Romania. The northern border area of Romania is where the private Romanian monitoring stations detected large spikes in radiation in late November and December 2014.
Extract: (I used the Google translate service.)
Translate
06/12/2014 EVENT INFORMATION USEFUL No comments radioactive
Translation Extract:
From the first data announced by the National Meteorological administration, pollutant cloud will remain in the next 24 hours and northern border of Romania. In the first analysis, before all environmental factors values were within the natural limits. This might change, however, in the following days.
These large spikes in background radiation were recorded in late November, and December 2014, on two different private Romanian monitoring stations, located in northern Romania. They are listed here in chronological order. The first Romanian detection occurred a couple of days before news reports of operational problems at the Zaporizhzhya nuclear plant surfaced.
First detection
Alert level for Timisoara Romania 26th November 2014 peak 4.48 uSv/hr.
No stations near by to confirm if it is a genuine detection, still could be equipment malfunction or a very localized event. If it is genuine, this is a very large detection.
Alert level Carei Northern Romania 27th November 2014.
The alert detection in Timisoara Romania on the 26th and now Carei on the 27th, would appear to be confirmation of a major radioactive release somewhere in Europe in the last couple days. Carei is north of Timisoara in Romania.
More investigation would be needed to try and pinpoint the source, and it may not be from Romania.
These detections suggest there have been recent major releases, from a nuclear facility in Europe.
Forth detection
Another significant detection at Timisoara Romania on the 7th December 2014, peak 0.38 uSv/hr.
It is not nearly as large as the other recent detections of 4.8 uSv/hr, 1.81 uSv/hr, 1.17uSv/hr and 2.41 uSv/hr. These were very large free air Gamma detections from two different private Romanian monitoring stations.
Yes, there is the possibility that these high detections have nothing to do with the Ukraine Zaporozhye NPP. These detections could also be equipment malfunctions, or be from local sources. I have considered these possibilities. All monitoring systems are subject to malfunctions at times. Two or more monitoring stations in proximity to each other, indicating a significant increase in background levels, are more statistically likely to be an indication of a genuine event.
All this circumstantial evidence points to a serious nuclear accident having occurred at the Zaporizhzhya nuclear plant in the Ukraine in late November 2014. Nuclear and government officials are renowned for denying any nuclear accident has occurred for as long as they can. They then play down the seriousness of the accident, once they have to admit there has been a nuclear accident. Three Mile Island, Fukushima and Chernobyl Nuclear disasters, are just a few of numerous examples. In my opinion, at this point, it would be wise to keep a close eye on the situation. Civil war and Nuclear power plants are not a good mix!
@george: The rainstorm hitting Los Angeles may have been at background but the L.A. air beta readings were really high. So it’s better to compare air to air it seems, in this case. That said, the closest nuclear reactor to Bakersfield and Fresno is Diablo Canyon on the California south-central coast. We are looking closely at this controversial facility with our findings coming soon.
What might cause the beta readings around Bakersfield and Fresno to rise so dramatically? Rain samples around Los Angeles and environs apparently do not show such a dramatic escalation.
@Peter Daley, Chase, Dale Ramicone and our vigilant crew that keeps our numbers coming accurately, thank you!
January 10, 2015: EnviroReporter.com reaches more than 7,084 special tests and original reports including 2,733 measurements and analyses from nine affiliated Radiation Stations and 4,351 samples and radiation experiments from Radiation Station Santa Monica California. EnviroReporter.com has over 1,852,525 readers and 1,570,979 viewers along with the 20,747 people that have seen Radiation Station Glendale California‘s continuous online streaming. Over 185,822 folks have watched 90 original videos on our YouTube channel and we’ve received tens of thousands of Facebook ‘likes’ for our site, investigations and Facebook channel. Thank you for your support.
January 1, 2015
10:15 pm INT RSSMC TEST OF DENISE ANNE’S MASK: 39.6 CPM^^ or background
10:00 pm INT RSSMC TEST OF MICHAEL’S MASK: 39.6 CPM^^ or background
9:45 pm INT RADIATION STATION SANTA MONICA CA: 41.9 CPM^^
4:30 pm INT JET AIRLINER @ ~36,000 over ~Iowa/Nebraska: 960.4 CPM^^ which is ~32 TIMES PRIOR ORD BACKGROUND HIGHER
3:00 pm EST INT CHICAGO’S O’HARE TERMINAL: ~30 CPM^^
December 28, 2014
12:40 pm EST SOUTHWEST MICHIGAN ROOM PACKED SNOW SAMPLE: 41.7 CPM^^ which is background
12:25 pm EST INT SOUTHWEST MICHIGAN ROOM: 42.9 CPM^^
December 27, 2014
5:00 pm EST EST INT SOUTHWEST MICHIGAN ROOM: 48.7 CPM^^
4:40 pm EST INT SOUTHWEST MICHIGAN ROOM RAIN SAMPLE: 70.5 CPM^^ which is 44.8% OVER BACKGROUND and could have been radon progeny.
December 23, 2014
8:45 pm EST Michael’s airline MASK: 35.4 CPM^^ or background
8:30 pm EST Denise Anne’s airline MASK: 39.6 CPM^^ or background
8:15 pm EST INT SOUTHWEST MICHIGAN ROOM: 39.6 CPM^^
9:18-9:28 am PST INT JET AIRLINER @ 36,995 feet @ 541 MPH with -52 degrees F outside jet over Missouri River from Nebraska to Missouri north of St. Joseph: 837.5 CPM^^ which is 25.5 TIMES PRIOR LAX INT BACKGROUND HIGHER
7:10 am PST INT JET AIRLINER @ 34,993 feet altitude at beginning of 10-minute test and 36,047 feet at end – east of Barstow CA heading over Mojave Desert: 778.0 CPM^^ or 23.7 TIMES PRIOR LAX INT BACKGROUND HIGHER which is why Denise Anne and Michael always wear effective masks in flight
5:40 am PST INT LAX AIRPORT TERMINAL: 32.9 CPM^^
December 22, 2014
10:45 pm INT RSSMC BG: 43.2 CPM^^
10:30 pm INT HEAVY MIST SAMPLE which could be a clue, as in prior tests, to beta radiation presence in Santa Monica Bay/Pacific Ocean: 37.6 CPM^^ – below subsequent background
@vital1: I admit to using the leading “if true” to get even more amazing, sourced information from you. You’ve pieced together this potential catastrophe unlike anywhere else I’ve seen (unless there’s some missing sourcing, which I doubt). You could write this up as an article for us and I’ll edit it. That’s if you’d like to. And when you’re ready, or the story is ready. Our plate is full now but you’ve got a real important story here that should first live on EnviroReporter.com.
2. An alleged hacked conversation between two Ukrainian Officials, discussing a very serious and deteriorating situation at the Zaporizhzhya nuclear plant.
3. High detections reports on 3 different private live monitoring stations, on two different European monitoring networks. These detections occurred around the same time the reports of problems at the Zaporizhzhya nuclear plant came in.
Here is a new report of a very large European detection.
Information and screen shot provided by poster bo on enenews.com, “12/29 monitor station says APR but it looks like – Sicily, Italy on map”
December 28th and 30th 2014, on the netc.com private monitoring system ~45,000cpm, and 65,474 cpm.
4. Extract: (I used the google translate service.)
Translate
Radioactive cloud in Romania, after the nuclear accident in Ukraine
06/12/2014 EVENT INFORMATION USEFUL No comments
radioactive
Translation Extract:
From the first data announced by the National Meteorological administration, pollutant cloud will remain in the next 24 hours and northern border of Romania. In the first analysis, before all environmental factors values were within the natural limits. This might change, however, in the following days.
This article if translated correctly, presents the possibility of radiation from a Ukrainian nuclear accident being detected in on the northern border of Romania. The northern border area of Romania is where the private Romanian monitoring stations detected large spikes in radiation in late November and December.
The evidence above is weighted against reports stating everything is fine.
Ukraine denies radioactive leak on Zaporizhzhya nuclear plant – 30th December 2014
Extract:
Life News newswire published documents which it said came from Ukraine’s emergencies ministry and showed that a leak at the power plant had led to a spike in radiation over the past two days exceeding permitted norms by 16 times.
Three officials from Ukraine’s emergencies ministry, energy ministry and the plant itself told Reuters there had been no leak.
“Timisoara Romania is no where near Zaporozhye, Ukraine so there may be 2 different things going on.”
Yes, there is the possibility that these high detections have nothing to do with the Ukraine Zaporozhye NPP. These detections could also be equipment malfunctions, or be from local sources. I have considered these possibilities.
All monitoring systems are subject to malfunctions at times. Two or more monitoring stations in proximity to each other, indicating a significant increase in background levels, are more statistically likely to be an indication of a genuine event.
In my opinion at this point, it would be wise to keep a close eye on the situation. Civil war and Nuclear power plants are not a good mix! If there is a serious deteriorating situation at the Ukraine Zaporozhye NPP, it may eventually be impossible to hide it.
@vital1: This is superb and, if true, shocking information. The descriptions of the “coffins” with some kind of fracked up fuel is horrifying. One interesting point to an ER reader who wrote to me is that “Timisoara Romania is no where near Zaporozhye, Ukraine so there may be 2 different things going on. If there is no plant near Timisoara perhaps a spill of fuel rods off a truck, spent or not? As to the Zap Plant the key question is what number on the International Scale and how much Ukrainian Blarney is being peddled.”
More large detections 2.21 uSv/hr and 0.46 uSv/hr at Timisoara Romania, on the 3rd January 2015, on the http://www.uradmonitor.com/ private monitoring network.
This recent article refers a hacked conversation, that is alleged to have taken place between two Ukrainian nuclear officials.
General News 1/2/2015 at 08:27:33
Zaporozhye Nuclear Problem may be even Scarier
Conversation Extract from page 3,4 and 5
Zaporozhye Leaked Accident Conversation-
The following leaked conversation took place during the Zaporozhye incident is between Tyshenko (General Director of Nuclear Power Plant) and Torbayevsky ( Head of Emergency Readiness). The questions this should raise because the information coming to light reflect a possible situation like this are enormous.
November 28th
Tyshenko 8:12 PM- Vasili what the hell is going on over there?
8:24- Tyshenko- Why aren’t you answering?
8:58- Torbayevsky- Vacheslav Alexaivich, forgive me for not answering. We have an emergency. The Third Unit shut down. I am already there. Ignatchencho is with me. Krasnogorov is coming.
Tyshenko- f*ck! Why the hell didn’t you tell me immediately? Do you understand the danger this will mean for us? We will be thrown in prison, you as well. Leaving now, will be there in hour.
Torbayevsky- Need to contact Chech specialists from Skoda. Its their equipment.
November 29th
Tyshenko and Krasnogorov, head engineer at plant ZGD
20:34 Tyshenko- Fiador, how are things?
Krasnagorov- Things are not good. The casket on the upper unit cannot take the pressure. Seems we screwed around with this improper material long enough.
Tyshenko- Don’t whine. You need to understand that no one asked me about any of it.
Krasnagorov- Even back then I was saying that this is not going to end well. We needed to do testing first. Its not just the caskets that are the problem. Its with the fuel as well.
Tyshenko- I said don’t whine! These are the orders the ministry gave. They warmed their hands on it already (they made their money) and let this f*ck them now (let them deal with the fallout).
Krasnagorov- Understood.
December 2nd
7:48 Tyshenko and Stefansky (Assistant Plant manager)
Stefansky- Vacheslav Alexaivich as soon as you left, journalists flooded us. They are hanging out at the security checkpoint. What do I say to them?
Tyshenko 8:01 am- Listen, I am f*cking barely able to stay on my feet (tired). Can’t you come up with something? Say that it is an electrical short circuit or some other sh*t like that, but about the reactor not a word! Blab, and I will turn you inside out (skin you)! Thats it, out, I’m getting a few hours sleep and will be back.
December 2nd
8:53 Tyshenko and Torbayevsky
Torbayevsky- Vacheslav Alexaivich, we have a leak.
Tyshenko- f*ck! Where are you?
Torbayevsky- I’m at the station with the personnel, trying to fix it, but its a dead number (no use).
9:31 am Tyshenko- Ok, I called to the top. We need to be quiet now or we’ll be sent to Donbass as volunteers. Do You understand?
Torbayevsky- Understood.
12:17 Tyshenko- Vasili, I’ve been called to Kiev immediately. Figure this out without me.
Torbayevsky- What do we do with the personnel? We need to evacuate people, radiation is off the charts! And locals need to be warned. We already started dumping into the water supply from the cooling system. Very soon we will have a second Chernobyl.
Tyshenko- Don’t panic! We were told to be quiet. We’ll be quiet!
Torbayevsky- Vacheslav Alexaivich! Do you understand we can no longer keep silent? This is a catastrophe! Here in a 100 kilometer radius, nothing will be left alive! f*cking sky is already glowing! (inside joke about radiation)
Tyshenko- Listen! I am flying to Kiev. Wait for a call. For now don’t answer any questions and don’t talk to anyone. ”
😐 It’s now the year 2015. We are coming up on 4 years of FALLOUT from the ongoing TRIPLE MELTDOWNS on the coast of Japan.
I clearly remember ‘the moment’ that I first realized that the earthquake in Japan was going to have global implications, when I understood that Nuclear Plants had most likely been damaged.
I was watching KTTV Los Angeles 10 pm News with anchors Carlos Amezcua and Christine Devine. Fox news decided to run ‘live’ video coverage direct from Japan.
I could see the cars and vans, with people in them, being swept away in real time. The tsunami waves were moving quickly across the fields and one could see the ‘concern’ in the faces of the newscasters. Carlos is a profesional anchor, but it was easy to see that he had a ‘pit’ in his stomach from what he knew he was witnessing that night.
In the days to follow, I started researching the possible different scenarios should one of the Nuclear Plants along Japan’s coast fail. As most of us now know, it wasn’t long until the Nuclear Facility exploded multiple times.
That’s when I stumbled upon an Inspector Detector showing readings from Santa Monica, CA via UStream. That led me to EnviroReporter.com. 🙂
I can remember watching President Obama say,
“Let me repeat… We do not expect harmful levels of radiation to reach the west coast…”
“That is the judgement of our Nuclear Regulatory Commission and
many other EXPERTS.”
President Obama 3 17 11 Fukushima
The things I have learned, in partial thanks to EnviroReporter.com, over these last 4 years have astounded me in many ways. For better or for worse, I feel I know more than the average guy about radiation mitigation and for that I am sincerely grateful.
I now have a better understanding of the history and the lies behind Nuclear Power. (That’s important.)
I can also clearly see the media ‘blackout’ regarding anything NUCLEAR MELTDOWN releated and the lack of thorough testing while getting a constant barage of misinformation about bananas and cosmic rays from the industry ‘paid’ experts.
On a positive note: It’s been almost 4 years and Japan has not restarted their 50+ reactors. 😉 That says a lot to me. Let’s hope it stays that way.
This year end appeal for your support is not for your tax deduction purposes. EnviroReporter.com is not a non-profit.
We don’t get government grants, corporate or private foundation support or even a board of directors telling us what to do as we investigate and expose huge environmental stories that other media either can’t or won’t cover.
What we are is an independent online journalism organization that delivers big news with a lot of wallop, all of which is backed up by a bevy of facts. That’s why you’ve supported us.
We punch above our own weight. Your continued support helps us keeps us in the fight finding the truth of some of the most important issues of our time.
Your backing produced big dividends in 2014. Here’s a sampling of what we accomplished together:
China Syndrome Town, a five-part investigative series, was published in March. This exposé of greed, corruption, and malfeasance blew the lid off schemes to shortchange the cleanup of the Santa Susana Field Laboratory at the headwaters of the Los Angeles River. The lab, also known as Rocketdyne, experienced three partial nuclear meltdowns since it opened over half a century ago.
That same month saw Fukushima – The Perfect Crime? hit our virtual newsstand on the third anniversary of the triple meltdowns in Japan. The in-depth article laid out the growing extent of radioactive contamination in the Pacific Ocean and North American continent. We also debunked meltdown deniers and even showed how California’s number one cash crop – marijuana – was threatened by Fukushima radiation in the soil it’s grown in.
October’s Lights Out revealed the threat of massive coronal mass ejections taking out America’s electrical grid for months, if not years, precipitating chaos that would include hundreds of nuclear reactors and spent nuclear reactor fuel rod melting down and catching fire. Yet, as EnviroReporter.com showed, the problem could be remedied at a relatively scant cost of two billion dollars.
All this, and more, was in addition to our nine Radiation Stations, US EPA RadNet Data for the entire country organized for easy navigation and understanding, and the most comprehensive food testing results in the world, Radiation Food Lab.
We need your support to continue doing this work. Please consider donating to EnviroReporter.com so we can together take on the big environmental stories of 2015.
Is Ukraine Hiding A Huge Radiation Leak At The Largest Nuclear Power Plant In Europe?
Extract:
Today, we get information of a leaked report sourced from three different place – unconfirmed for now (but RT is trying to verify) – that Ukrainian nuclear scientists misled the public and a radioactive leak has been detected – citing the country’s emergency services claiming that levels of radiation are 16.3 times the legally permitted norm.
Here are re-posts of reports by me, of very high detections from private Romania radiation monitoring stations. These detections occurred in late November, and early December 2014.
The Zero Hedge article, and these detections, suggest there has been a recent serious radiation incident in the Ukraine, that is being covered up.
—————-
Another significant detection at Timisoara Romania, on the 7th December 2014, peak 0.38 uSv/hr.
It is not nearly as large as the other recent detections of 4.8 uSv/hr, 1.81 uSv/hr, 1.17uSv/hr and 2.41 uSv/hr. These were very large free air Gamma detections from two different private Romanian monitoring stations.
This Romanian news article when translated indicates if a nuclear release did occur at the Ukrainian Zaporozhye NPP, it would stay no longer than a day over Northern Romania.
Extract: (I used the google translate service.)
Translate
Radioactive cloud in Romania, after the nuclear accident in Ukraine
06/12/2014 EVENT INFORMATION USEFUL No comments
radioactive
From the first data announced by the National Meteorological administration, pollutant cloud will remain in the next 24 hours and northern border of Romania. In the first analysis, before all environmental factors values were within the natural limits. This might change, however, in the following days.
Still a lot of unanswered questions remain with these high detections occurring in Romania on two of the privately run Global Radiation Monitoring Network stations at the time.
————
Alert level Carei Northern Romania – 27th November 2014.
The alert detection in Timisoara Romania on the 26th and now Carei on the 27th, would appear to be confirmation of a major adioactive release somewhere in Europe in the last couple days. Carei is north of Timisoara in Romania.
More investigation would be needed to try and pinpoint the source, and it may not be from Romania.
I find the unsupported commentary in this article very interesting, given the Japanese government’s total clamp-down on current data or current news about Fukushima.
As to this report, then there’s a bridge near my home I’d like to sell you.
😐 EXPERTS aren’t sure why there has been an increase in thyroid cancer amongst children.
No direct mention of Fukushima fallout, of course. However, I was amazed, they did actually say…
“[Experts] say exposure to radiation is a RISK factor”.
– Newscaster
I had to shake my head and say “wow!” on that one. 😉
They said 5 children per million is normal in the USA. I have recently read that of approximately 340,000 children tested in Fukushima over 100 have thyroid cancer. That’s a BIG difference in comparison. We may see kids numbers rising even more soon.
Think of ‘how many’ have been affected and how much suffering could have been prevented if proper mitigation warnings had been issued early on. (March through June of 2011 at least) Thanks to Nuclear Proponents decisions to downplay this catastrophic global event KIDS have become regrettable collateral damage.
🙁
December 27, 2014: EnviroReporter.com reaches more than 7,016 special tests and original reports including 2,722 measurements and analyses from nine affiliated Radiation Stations and 4,294 samples and radiation experiments from Radiation Station Santa Monica California. EnviroReporter.com has over 1,844,961 readers and more than 1,570,795 viewers along with the 20,668 people that have seen Radiation Station Glendale California‘s continuous online streaming. In excess of 185,186 folks have watched 90 original videos on our YouTube channel and we’ve received tens of thousands of Facebook ‘likes’ for our site, investigations and Facebook channel. We thank you for your support.
This new status report/news story popped up concerning the current state of affairs at Fukushima. Since I’m not familiar with this news service, read it for what it’s worth. If you think this news service is not TEPCO/Japanese government manipulated, let all of us know:
Day averages have reached our first alert level here in early December 2014. The alert code system here, is not based on any official government alert system. It is one set up by the station operator, to indicate significant local background increases.
December 18, 2014
10:15 am INT RAIN WESTERN LOS ANGELES BASIN : 62.4 CPM^^ WHICH IS 54.5% HIGHER THAN BACKGROUND
10:00 am INT BG: 40.4 CPM^^
December 16, 2014
12:10 am 17 DEC INT BG: 41.7 CPM^^
11:55 pm INT WESTERN LOS ANGELES BASIN RAIN SAMPLE (SECOND STORM): 50.0 CPM^^ WHICH IS 19.9% ABOVE SUBSEQUENT BACKGROUND
10:45 pm INT WESTERN LOS ANGELES BASIN RAIN SAMPLE (SECOND STORM): 56.0 CPM^^ WHICH IS 30.1% ABOVE BACKGROUND
10:30 pm INT BG: 43.2 CPM ^^
12:15 pm INT BG: 42.9 CPM^^
Noon INT WESTERN LOS ANGELES BASIN RAIN SAMPLE (FIRST STORM): 41.3 CPM^^ (BACKGROUND WITH NO RADON PROGENY)
December 13, 2014
8:00 pm INT FOURTH FLOOR The Oviatt Building HEPA FILTER DEBRIS FROM ONE AIR CLEANER + ONE AIR CLEANER/IONIZER: 63.2 CPM^^ WHICH IS 67.6% ABOVE BACKGROUND FROM BETA EMITTERS
7:45 pm INT FOURTH FLOOR The Oviatt Building: 37.7 CPM^^
4:45 pm INT THIRD FLOOR Los Angeles Athletic Club: 41.5 CPM^^
@Chase: It looks like a rainbow, alright, shooting straight up out of the complex where The Glowed at the End of the Rainbow may be (give or take a containment vessel or three).
@Los Angelenos: December 16, 2014
12:10 am 17 DEC INT BG: 41.7 CPM^^
11:55 pm INT WESTERN LOS ANGELES BASIN RAIN SAMPLE (SECOND STORM): 50.0 CPM^^ WHICH IS 19.9% ABOVE SUBSEQUENT BACKGROUND
10:45 pm INT WESTERN LOS ANGELES BASIN RAIN SAMPLE (SECOND STORM): 56.0 CPM^^ WHICH IS 30.1% ABOVE BACKGROUND
10:30 pm INT BG: 43.2 CPM ^^
12:15 pm INT BG: 42.9 CPM^^
Noon INT WESTERN LOS ANGELES BASIN RAIN SAMPLE (FIRST STORM): 41.3 CPM^^ (BACKGROUND WITH NO RADON PROGENY)
I know I’ve never seen a phenomenon like it before. 😯
An almost volcanic looking rainbow-spout spewing emissions over Fukushima.
Screenshot taken by me on 12/11/2015 16:15 jst via the Futuba web cam located at an intersection several miles away from the facility.
@george: This is the nicest comment, George. It makes us so happy that we could be of service to you today (and all days). Denise Anne and I were marveling at the scarcity of such rain testing this morning when I asked “Are we the only ones testing the rain on the West Coast today?” We very well may be.
To extrapolate these readings perhaps farther than we should, it would seem to us that finding nothing in our rains of late means that the Pineapple Express delivered a nice clean drenching to the Glowdon State free of (hot) charge! It means for folks like you, who are smart and work outside (lucky fella), there is nothing but nice clean H2O dropping from the heavens. Great news for the snow pack too.
We failed to answer your Nov. 24 question about where such a surge of the recent radiation we reported on in Sky high radiation readings across the U.S. is coming from. It could be from be from renewed, sharp catastrophe at the Fukushima nuke plant or, if we can extrapolate from the incensed and misleading comments sent in by anonymous pro-nukers who work in the nuclear industrial complex, it could be from plants here domestically as well. Forget getting an answer out of our government.
Thank you again for the kind words. It really makes our day, George! We know now that when we test rain here in lovely So Cal and it contains zip/zilch/nada, our raddie friend George is safe and sound.
Rain in western Los Angeles Basin is NOT HOT and coming it at background levels with no radon progeny influence.
December 12, 2014
8:50 am INT MAJOR STORM RAINS SAMPLE: 49.3 CPM^^ (13.6% above background = background because Inspector’s conservative margin of error is a careful +/- 15%)
8:30 am INT BG: 43.4 CPM^^
December 11, 2014
11:50 pm INT MAJOR STORM RAINS SAMPLE: 44.5 CPM^^ (background)
11:35 pm INT BG: 44.8 CPM^^
@Jolly Farmer: The site you asked this question of is run by a former TV weatherman who appears to be a climate change denier and anti-United Nations crusader.
[Only after we replied to your question did we see that you got your response from yet another anonymous commenter on this site, not the site operator.]
Shooting the breeze about the high beta readings that the U.S. EPA detected by saying “it is probably due to the sun” and the result of radon ignores several important facts.
One, for example, is that if the Sun were responsible, why doesn’t it affect all the graphs generally in the same manner? If it did, then we’d see similar upticks across the spectrum of sites. The Sun doesn’t, that’s why.
Another fact is a map of radon distribution in the United States that we included in Beta Watch which shows that many of the places where the beta is going sky high (San Diego, Fresno, Bakersfield, Amarillo, etc.) don’t have much, if any, radon at all. Radon variations are not the primary reason for these readings as our archive of EPA RadNet readings shows, and as we noted in this piece comparing 2013 to 2014 readings for several sites.
This doesn’t mean that beta radiation caused by the Sun is not measured and discounted. It is part of the background hence why EnviroReporter.com, and its associates, have conducted over 7,000 radiation tests since Fukushima began March 11, 2011, the vast majority of which have come in at background. Extensive experience doing this helps us know what’s hot and what’s not. That experience and knowledge, easily explored on this website, has been invaluable interpreting and reporting these EPA RadNet readings.
The reply ended with these falsehoods: “I know for a fact that the cited measuring stations analyze for the nuclides. The article made no attempt to include this information. Deception by omission.”
The EPA RadNet beta stations test for beta radiation and do not run gamma spectrometry at these stations to determine isotope concentrations in this online streaming testing. If they did, you can darn well bet EnviroReporter.com would include this information. But EPA doesn’t so the author of this reply who knows “for a fact” that they supposedly do means the oracle who responded to you is straight up lying and/or doesn’t know squat.
This isn’t a ‘he said, she said’ issue open for opinions. We report facts based on facts. Pro-nuclear apologists, some of which appear to have taken a sharp blow to the head, toss facts out the window because the facts don’t fit their implausible agendas.
You were right to ask us what our reaction to this nonsense is. Stick to the facts, Jolly Farmer, and the answers lay themselves out clearly.
“Jolly Farmer: Re “skyrocketing” beta measurements. Beta emitters are created in our atmosphere as the result of cosmic radiation and high energy particles interacting with the earth’s atmospheric molecules. The predominant beta emitter is carbon-14 and other beta emitting nuclides include H-3 and Be-10. A nice blast from the sun will increase the number of beta emitters in the atmosphere. Just saying that there is an uptick in atmospheric beta measurements doesn’t mean squat without an analysis of the nuclide(s) causing the uptick. If an analysis shows an uptick in these natural radionuclides, it is probably due to the sun. Other natural air borne beta emitters includes Radon daughter products which are and can be released via a number of mechanisms including man stirring up the earth, a volcano or a forest fire. The article you cite is just another alarmist, Chicken Little article. I know for a fact that the cited measuring stations analyze for the nuclides. The article made no attempt to include this information. Deception by omission.”
This short animation of Northern, and Southern Hemisphere air circulation,
Summary:
Traces of Lead Pb-210 and Beryllium Be-7 were detected in the rain water. The rain fall for the month was very low at 5.2 mm.
This is only a test of the polyester part of the rain water filter system design. Tested both the charcoal and polyester components and there was not much difference in the isotope signatures captured. There was a slight difference in amounts detected in each filter type.
Roof down pipe filter design for rainwater testing.
In this chart I have CPS on the Y axis to show activity, and have turned off Y log to show linear scaling. It is on a scale at less than one decay detection every 1000+ seconds, near the bottom of the chart.
“The Nuclear Regulatory Commission estimates that many of the nuclear power plants in the United States will be out of room in their spent fuel pools by 2015, most likely requiring the use of temporary storage of some kind.”
– wiki http://en.wikipedia.org/wiki/Spent_fuel_pool
Proper planning can be critical. Thank you Nuclear Industry for thinking of our future safety.
[sarc]
Why would ‘anybody’ continue to use a power source who’s temporary waste storage solution has surpassed limits with no long term solution? I would call that crazy or criminal. (Also, I wonder what their definition of ‘temporary’ is?)
“The future relies on the citizen scientist… instead of relying on the national establishment to protect public health. The citizens have got to get involved.”
– Dr. Keith Baverstock former WHO Radiation Expert
(He’s now a whistle-blower of sorts on the politics of science.)
@Vital1: I too have read about the accident at the Zaporizhye/Zaporizhia Nuclear Power Plant, which is the largest one in Europe, with 6 reactors. Supposedly, there was a short circuit in the power outlet system, not causing any risk to the public.
The interesting point to note is that the plant is about 100 miles west of Donetsk, where the fighting has been going on between the Ukrainian Military and the Russian/Ukrainian “Separatists”. In August 2014 a European Greenpeace member Tobias Munchmeyer expressed to German publications his concern that the Soviet-era design of the reactors, covered by approximately 4′ thick reinforced concrete shells, could be pierced by armor-piercing weapons. Munchmeyer claimed that even a small aircraft crashing into one of the concrete shells could break them open.
Having lived through the severe public health crisis created by the Chernobyl accident, the ordinary people of Ukraine, Belarus and southwest Russia, including those living in the areas where the fighting is going on, are well aware of the catastrophic effects of airborne releases of radiation from the Chernobyl plant.
So lets all hope that common sense will prevail and that both sides of the fight will take care to protect the “Zap Reactors” and the people who live in Europe, since the effects of Chernobyl’s radiation are still being found in Sweden and Germany, for example.
Sky high radiation readings across the U.S.Government and private radiation stations pick up coast to coast climb surpassing summer surge
News and Analysis
U.S. Environmental Protection Agency RadNet radiation monitors have detected renewed surges in atmospheric readings of dangerous beta radiation across the country. Over a dozen metropolitan test sites have registered four-month highs inEnviroReporter.com’s most recent comprehensive assessment.
3rd December 2014 – Ukraine nuclear accident ‘no threat’: Minister
Extract:
“I know that an accident has occurred at the Zaporizhye NPP,” Yatseniuk said, asking Demchyshyn to make clear when the problem would be resolved and what steps would be taken to restore normal power supply across Ukraine.”
This short animation of Northern, and Southern Hemisphere air circulation, shows why we can get detections so far south.
Summary
November 2014 monthly average background radiation level was 29% above the pre-Fukushima average. The November average for 2012 was 31% above and 2013 was 30% above the pre-Fukushima average.
Technical details:
(Note: The 4yr average referred to in the charts, is the 4yr pre-Fukushima average.)
Day average chart for November 2014 (29% above average)
Disclaimer: This is an amateur volunteer run service. Human error can provide incorrect information, and equipment malfunction can produce false readings. Do not rely on, or take action upon information presented here, without further research.
No time to do an average in this moment, but a quick cpm check shows our rain in HEMET, CA just a little above background. Could be radon. Is not reading super hot preliminarily. Will recheck and report soon.
Here’s one of the mainstream media’s current takes on the situation at Fukushima.
Tour the Fukushima disaster zone.
CNN | Added on December 1, 2014
“Almost four years after the Fukushima meltdown, tour guides are now taking people through the abandoned neighborhoods.”
@Michael, Yes, I was also shocked by the “Tritium in Tucson” report, just posted into the Enviroreporter’s “Radiation Food Lab”. It was the first I had heard about this event.
Large numbers of American children would have been potentially affected by this, plus no one responsible for the large amount of radioactive contamination seems to have gone to jail.
We know that children are very sensitive to the effects of radioactive isotope ingestion.
Alert level Carei Northern Romania – 27th November 2014.
The alert detection in Timisoara Romania on the 26th and now Carei on the 27th, would appear to be confirmation of a major radioactive release somewhere in Europe in the last couple days. Carei is north of Timisoara in Romania.
More investigation would be needed to try and pinpoint the source, and it may not be from Romania.
@george: Remember the strength of the press blackout on Fukushima, like we documented in Fukushima – The Perfect Crime?, and know the power of this silence. Yet word gets out like TEPCO saying in the last two days that the triple meltdowns were totally out of control, like we didn’t know that for over 3.5 years. The amount of radiation continuously being released into the environment just from that is getting in the Pacific and being made airborne through water to sea spray/air to water/land and to evaporation/dust in a cycle we’ve described in Beta Watch. In a nutshell, meltdowns are the only mega-disasters that get worse as time goes by, way worse. And the genetic-mutating and cancer-causing effects keep rising as do the rads. That said, we have plenty of radiation sources near some of the highest readings in the country that could also be responsible for these epic readings.
@vital1: Thank you for these stellar readings. We’ll be discussing them in a piece we’re about to publish about this latest slate of skyrocketing readings. Our gut feeling looking at the San Leandro, based on years of looking at such graphs including the NETC’s (just like we know you have), is that the equipment is functioning properly and that the recovering property market isn’t the only thing hot in San Leandro. Astonishing data.
@Chase: Among the positive things that has come out of Fukushima is getting to know folks like you and Peter, the Vital One. It is understandable that people can’t wrap their heads around the immensity of the disaster that is Fukushima because the lethal-when-it-fails technology behind it is so new to the human experience. Just 100 years ago, Madame Curie was hauling a the first X-ray machine around in a horse drawn carriage taking X-rays with the bulky thing. Today, we’re killing the Pacific yet everyday Denise Anne and I see people still stuffing their faces with sushi. And it’s only getting worse as the Sea of Goo concentrates off of Northern California and the Bay Area as it slowly oozes down towards Southern California where EnviroReporter.com will be waiting for it.
I can’t help but remember 3 1/2 years ago when I first came to EnviroReporter.com, learning about Fukushima and wondering what rad detections would be telling us come 2015.
I guess now we know.
I am surprised, at this point, with all of the evidence at hand, that more people are not involved, aware or even seem to care about Fukushima or rising rad detections.
IMO – The lack of response from government officials and academia is as frightening as it is criminal. (39 active EPA detectors seems like a joke, but it’s not)
Q: Will rad detections continue to rise over the next 3 years, decades or longer?
A: I don’t see how they could not, considering the ongoing triple meltdowns at Fukushima.
The China Syndrome explained in the movie The China Syndrome.
More significant spikes in radiation detected on the 24th November 2014, at the San Leandro CA monitoring station on http://www.netc.com, ~12,000 cpm, ~14,000 cpm and ~ 19,000 cpm.
These are very large detections at the San Leandro monitoring station, and it should be investigated to clarify if it is equipment malfunction, or not.
My opinion, if it is a genuine detection and not equipment malfunction, the San Leandro source is most likely local, because the detections are just so large.
These readings seem astronomically high. What could be the cause of such a surge in radioactivity? I find it hard to believe that it is all from Fukushima unless something there has changed dramatically, such as a collapse of one of the pools used to store and cool spent fuel rods. Any ideas? This could have a very severe impact on our health and the health of our environment. I’m very concerned.
@vital1: These exceptionally high NETC readings seem to be confirmed by EPA’s RadNet system as we just reported in RadNet Air Monitoring:
2014/11/23 at 5:40 pm
Only 39 out of 124 USEPA beta monitors are functional as of this date. That is success rate of just 31.5 percent for America’s front line defense against airborne beta radiation like cesium-134 & 137, strontium-90 and plutonium-239. The failure of this taxpayer-funded program to maintain anything near a success rate approaching acceptable is extraordinary. Nevertheless, these radiation stations are invaluable, producing the best data in the United States.
Manmade beta emitters, the kind of radiation pouring out of the ongoing triple meltdowns at Fukushima Dai-ichi, Japan, are the most dangerous to the health and genetic integrity of flora and fauna in both sea and on land. That includes humans. That’s what these stations are monitoring for, stations that by in large have operating gamma radiation sensors which are far less effective in detecting the kind of radiation we’re looking for.
Again, several significant beta stations have gone offline while a couple of crucial ones are sputtering to life. There have been a number of startling developments since our last report, some of which have been also detected by the Nuclear Emergency Tracing Centre and reported by Peter Dailey who also runs Radiation Food Lab and Radiation Station Sunshine Coast Australia.
Readings of 100 CPM or more indicate significant beta radiation activity. Three times background readings could mean a hazardous situation exists and protocols discussed and reported on in EnviroReporter.com since March 11, 2011 should be noted. See that below the tilde symbol (~) before some rad readings means mathematically approximate.
Since October 1, 2014 (below in archives), Montgomery AL hit a four-month high reaching 400 CPM October 17; Anchorage AK also hit a four month high reaching 100 CPM November 1 which is the first time it has reached that dubious milestone since EnviroReporter.com began tracking its beta radiation totals; Fairbanks AK hit a four-month high smashing through the previous ~190 CPM September 28, topping ~245 CPM October 31; Phoenix AZ blew through its previous ~210 CPM four-month high hitting over 650 CPM November 23 in a state where most voters probably would support funding these radiation stations that bring the harsh, and hot, reality home that the Grand Canyon State is getting hammered with beta rads; Tuscon AZ nearly topped 450 CPM October 31 which was over 25% higher than its last period high; Little Rock AR rocketed to 450 CPM October 27 exceeding past records; Fort Smith AR calmed down a bit to ‘just’ 300 CPM October 27; Anaheim CA‘s beta graph started working August 7 then went dead completely August 15; Fresno CA smashed through previous highs hitting ~970 CPM November 11; Bakersfield CA has gone off the charts – in excess of 1,000 CPM – half a dozen times in early to mid-November; Los Angeles CA‘s beta graph stopped in March but the gamma seemed quite jumpy in November so EnviroReporter.com relied on its HEPA filters dust sampling and detection and found that autumn dust in Los Angeles was eight times higher in beta radiation than late summer dust; Riverside CA‘s graph gave out September 15 after repeatedly slamming through the ‘Oh NO!’ threshold of 250 CPM and has stayed out; San Bernardino County CA hit a four month high October 18 pegging ~335 CPM; San Diego remains extremely active hitting ~580 CPM September 20 and then hit 650 CPM October 1 as this once ‘cool’ city has turned beta ‘hot’ though the last week has settled down a bit to around 150 CPM; Hartford CT is trending upward tying a four-month high September 28 of ~215 CPM which is over ten times its normal background but was about ~60 CPM yesterday; Washington DC was just ~35 CPM yesterday; still not one beta monitor out of five works in Florida; Augusta GA no longer has a working beta graph in a very active environment, unfortunately, giving out August 25 never to return, yet; Ft. Wayne IN has dropped a bit with a ~280 CPM high November 13 for this reporting period; Baton Rouge LA‘s four-month high was hit November 10-11 with ~290 CPM; Orono ME hit a whopping 55 CPM October 6 which is high for this usually down in the teens community; Baltimore MD‘s beta and gamma graphs are now ‘on’ and functioning properly which is great news and promptly soared to ~210 CPM October 1, went offline for two weeks and now is back registering just 55 CPM yesterday; Worcester MA blew through ~320 CPM September 28 and has spiked three times in November over 200 CPM; Grand Rapids MI got up to ~260 CPM November 5; St. Paul MN was blowing through 300-350 CPM regularly before its beta station died October 16 not to return so far; St. Louis tested ~235 CPM October 14; Lincoln NE hit a four-month high August 3 with ~360 CPM and then its graph died but came back October 23 with 350 CPM being exceeded November 23; Concord NH hit ~245 CPM October 7 then the graph literally flatlined until November 14 but at nicely lower readings around 130 CPM; Albuquerque NM also hit a four-month high October 19 with a sizzling ~540 CPM; Buffalo NY tested at ~210 CPM November 18 before the massive snowstorm dropped seven feet on the city; New York City NY is not functioning as it hasn’t for years but its gamma gross count is sort of jumping around like LA’s gamma is – just one difference, NYC’s gamma is much more active all through the summer into the fall; Syracuse NY showed ~240 CPM November 6; Charlotte NC topped 200 CPM November 13; Raleigh NC hit ~170 CPM July 24 and cut out and still hasn’t come back on, a real loss in the South but we do have Radiation Station Harrisburg North Carolina for occasional rain radiation tests including one November 17 which showed hot rain radiating at 9.9 times background; holy Toledo OH has calmed down somewhat and was 50 CPM today; Corvalis OR hit 375 CPM October 9 and over 200 yesterday before plunging to ~20 CPM today; Pittsburgh PA was ~165 CPM today; Puerto Rico‘s beta graph doesn’t work but the gamma remains low and steady; Amarillo TX hit 1,000 CPM October 20-21 then died November 1 which is truly a shame since it has been the most inexplicably active beta graph in the nation, certainly a dubious honor; Dallas TX goes Texas-big topping 400 CPM October 15, a four-month high; Ft. Worth nearly hit 250 CPM November 20; Salt Lake City UT‘s beta station is still down since a huge beta increase over 200 CPM in early May and remains offline in a state that prides itself on efficiency; and Madison WI hit a four-month high September 30 charting an astounding ~555 CPM and was ‘just’ 300 CPM last night.
Reports from a contact who has been keeping a close eye on these locations.
San Leandro CA 243468 CPM 16th October 2014, (Average here 191 cpm) This is a huge detection!
Another Saint Charles Il, detection, 2729CPM – Tuesday, November 18, 2014, and 22th November 2014 twin peak at ~6,000 cpm (Average here 19 cpm)
Bakersfield Ca, ~1,600 cpm, ~1700cpm a few days before the 12th, and ~1,800 on the 12th November 2014, plus another ~1,000 cpm detection on around 21st November 2014 (Average here 277 cpm)
These detections are so large, it suggests these are releases from local NPP’s or other nuclear facilities nearby.
Caloundra (Queensland Australia) 16th November 2014 –
There has been a general increase in background levels here over the last few days. It was 43% above pre-Fukushima average levels on the 16th. No rain, it was a clear fine day, so this was a free air increase. Most of the day increase occurred when the wind direction was NNE. Here that meant the wind was coming off the Pacific Ocean.
For the majority of the day the Radon monitor was below 1 pCi/l.
RADIATION STATION HARRISBURG NC 11/17/2014
Total overcast. Showers started around 1 a.m. Moderate to light off/on coming from s west to n east. Once again all tests unless otherwise stated are from my car windows/windshield… Note: On my YouTube I used a digital watch and forgot to setback 1 hour so exact time is 1 hr less.
1… 291.7 cpm @ 10:56 am
2…. 29.6 cpm background
3… 9.854 x background
@Schoenborn Wes: Could you send us some photos of the site and what you describe? And please identify yourself as we’ve never had the pleasure of meeting you since EnviroReporter.com‘s reporting on neighboring Rocketdyne began in 1998.
Dayton Canyon developer breaking ground, please visit site. There are several new construction and dust mitigation signs newly erected from AQMD along fenceline near Valley Circle and Roscoe Blvds., West Hills area. There are numerous employee instruction signs from the developer inside near security trailer describing construction rules.
October 31, 2014
9:45 pm EXT BG Badwater Basin at -109′ elevation: 44.1 CPM^^
October 23, 2014
1:50 pm EXT Death Valley BG at 689′ elevation (in shade and not direct Sun where the temperature hit 128 degrees Fahrenheit): 75.2 CPM. This was in the northern main valley in Death Valley called Mesquite Flat. Spot checks revealed that background in Mesquite Flat was nearly double that of the southern main valley in Badwater Basin. Our speculation is that the northern valley was impacted more by fallout from the Nevada Test Site less than 100 miles due east.
October 20 through October 31, 2014: EnviroReporter.com took numerous interior and exterior spot readings, as well as carefully checking food and drink products as recorded in Eat Me. All tested normal except for a puddle of rain which was 50% above background, significant because water retards ionization making it harder to detect. We missed Death Valley rains unlike last year when the heavy precipitation was dozens of times background as we documented in Boreas Storm Packs Radioactive Punch.
October 19, 2014
11:05 pm INT BG Lone Pine CA at 3,748′ elevation: 62.7 CPM^^
This short animation of Northern, and Southern Hemisphere air circulation, shows why we can get detections so far south.
Summary
The good news is that the air borne contamination reaching this location, appears to have stabilized for the time being.
October’s 2014 monthly average background radiation level was the lowest October monthly average since pre-Fukushima, at 14% above the pre-Fukushima October average. 2012 was 19% above and 2013 was 25% above the pre-Fukushima average. 2012 had the most dynamic swings in background levels.
Over the last few months we have been getting a lot of low pressure systems develop between Australia and new Zealand, pumping cleaner Southern Ocean air up along our east coast. In previous years at this time of the year, the air flows here came mainly from the tropics.
Technical details:
(Note: The 4yr average referred to in the charts, is the 4yr pre-Fukushima average.)
Day average chart for October 2014 (14% above average)
Traces of Lead Pb-210 and Beryllium Be-7 were detected in the rain water. This is surprising since the rain fall was only 30mm in October.
The Be-7 peak should be at 477 Kev. The Be-7peak in this test chart with calibration is slightly to the left of the ideal at around 470 Kev. This suggests the presence of another unidentified isotope. At these trace levels their peaks are too close for this equipment to separate the peaks enough to identify the other isotope. A second test was done a couple days later. Whatever was present had decayed away, and the Be-7 peak was where it should be in the chart.
So far we have not been able to qualify what the possible isotope maybe.
Keep and eye on Northern and Southern Hemisphere UV levels in spring and summer. Here, we are already into extreme UV levels. During these events it is important to put in place protective UV Radiation measures.
Have recently set up an experimental live Radon monitoring system here.
This live Radon monitor has been set up to establish if Radon, or other Alpha emitting radioactive isotopes are significantly affecting local background radiation levels, at the Caloundra monitoring station location.
It is set up in a room in a wooden building on stumps, near the Pacific Ocean, so Radon levels should be low. Anything above 4 pCi/l for an extended period of time would be of concern.
Significant Radon increases have been detected when storms have passed over the area. Also, significant increases have been detected on clear fine days. Still assessing what it all means.
Disclaimer: This is an amateur volunteer run service. Human error can provide incorrect information, and equipment malfunction can produce false readings. Do not rely on, or take action upon information presented here, without further research.
The iodine is coming from somewhere, that much is certain.
This should be a Top Priority Story, especially for local news.
Possibilities:
1. As most of us who have delved into the issues of Nuclear Power now know, the ‘dumping’ of radioactive contamination is just part of the overall ‘collateral’ damage of an industry built on deception and the denial of human fallibility.
Note: I saw a news report on the issue of dumped trash in Los Angeles the other day. Couches, garbage, you name it. Now imagine some ‘idiot’ being paid well to transport radioactive waste from a hospital, but instead, dumps it into the LA river or the ocean. The damage and suffering from such a thing would be horrendous.
2. To think that it may be terrorist related is beyond imagination too, but that’s probably coming at some point, if it hasn’t already. I am sure we would not be told by official agencies. The Nuclear Industry’s logic is that the ‘damage’ has been done so ‘say nothing’ order to avoid further panic. That will be one excuse.
3. Fukushima…? I don’t know.
IMO – There’s not been enough ongoing thorough testing to say with any certainty. The way I see rad readings from Bakersfield and Fresno fluctuate makes me wonder. 😯
I should also note that as an observer of the Fukushima webcam, I can tell you, without a doubt, that ongoing visible emissions have increased dramatically over the last 60 days and especially since the double typhoon strikes.
Dilapidated nuclear waste storage ponds abandoned 40 years ago containing hundreds of tonnes of fuel rods pose an immediate danger to public safety, photographs sent to The Ecologist reveal. The fuel and sludge in the ponds could spontaneously ignite if exposed to air, spreading intense radiation over a wide area.
The photographs show cracked concrete tanks holding water contaminated with high levels of radiation, seagulls bathing on the water, broken equipment, a dangerous mess of discarded items on elevated walkways, and weeds growing around the tanks.
The ponds are now undergoing decommissioning in order to restore them to safe condition. But the process is fraught with danger – and nuclear expert John Large warns that massive and uncontrolled radioactive releases to the environment could occur.
Simi Valley, CA – 10 MIN AVG raining
6:40a INT 46.2 CPM
6:50a EXT 52.7 CPM – Inspector placed within a plastic bag
7:00a INT 65.3 CPM – Paper towel rain sample
Uranium hexafluoride release tonight at Honeywell Works, Metropolis, IL. – 26th October 2014
Extracts:
There was a confirmed uranium hexafluoride release at Honeywell Works in Metropolis, IL at 8pm tonight. Sirens have sounded and Honeywell guards have told people to shelter in place, close windows, and turn off A/C.
It was noted to be moving west from Metropolis. Wind maps indicate that the wind is from the southeast, so the plume would be moving northwest. Cape Girardeau MO and St Louis MO, or points in between, would seem to be where it is headed. And it won’t stop there.
This was just posted on Radchicks Facebook page an hour ago!
UPDATE/NUCLEAR ACCIDENT ILLINOIS: Found on #Honeywell Union Worker Lockout page, posted by Scott Posey: “I assume Honeywell let all the replacement workers know the company will pay for all their windshields that need to be replaced now as well as detailing all of their cars and trucks.”
**Anyone who lives in the area that had cars parked outside last night needs to check the windshields and the paint for pitting. If there is damage, even if it is very mild, DO NOT TOUCH THE CAR. Document with video and hi-resolution pics, email me asap @ christinax4@yahoo.com
“When we called the plant to ask why the Honeywell sirens were going off the guards said to shelter in place, turn off air, & close windows.”
Britain’s nuclear test veterans ARE the victims of a genetic curse, new research reveals – 18th October 2014
Extracts:
Research – first reported by the Sunday Mirror in 2007 – which shows that their offspring have 10 times the normal rate of birth defects has finally been accepted by the scientific community.
The study proves:
Wives have THREE times the rate of miscarriage
Children are FIVE times more likely to die as infants
Babies are THREE times more likely to be stillborn
Veterans’ grandchildren EIGHT times more likely to have birth defects
Grandchildren of veterans TWICE as likely to get childhood cancer
And the most shocking finding of all is that the problems are likely to last at least 500 years, or 20 generations.
@Chase et al: Bravo on your spirited debate over at that website with the ‘let’s build more nuke plants’ article by Joe Vitti. A little digging found that Vitti was a manager at Atomics International in Canoga Park way back in the day. AI brought us the most polluting meltdown in the history of the U.S. in 1959 just 30 miles northwest of downtown Los Angeles when the Sodium Reactor Experiment melted down with about a third of its rods melted. One of Vitti’s 95 Facebook friends is Chris Rowe, aka the Meltdown Denier.
That should give you a pretty good idea about this article and the nasty commenters who have tried to insult you, Chase, which is about all they can do as you have so eloquently addressed the real issues of nuclear power. I don’t marvel at nuclear proponents’ myriad false claims and denial of the obvious (revealed so terribly with Fukushima’s worsening triple meltdowns; I marvel at people like you, Chase, and the raddies commenting here who are willing to debate these issues with people like this.
This short animation of Northern, and Southern Hemisphere air circulation, shows why we can get detections so far south.
Summary
September’s 2014 monthly average background radiation level was the lowest September monthly average since pre-Fukushima, at 6% above the pre-Fukushima September average. It was 7% below 2012 and 9% below 2013 monthly averages. This September saw a longer period of Southern Ocean air flows than previous years. Over the last few months, a number of low pressure systems have been siting between Australia and new Zealand, pumping cleaner Southern Ocean air up along our east coast.
Besides background levels of Ionizing radiation, it is now also important to closely watch UV levels, in both the Northern and Southern Hemisphere in spring and summer. Here, this week in early spring, we are already into extreme UV levels. During these events it is important to put in place protective UV Radiation measures.
Significant traces of Lead Pb-210 and Beryllium Be-7 were detected in the rain water. Again this is surprising, considering the local background levels and rain fall were low for September. September 2014 had 63.2 mm of rain. There were a number of significant solar storms and CMEs which hit the Earth’s upper atmosphere in September.
Beryllium Be-7 can be made by spallation in the upper atmosphere, during solar events, and takes around two weeks to reach the surface. Lead Pb-210 is a decay daughter of Radon Rn-222. My view is that because of the upper atmosphere damage, and a weaker magnetosphere, smaller solar events are now having a greater impact on the Earth’s upper atmosphere. This is a possible explanation for the increased Beryllium-7 detections in rain water washouts here.
Disclaimer: This is an amateur volunteer run service. Human error can provide incorrect information, and equipment malfunction can produce false readings. Do not rely on, or take action upon information presented here, without further research.
@All: In almost any disaster, things get better after a while. Fukushima’s meltdowns, like the spreading Ebola crisis, is not one of them. For instance, when we reported Mutated California Sunflowers July 2012, we knew that radiation-induced mutations would get worse. Far worse. Now we’ve got even more evidence of this damage that cannot be undone. You don’t need to be able to read Japanese to understand these horrifying mutation photos of flora and fauna: http://onodekita.sblo.jp/article/57510646.html
October 3, 2014: EnviroReporter.com reaches more than 6,488 special tests and original reports including 2,442 measurements from nine affiliated Radiation Stations and 4,046 samples and radiation experiments from Radiation Station Santa Monica California. EnviroReporter.com has over 1,780,223 readers and more than 1,568,868 viewers along with the 19,857 people that have seen Radiation Station Glendale California‘s continuous online streaming. In excess of 177,739 folks have watched 88 original videos on our YouTube channel and we’ve received tens of thousands of Facebook ‘likes’ for our site, investigations and Facebook channel. We thank you for your support.
@Michael Yes, he is a brave man. He actions should be praised. He is trying to inform people so they can take action, to limit the exposure of their families to this dangerous contamination.
He talks about a black substance in his videos. In March 2013 I was sent a resin encapsulated sample of this black substance like material for testing. It had reportedly come from somewhere in the Minamisoma area Japan. A contact in Japan sent it to a friend. Here is my test chart of it.
This comment was posted on a forum discussing this test, because we didn’t know the weigh of the sample.
“I’m an expert on weighing objects (sell scales, use different ones daily, some precise to .01g). Fungus in that form does not appear to hold too much water weight and would likely weigh less than a gram given the scale. If it is thin and flakey type fungus, it may be under .25-.5g. Is it thick like a mushroom cap or more like lichen? I’ve only observed extremely thin fungi growing on concrete, and I would err on the very low side. My best guess is .3g.”
My reply
That means the black fungus sample from Japan is very, very, hot.
Test results 117 Bg Cs-137 and 58 Bq Cs-134
117 + 58 = 175 Bq x (1000 grams/0.3 grams) = 583,333 Bq/Kg of Cesium
Even if it was 10 times greater in weight 3 grams, it would still be 58,333 Bq/Kg of Cesium.
This radioactive black material has been reported collecting in hot spots on rocks, roads, plus around gutters and drains in central Japan. Other samples of this substance tested by other researchers were a lot more radioactive than the sample I tested. Other dangerous radioactive isotopes were detected in those samples.
It would be dangerous breathing in or ingesting this material as it blows around in the environment.
The person who supplied this sample to me, went to a lot of trouble and expense, to make this sample available to researches in Australia. I would like to thank him for that.
@vital1: Those are outstanding videos made by a brave man who knows what he’s doing. I hope raddies pay attention to this gent’s videos. Mind blowing. Denise Anne and I are crossing off Tokyo on our frack-it list.
@All: VERY active, actually radioactive period since I last reported.
NATIONWIDE RADIATION REPORT 2014/10/01 at 1:00 am
40 out of 124 beta monitors are functional as of this date out of the 124 areas covered, the same number as last month but with a changing line-up: station stoppage combined with station start-up. Several significant beta stations have gone offline while a couple of crucial ones are sputtering to life. Many stations are measuring very high beta readings with four-month highs in what turned out to be a very “hot” period.
Readings of 100 CPM or more indicate significant beta radiation activity. Three times background readings could mean a hazardous situation exists and protocols discussed and reported on in EnviroReporter.com since March 11, 2011 should be noted. See that below the tilde symbol (~) before some rad readings means mathematically approximate.
Since September 1, 2014 (below in archives), Montgomery AL topped 250 CPM twice before calming down in the last week; Anchorage AK‘s beta graph is getting more active going over 50 CPM in the last week but the last two days have eased off; Fairbanks AK hit a four-month high with ~190 CPM September 28, part of a continuing uptick in beta activity at the station; Phoenix AZ tied a three-month high ~August 25 with ~210 CPM hitting the same peak September 26 right during the rains – perhaps mist impacted these very high numbers; Tuscon AZ nearly hit 345 CPM Sept. 27 remaining quite active; Little Rock AR had two strong pulses, one hitting ~350 CPM Sept. 19 with the whole period hovering around 200 CPM in a place used to 20 CPM – an increase of ten times; Fort Smith AR suddenly went even nuttier ~August 22 after having been calmer in the second week of Sept. 30 hitting 450 CPM, the highest we have recorded in a long long time in an area used to readings in the teens; Anaheim CA‘s beta graph started working August 7 then went dead completely August 15 – your tax dollars at work because a private company is supposed to keep RadNet running and clearly isn’t; Fresno CA charted ~270 CPM Sept. 12 in a town with very active beta; Bakersfield CA went berserk right after we put the last report to bed and soared to ~820 CPM and then kept jumping around but tonight is about 90 CPM; Los Angeles CA‘s beta graph stopped in March but the gamma seemed quite jumpy in September; Riverside CA‘s graph gave out September 15 after repeatedly slamming through the ‘Oh NO!’ threshold of 250 CPM; San Bernardino County CA smashed through to a four-month high August 30 and went over 250 CPM three times in this latest period; San Diego remains extremely active hitting ~580 CPM September 20 which is over FIFTY times background for the city – look at the graph and see yourself: the background is on the left hand side of the graph and the radically-higher readings on the right; Hartford CT is trending upward tying a four-month high September 28 of ~215 CPM which is over ten times its normal background; Washington DC was not too bad with it hitting ~140 CPM yesterday; not one beta monitor out of five works in Florida even after us reporting it for months – Floridians are breathing beta blind; Augusta GA no longer has a working beta graph in a very active environment, unfortunately, giving out August 25 never to return, yet; Ft. Wayne IN continues a radical trend upward hitting a one-month high Sept. 24 of ~365 CPM which is over ten times background; Baton Rouge LA‘s four-month high was hit Sept. 14 with ~225 CPM; Orono ME looks nice and cool but is marginally more active with ~30 CPM August 30 but hit 50 CPM yesterday; Baltimore MD‘s beta and gamma graphs are now ‘on’ and functioning properly which is great news and promptly soared to ~210 CPM yesterday; Worcester MA blew through ~320 CPM September 28; Grand Rapids MI hit ~295 CPM September 30; St. Paul MN went up to ~360 CPM three times in the last few days but dropped off today; St. Louis is really moving up hitting ~335 CPM September 30; Lincoln NE hit a four-month high August 3 with ~360 CPM and then its graph died and hasn’t come back, a real loss since this station is in the middle of the country and the folks there are getting significant readings of beta radiation which is oft-times man-made; Concord NH hit ~275 CPM Sept. 18, a four-month high; Albuquerque NM also hit a four-month high Sept. 19 with a sizzling ~345 CPM; Buffalo NY is increasing active hitting ~305 CPM Sept. 29 – a four-month high – when its normal background is about 20-25 CPM; New York City NY is not functioning as it hasn’t for years but its gamma gross count is sort of jumping around like LA’s gamma is – just one difference, NYC’s gamma is much more active; Syracuse NY‘s beta graph hit a new record for the year – ~240 CPM today; Charlotte NC hit a four-month high Sept. 18 with ~215 CPM; Raleigh NC hit ~170 CPM July 24 and cut out and still hasn’t come back on, a real loss in the South but we do have Radiation Station Harrisburg North Carolina for occasional rain radiation tests; holy Toledo OH is dropping and was ‘just’ ~140 CPM today; Corvalis OR hit a four-month high Sept. 15 smashing past 450 CPM in a place that has a background of under 20 CPM; Pittsburgh PA is going up in active ionizing and has remained active hitting 300 CPM yesterday; Puerto Rico‘s beta graph doesn’t work but the gamma remains low and steady; Amarillo TX went literally off the chart August 3 blasting through 1,000 CPM and is the most active beta station in the country that functions topping 890 CPM September 25/26; Dallas TX was exactly 400 CPM Sept. 21, a four-month high CPM; Ft. Worth, is trending active hitting 350 CPM, the highest in memory; Salt Lake City UT‘s beta station is still down since a huge beta increase over 200 CPM in early May and it’s gamma bears watching as it has pulses of spikes; and Madison WI hit a four-month high September 30 charting an astounding ~555 CPM.
This guy has done a great job exposing the radiation dangers in Tokyo and has taken great risks to his freedom to do so. Please watch these short video’s recently posted. I would hate to even visit Tokyo now much less live there.
Published on Sep 14, 2014 There was a black substance Horiba Radi PA1000 0.9uSv/h Takasago Junior high school Katsushika Ward in Tokyo Inspector EXP+ 1.6uSv/h apprx 520cpm https://www.youtube.com/watch?v=Miljt_Mf36Q
Beautiful Skies with Devastating Repercussions, 11th September 2014
Extract:
Solar Storms: Sometimes the most beautiful natural phenomena can have devastating consequences. When the sun ejects hot charged particles into space, the Northern Lights are created here on Earth. Occasionally the sun erupts with huge quantities of particles (Coronal Mass Ejection) that can damage the earth’s electric systems. Renowned author Mat Stein and Arnie Gundersen discuss the dangers of a large coronal mass ejection on the electrical grid and on nuclear plants worldwide.
A little good news for once. Thanks to Senator Harry Reid, who is very parsimonious in allowing matters to come to the floor of the Senate for a vote, today the U.S. has 2 new Commissioners on the Nuclear Regulatory Commission, Jeffrey M. Baran and Stephen G. Burns. They are identified as Democrats, giving the forces for “better” a 3-2 voting majority on the Commission.
Even though “It may not be within the NRC’s purview” now is the time to start bombarding the new Commissioners with pleas to pay attention to the Fukushima related radiation statistics which have appeared on this website.
If Fukushima’s Triple Meltdowns have, so far, been equivalent to ‘thousands’ of nuclear bombs (estimates), then that means the amount of radioactive contamination is increasing on the average of ‘at least’ 1 NUCLEAR BOMB PER DAY.
The two documents provided here present more evidence to support my view that the Fukushima Nuclear Disaster has, and is continuing to cause, upper atmosphere and ozone damage.
This damage to the atmosphere’s electric conductivity, ion current, and the Earth’s magnetic field is dramatically changing the world’s climate.
Climate threat from nuclear bombs – 12th December 2006
Extract:
“In addition, the ozone layer, which protects the surface of the Earth from harmful ultraviolet radiation, would be depleted by 40% over many inhabited areas and up to 70% at the poles.”
Fukushima is releasing and has released, large amounts of atmospheric radiation, by some estimates equal to thousands of nuclear bombs. This is seriously damaging the ozone layer.
Fukushima is not generating as much soot as their simulation.
KRYPTON-85
There are ~1,000 Nuclear reactors around the world. This includes nuclear power plants, research and military reactors. All these reactors release krypton-85 as part of there normal operations. The the Fukushima nuclear disaster released enormous amounts of krypton-85.
NPP Krypton-85 releases change the atmospheric electric conductivity, ion current, and the Earth’s magnetic field!
WORLD METEOROLOGICAL ORGANIZATION GLOBAL ATMOSPHERE WATCH
Extract: (This extract is from the bottom of page numbered 56 in the document.)
Importance Krypton-85 (85 Kr) is a radioactive noble gas which decays with a half-life of 10.76 years, emitting mainly β -particles of mean energy 251 keV. The main sources of Krypton-85 are the nuclear fuel reprocessing plants and various nuclear reactors.
The nuclear weapons tests in 1945-1963 contributed about 5% of the total Krypton-85 in the atmosphere, whereas its natural sources can be neglected. Radioactive decay is practically the only mechanism of Krypton-85 removal from the atmosphere.
The present background concentrations of Krypton-85 in the atmosphere are about 1 Bq/m3 and are doubling every 20 years. At this level, Krypton-85 is not dangerous for human beings, but the air ionization caused by Krypton-85 decay will affect atmospheric electric properties.
If Krypton-85 continues to increase, changes in such atmospheric processes and properties as atmospheric electric conductivity, ion current, the Earth’s magnetic field, formation of cloud condensation nuclei and 57 aerosols, and frequency of lightning may result and thus disturb the Earth’s heat balance and precipitation patterns.
These Krypton-85 induced consequences call for Krypton-85 monitoring.
Even though the Los Angeles beta graph still doesn’t work, we do and have detected an uptick in Southern California dust beta readings:
September 8, 2014
5:55 pm INT HEPA DUST from two HEPA filters, one Ionizer/HEPA filter and an exhaust fan’s blade dust buildup: 59.9 CPM^^ which is 43.6% HIGHER than background over a 35 day period. The last 17-day period was less than 14% above background August 4.
5:40 pm INT BG: 41.7 CPM^^
I like facts. They form the basis of my political opinions, and form the basis for my black box intuition which often lets me read between the lines and figure things out.
Today 9/8/14, I’ve run across at least 2 news stories saying that both AP and a private environmental group have a copy of a new 42 page report on the Diablo Canyon nuclear complex which says the complex should be shut down because of newly found geologic and seismographic data. The report was supposedly written by Dr. Michael Peck, who was for 5 years the Nuclear Regulatory Commission’s principal inspector at Diablo Canyon. The report supposedly says that the NRC is not “applying” the safety rules it set for the plant’s operation. AP says the 42 page report is not available for the public to read. I have a problem with that secrecy for three reasons:
First, no reporter, no matter how talented, can summarize 42 pages of information into a few column inches and still convey to interested parties the full import of what the report-writer has disclosed in terms of facts and opinion.
Second, the U.S. is full of smart people experienced in a variety of professional disciplines who could read the report and lend their own expertise, through commentary, to enhance public knowledge and understanding about the report’s content.
Third, the hiding of all of the detail in a detailed report written by a professional frightens his/her peers into silence. Any professional in any public health and safety discipline is going to say “Why should I allow my name to be exposed, and my family’s safety and livelihood put at risk, if my message is going to be stifled?”
One of the stories I read today concerning Dr. Peck’s report said that the owner of Diablo Canyon, PG&E, is having financial problems. I can’t comment on whether that is true, because such a conclusion takes a whole lot of reading which I have not had time to do. PG&E was in a complicated Chapter 11 bankruptcy in the early 2000’s but supposedly emerged from bankruptcy as a financially viable company, thanks in large part to the California Public Utilities Commission (CPUC) approving a rate-hike for PG&E which would produce needed increased cash flow.
What I do know is that since that bankruptcy, PG&E’s high pressure natural gas line in San Bruno exploded, killing several people (ironically including a woman CPUC employee and her daughter, whose burned bodies were found in front of their home, in positions showing they were running away from the fire before the gas-fueled blow torch we all saw on TV fried them alive.
The CPUC was conducting a detailed investigation of that explosion, and PG&E’s failure to replace very old natural gas main pipelines even though CPUC had approved other rate increases for PG&E to allow them to replace the old pipelines…something that didn’t do before the San Bruno explosion. There was a lawyer on the CPUC staff, who had been with that agency for more than 20 years, who was heading up that investigation. However, PG&E apparently vehemently complained to Gov. Jerry Brown’s political minions about what the CPUC investigation was uncovering. As a result, CPUC got a new “safety director” and a new “head in-house lawyer”. Less than a year ago, all of the CPUC’s in-house lawyers and in-house administrative law judges were warned (aka threatened) by these two politically appointed clowns to lay-off PG&E. The working atmosphere was so frightening, lawyers from CPUC’s in-house legal department told many, many lawyers practicing in the regulated utility field that they had been threatened. The 20+ year CPUC lawyer who was running the investigation of the San Bruno explosion was specifically told to “stop it” and he refused. Once he refused, he was fired and his firing was reported in most of the major Northern California newspapers. The man’s firing shows all of us the “regulatory climate” at CPUC, inaction with respect to the San Bruno explosion and a reign of terror being conducted on PG&E’s behalf. Mind you, the CPUC has little to say about the actual nuclear safety issues at Diablo Canyon. However, PG&E’s lobbying muscle there speaks volumes to me, because that’s the profession I understand.
Nuclear safety issues at Diablo Canyon are the province of the U.S. Nuclear Regulatory Commission (NRC). You can bet your last dollar that PG&E’s lobbyists are camped out on the door steps of the NRC staff and commissioners on a daily basis. In 2009 President Obama appointed Greg Jaczko as Chairman of the NRC. The choice was blessed by Sen. Harry Reid, who is profoundly opposed to the nuclear industry using the NRC and its Commissioners and staff as puppets and his state as a nuclear dumping ground. The pro-nuclear industry Republicans on the NRC immediately began creating chaos at all levels of the NRC, and the nuclear industry ultimately found some cooperative women NRS staffers to make spurious sex-discrimination claims against Mr. Jaczko as a means of forcing him out. Republican troll Michelle Malkin crowed about Mr. Jaczko’s departure in a syndicated column which she entitled “Jaczko the Jerk” and which is still found on the internet. The NRC staff and the Commission itself has been in chaos ever since, dancing like marionettes whose strings are pulled by the nuclear industry.
As a result, given the fact that the full content this new 42 page report on the geology at Diablo Canyon is being hidden from the public is no surprise to me. If PG&E is exercising such profound muscle at the CPUC there’s no reason to expect that their lobbyists at the NRC are no less effective.
Extreme UV levels are now being detected in both Northern and Southern Hemisphere, spring and summer. I am suggesting that the increase in Northern hemisphere UV has been caused by atmosphere damage from the large amount of ionizing radiation released into the Northern Hemisphere upper atmosphere, by the Fukushima Nuclear Disaster.
This will potentially lead to significant increases in skin cancer rates and eye cataracts, in the both the human and animal populations. In my opinion, it is important to now monitor both local ionizing and daily UV radiation levels. During UV events, if possible, stay out of the Sun, or wear good UV rated wrap around sunglasses and protective clothing, plus research UV protection methods.
If you run a public available live radiation monitoring station, also consider providing links to local UV monitoring on your page. Do a search, and you will find sites that provide local, or regional daily UV level forecasts.
“You can safely say that 2011 was very atypical: In over 30 years of satellite records, we hadn’t seen any time where it was this cold for this long,” said Susan E. Strahan, an atmospheric scientist at NASA Goddard Space Flight Center in Greenbelt, Md., and main author of the new paper, which was recently published in the Journal of Geophysical Research-Atmospheres.”
Comment: (My opinion)
“You can safely say that 2011 was very atypical”
I observed in 2011, that small solar storm events where producing Northern Light displays, way down into Southern states in the USA. I have been a sun watcher for many years, and know it was very unusual for such small solar events, to produce such Northern Light displays, so far south. Our atmosphere is an electrical system, and these unusual Northern lights displays indicated that the electrical dynamics of the upper atmosphere had been changed by the large radioactive releases from the Fukushima Nuclear Disaster.
Chlorofluorocarbons (CFC), the main cause of atmospheric Ozone destruction had been reduced significantly. Because of a worldwide ban on CFC’s, by 2010 the Southern Ozone hole was showing signs of repair. This 1994 research paper indicates a cause, upper atmosphere damage from the large Fukushima krypton-85 releases.
Article:
Climate risks by radioactive krypton-85 from nuclear fission Atmospheric-electrical and air-chemical effects of ionizing radiation in the atmosphere.
Extract:
“The study shows that krypton-85 from nuclear fission enhances air ionization and, thus, interferes with the atmospheric-electrical system and the water balance of the earth atmosphere.”
Krypton-85 and other ionizing isotope contamination in the upper atmosphere has changed the upper atmosphere dynamics, and is creating extreme seasonal Northern Hemisphere UV and weather events.
UV levels here can now frequently reach high to extreme levels in both the Northern and Southern Hemispheres, during spring and summer. During these events it is suggested, if possible, to stay out of the sun, or wear good UV rated sunglasses and protective clothing.
These extreme UV levels would also be damaging plants and animals, plus it also can potentially create virus and plant mutations. There is independent testing now, indicating that more damaging UVC is also now reaching the Earth’s surface. (The studies linked below don’t take into account UVC atmospheric penetration.)
The large number of Northern hemisphere multiple species die offs that are being reported, are possibly occurring because of a combination of ecosystem bio-accumulation of radioactive isotope contamination, chemical toxins, and from increase UV levels.
Out side of the radioactive contamination hot spots in Japan, increased oceanic and terrestrial UV radiation levels proportionally, may be causing more ecosystem damage than radioactive isotopes surface fallout. The resultant increased levels of UVB and UVC that are now reaching the Earth’s surface are directly damaging individual organisms, and significantly impacting the oceanic and terrestrial food supply.
Extract:
“Aquatic wildlife is particularly vulnerable Phytoplankton are at the start of the aquatic food chain, which account for 30 per cent of the world’s intake of animal protein. Phytoplankton productivity is restricted to the upper layer of the water where sufficient light is available. However, even at current levels, solar UV-B radiation limits reproduction and growth. A small increase in UV-B exposure could significantly reduce the size of plankton populations, which affects the environment in two ways. With less organic matter in the upper layers of the water, UV radiation can penetrate deeper into the water and affect more complex plants and animals living there. Solar UV radiation directly damages fish, shrimp, crab, amphibians and other animals during their early development. Pollution of the water by toxic substances may heighten the adverse effects of UV radiation, working its way up the food chain. Furthermore less plankton means less food for the animals that prey on them and a reduction in fish stocks, already depleted by overfishing.”
This short animation of Northern, and Southern Hemisphere air circulation, shows why we can get detections so far south.
Rain Water Test Report
Summary:
Significant traces of Lead Pb-210 and Beryllium Be-7 were detected in the rain water. This is surprising considering the local background levels were so low for August. August 2014 had 209.6 mm of rain compared to July’s rain fall of 14.5 mm, so a lot more rain flowed through the filter this month.
Beryllium Be-7 can be made by spallation in the upper atmosphere during solar evens, and takes around two weeks to reach the surface. Lead Pb-210 is a decay daughter of Radon Rn-222.
This short animation of Northern, and Southern Hemisphere air circulation, shows why we can get detections so far south.
Summary
August’s 2014 monthly average background level was the lowest August monthly average since pre-Fukushima at 4% above the pre-Fukushima month average. August 2014 background levels here have been very stable. This August saw a longer period of Southern Ocean air flows than previous years for August, It is still quite cold here even now considering the time of year.
Even thought the local background level for August 2014 is showing a drop, the August rain water test is showing an increases in Lead Pb-210 and Beryllium Be-7. I will post test chart of the August rainwater test, and a report soon.
Technical details:
(Note: The 4yr average referred to in the charts, is the 4yr pre-Fukushima average.)
August 2014 was 4% above the 4 year pre-Fukushima average.
2014/09/01 at 4:00 pm
40 out of 124 beta monitors are functional as of this date out of the 124 areas covered, a drop of 10 percent. Several significant beta stations have gone offline while a couple of crucial ones are sputtering to life. There is a noticeable sharp beta radiation trend upwards at a number of stations across the country but not as bad as the last reporting period. The following three-week summation allows for a larger data set to apprise than the last weekly report.
Readings of 100 CPM or more indicate significant beta radiation activity. Three times background readings could mean a hazardous situation exists and protocols discussed and reported on in EnviroReporter.com since March 11, 2011 should be noted. See that below the tilde symbol (~) before some rad readings means mathematically approximate.
Since August 6 (below in archives), Montgomery AL hit its highest reading since May 26 with a ~270 CPM August 15; Anchorage AK‘s beta graph is still at under 20 CPM all three weeks but burped up into the 40 CPM area twice around August 20-25; Fairbanks AK hit a four-month high with ~150 CPM August 14, part of a continuing uptick in beta activity at the station; Phoenix AZ hit a three-month high ~August 25 with ~210 CPM; Tuscon AZ was over ~350 CPM August 28 remaining quite active; Little Rock AR hit over 380 CPM August 10 trending more active in pulses in an area used to ~20 CPM background; Fort Smith AR suddenly went nuts ~August 22 after having been calmer in the second week of August hitting ~265 CPM~August 24; Anaheim CA‘s beta graph started working August 7 then went dead completely August 15; Fresno CA charted ~270 CPM August 27; Bakersfield CA still coming back online with both beta and gamma in a most welcome development with the beta hitting ~545 CPM August 7; Los Angeles CA‘s beta graph stopped in March but the gamma remains normal and EnviroReporter.com‘s regular test of sea water at Manhattan Beach and Playa Del Rey in Southern California came back normal with no signs of the Sea of Fuku Goo having arrived yet; Riverside CA hit 300 CPM twice in the last period August 12 and August 30; San Bernardino County CA smashed through to a four-month high August 30; San Diego remains extremely active hitting ~200 CPM several times in the last three weeks which is a dozen times background for the city; Hartford CT is trending upward hitting a four-month high August 12 of ~215 CPM which is over ten times its normal background; Washington DC also notched a two-week high August 27 with ~145 CPM; not one beta monitor out of five works in Florida even after us reporting it three weeks in a row – Floridians are breathing beta blind; Augusta GA no longer has a working beta graph in a very active environment, unfortunately; Ft. Wayne IN continues a radical trend upward hitting a four-month high August 24 of 405 CPM which is over ten times background; Baton Rouge LA‘s four-month high was hit August 25 with ~145 CPM; Orono ME looks nice and cool but is marginally more active with ~30 CPM August 30; Baltimore MD‘s beta and gamma graphs are now ‘on’ and functioning properly which is great news; Worcester MA blew through ~235 CPM August 10; Grand Rapids MI hit ~260 CPM August 25; St. Paul MN went up to ~400 CPM August 20, a four-month high by far; St. Louis is trending active hitting ~230 CPM August 25; Lincoln NE hit a four-month high August 3 with ~360 CPM and then its graph died and hasn’t come back, a real loss since this station is in the middle of the country; Concord NH hit ~195 CPM August 27; Albuquerque NM spiked to ~350 CPM several times in the last three weeks with greatly heightened activity and frequency; Buffalo NY is increasing active hitting ~208 CPM August 21 when its normal background is about 20-25 CPM; New York City NY is not functioning as it hasn’t for years but its gamma gross count is sort of settling down; Syracuse NY‘s beta graph went out before hitting ~135 CPM July 27 but came back on going down to ~65 CPM the night of August 3 before stopping then coming on again only to totally die August 24; Charlotte NC hit a four-month high August 29 with ~180 CPM; Raleigh NC hit ~170 CPM July 24 and cut out and still hasn’t come back on, a real loss in the South; holy Toledo OH is going through the roof right at the same time as their drinking water crisis eases with the beta peaking at ~370 CPM August 5, a four-month high and stayed active while dropping off a bit; Corvalis OR hit ~200 CPM August 26 in a place that has a background of under 20 CPM; Pittsburgh PA‘s beta graph hit ~205 CPM August 5 in active ionizing and has remained active; Puerto Rico‘s beta graph doesn’t work but the gamma remains low and steady which makes it even cooler even with the one-day major hiccup August 25; Amarillo TX went literally off the chart August 3 blasting through 1,000 CPM and is the most active beta station in the country that functions; Dallas TX was ~300 CPM August 28; Ft. Worth, is trending active hitting ~150 CPM August 25; Salt Lake City UT‘s beta station is still down since a huge beta increase over 200 CPM in early May and it’s gamma bears watching as it has pulses of spikes; and Madison WI hit a four-month high August 22 charting an astounding 500 CPM.
September 1, 2014: EnviroReporter.com reaches more than 6,227 special tests and original reports including 2,247 measurements from nine affiliated Radiation Stations and 3,980 samples and radiation experiments from Radiation Station Santa Monica California. EnviroReporter.com has over 1,762,029 readers and more than 1,568,309 viewers along with the 19,616 people that have seen Radiation Station Glendale California‘s continuous online streaming. In excess of 175,931 folks have watched 88 original videos on our YouTube channel and we’ve received tens of thousands of Facebook ‘likes’ for our site, investigations and Facebook channel. We thank you for your support and for 6,842 considered comments that have sustained this award-winning online news organization.
2014/09/01 at 4:00 pm
40 out of 124 beta monitors are functional as of this date out of the 124 areas covered, a drop of 10 percent. Several significant beta stations have gone offline while a couple of crucial ones are sputtering to life. There is a noticeable sharp beta radiation trend upwards at a number of stations across the country but not as bad as the last reporting period. The following three-week summation allows for a larger data set to apprise than the last weekly report.
Readings of 100 CPM or more indicate significant beta radiation activity. Three times background readings could mean a hazardous situation exists and protocols discussed and reported on in EnviroReporter.com since March 11, 2011 should be noted. See that below the tilde symbol (~) before some rad readings means mathematically approximate.
Since August 6 (below in archives), Montgomery AL hit its highest reading since May 26 with a ~270 CPM August 15; Anchorage AK‘s beta graph is still at under 20 CPM all three weeks but burped up into the 40 CPM area twice around August 20-25; Fairbanks AK hit a four-month high with ~150 CPM August 14, part of a continuing uptick in beta activity at the station; Phoenix AZ hit a three-month high ~August 25 with ~210 CPM; Tuscon AZ was over ~350 CPM August 28 remaining quite active; Little Rock AR hit over 380 CPM August 10 trending more active in pulses in an area used to ~20 CPM background; Fort Smith AR suddenly went nuts ~August 22 after having been calmer in the second week of August hitting ~265 CPM~August 24; Anaheim CA‘s beta graph started working August 7 then went dead completely August 15; Fresno CA charted ~270 CPM August 27; Bakersfield CA still coming back online with both beta and gamma in a most welcome development with the beta hitting ~545 CPM August 7; Los Angeles CA‘s beta graph stopped in March but the gamma remains normal and EnviroReporter.com‘s regular test of sea water at Manhattan Beach and Playa Del Rey in Southern California came back normal with no signs of the Sea of Fuku Goo having arrived yet; Riverside CA hit 300 CPM twice in the last period August 12 and August 30; San Bernardino County CA smashed through to a four-month high August 30; San Diego remains extremely active hitting ~200 CPM several times in the last three weeks which is a dozen times background for the city; Hartford CT is trending upward hitting a four-month high August 12 of ~215 CPM which is over ten times its normal background; Washington DC also notched a two-week high August 27 with ~145 CPM; not one beta monitor out of five works in Florida even after us reporting it three weeks in a row – Floridians are breathing beta blind; Augusta GA no longer has a working beta graph in a very active environment, unfortunately; Ft. Wayne IN continues a radical trend upward hitting a four-month high August 24 of 405 CPM which is over ten times background; Baton Rouge LA‘s four-month high was hit August 25 with ~145 CPM; Orono ME looks nice and cool but is marginally more active with ~30 CPM August 30; Baltimore MD‘s beta and gamma graphs are now ‘on’ and functioning properly which is great news; Worcester MA blew through ~235 CPM August 10; Grand Rapids MI hit ~260 CPM August 25; St. Paul MN went up to ~400 CPM August 20, a four-month high by far; St. Louis is trending active hitting ~230 CPM August 25; Lincoln NE hit a four-month high August 3 with ~360 CPM and then its graph died and hasn’t come back, a real loss since this station is in the middle of the country; Concord NH hit ~195 CPM August 27; Albuquerque NM spiked to ~350 CPM several times in the last three weeks with greatly heightened activity and frequency; Buffalo NY is increasing active hitting ~208 CPM August 21 when its normal background is about 20-25 CPM; New York City NY is not functioning as it hasn’t for years but its gamma gross count is sort of settling down; Syracuse NY‘s beta graph went out before hitting ~135 CPM July 27 but came back on going down to ~65 CPM the night of August 3 before stopping then coming on again only to totally die August 24; Charlotte NC hit a four-month high August 29 with ~180 CPM; Raleigh NC hit ~170 CPM July 24 and cut out and still hasn’t come back on, a real loss in the South; holy Toledo OH is going through the roof right at the same time as their drinking water crisis eases with the beta peaking at ~370 CPM August 5, a four-month high and stayed active while dropping off a bit; Corvalis OR hit ~200 CPM August 26 in a place that has a background of under 20 CPM; Pittsburgh PA‘s beta graph hit ~205 CPM August 5 in active ionizing and has remained active; Puerto Rico‘s beta graph doesn’t work but the gamma remains low and steady which makes it even cooler even with the one-day major hiccup August 25; Amarillo TX went literally off the chart August 3 blasting through 1,000 CPM and is the most active beta station in the country that functions; Dallas TX was ~300 CPM August 28; Ft. Worth, is trending active hitting ~150 CPM August 25; Salt Lake City UT‘s beta station is still down since a huge beta increase over 200 CPM in early May and it’s gamma bears watching as it has pulses of spikes; and Madison WI hit a four-month high August 22 charting an astounding 500 CPM.
EnviroReporter.com‘s Michael Collins and Denise Anne Duffield will be testing another beach further north of Manhattan Beach today to continue keeping a close watch on Southern California waters monitoring for Fuku goo.
August 22, 2014
CONCLUSIONS: With dry sand coming in above BG but wet coming in below BG, our conclusion was that all was at background and Sea of Fuku Goo has not yet impacted this Southern California beach.
1:20 pm INT VEHICLE MANHATTAN BEACH PARKING LOT SOUTH OF PIER BACKGROUND: 36.5 CPM^^
1:05 pm EXT DRY SAND SOUTH OF MANHATTAN BEACH PIER (taken at 3 feet/1 meter above sand): ~54 CPM^^
1:00 pm EXT WET SAND SOUTH OF MANHATTAN BEACH PIER (taken at 3 feet/1 meter above sand): ~32 CPM^^
Hot rain moving through US and Canada with levels similar to 2011. – 20th August 2014.
Extract:
The Fukushima activity increase that started in early July continues to increase. High radiation levels have been measured in rain in Wisconsin, Illinois, Michigan, Ohio, and Ontario for the last couple of days. Vegetation is being affected and damaged by this rain.
UPDATE: Diane Steele took these photos of her squash and bean plants after the hot rainstorm moved through her home in Minnesota. This damage was not there prior to this rain.
Big summer thunder storm in Hemet, CA.
I threw a paper towel outside and tested it (still damp) about two hours after the rain ended.
Paper towel: 51.7
Background: 42
[Editor: rain-dampened paper towel 23.1% over background two hours after rain.]
@biggee: Thank you for this. I do not put much credence in the creator of this video or its murky conclusions. As for reporting ‘on the air’ on the threat of Fukushima to North America, nothing beats actually looking at the (usually) reliable numbers and talking about them as we already are doing. See U.S. air radiation surges higher with copy, data and video. You, biggee, need to keep those rain readings coming.
Surprised no one has put this ling up.THE NORTHERN PACIFIC IS PRETTY WELL DEAD!
Michael we need you reporting back on RENSE !
Email this to everyone you know
This short animation of Northern, and Southern Hemisphere air circulation, shows why we can get detections so far south.
Summary:
Even thought the roof rainwater water collection area that passed through the polyester filter has been nearly doubled this month, there were only been very small traces of I-129, Pb-210 and Be-7 detected. July rain fall was also low at 14.5 mm.
Test Chart
In this chart I have CPS on the Y axis to show activity, and have turned off Y log to show linear scaling.
Amarillo, TX at 1,000 cpm
Fresno, CA at 540 cpm
Ft. Wayne, IN 450 cpm
😯 These readings seem very high to me.
What is the reason?
Shouldn’t the public who live in these areas (like me) be alerted in some way to readings like this? Isn’t that why we have ‘the system’ in the first place? Is somebody ‘dropping the ball’ at the EPA or just ‘passing the buck’ somehow?
Maybe in addition to amber and other alerts on people’s phones, we should also have Rad Alerts. Unfortunately, I have a feeling that day may be coming soon.
At least for now, thanks to EnviroReporter.com, we have the NATIONWIDE RADIATION REPORT’s easy to read summary and a video explanation.
2014/08/06 at 1:00 am
44 out of 124 beta monitors are functional as of this date out of the 124 areas covered. There is a noticeable sharp beta radiation trend upwards at a number of stations across the country. Such a wide distribution of rising beta detections suggests a major source ‘upwind’ of the nation. The ongoing triple meltdowns at Fukushima Dai-ichi are such a major source.
Readings of 100 CPM or more indicate significant beta radiation activity. Note that below, the tilde symbol (~) before some rad readings means mathematically approximate.
Since July 28 (below in archives), Montgomery AL hit its highest reading since May 26 with a robust ~250 CPM August 4; Anchorage AK‘s beta graph is still at under 20 CPM all week which is terrific but its beta graph seems to have stalled on ~August 2; Fairbanks AK hit a four-month high with ~137 CPM August 4 which is a strong uptick for the station; Phoenix AZ was a mere ~115 CPM August 4; Tuscon AZ was over ~310 CPM August 4 remaining quite active; Little Rock AR hit over 200 CPM in the last week trending upward in an area used to ~20 CPM background – now ten times background readings; Fort Smith AR has been settling down hitting ~52 CPM August ~35 CPM August 5; Anaheim CA was nice and cool at ~45 CPM July 28 or so it seemed – actually the station has been flatlining since July 23 with it blanking out entirely August 1 through now; Fresno CA soared to ~540 CPM August 1 and looks to be trending aggressively upward with Bakersfield CA still coming back online with both beta and gamma in a most welcome development with the beta hitting ~170 CPM August 5; Los Angeles CA‘s beta graph stopped in March but the gamma remains normal and EnviroReporter.com‘s regular test for beta radiation in HEPA filter/ionizer dust showed lower ionization August 5; Riverside CA was way over 150 CPM every day in the last week with increasing activity; San Bernardino County CA was ~100 CPM August 5; San Diego remains very active but off its highs of 220 CPM ~August 1 which is a dozen times background for the city; Hartford CT is trending upward hitting a four-month high August 5 of 130 CPM which is over six times its normal background; Washington DC also notched a four-month high August 5 with ~160 CPM; not one beta monitor out of five works in Florida even after us reporting it three weeks in a row – Floridians are breathing beta blind; Augusta GA was over ~160 CPM twice in the last week; Ft. Wayne IN continues a radical trend upward hitting a four-month high August 4 of 450 CPM which is over a dozen times background; Baton Rouge LA‘s graph is thankfully A-okay with a high of ~140 CPM in the last week; Orono ME looks nice and cool but is marginally more active with ~30 CPM August 5; Baltimore MD‘s beta and gamma graphs are now ‘on’ but not functioning properly; Worcester MA blew through ~235 CPM July 28 and hit ~152 CPM August 4; Grand Rapids MI dropped then went higher hitting ~345 CPM July 28 but was ‘just’ ~200 CPM August 5; St. Paul MN went up to ~300 CPM in the last week; St. Louis is trending active hitting ~175 CPM August 4; Lincoln NE hit a four-month high August 3 with ~360 CPM; Concord NH hit ~220 CPM August 5 nearly tying a four-month high; Albuquerque NM spiked to ~325 CPM July 26 then its graph seems to have stopped the night of August 3 which is not good since this site is one of the closest in the nation to the troubled WIPP facility in same; Buffalo NY is increasing active hitting ~170 CPM August 5 when its normal background is about 20-25 CPM; New York City NY is not functioning as it hasn’t for years but its gamma gross count is sort of settling down; Syracuse NY‘s beta graph went out before hitting ~135 CPM July 27 but came back on going down to ~65 CPM the night of August 3 before stopping as of the time of this report; Charlotte NC is picking up repeatedly hitting over 100 CPM and was ~130 CPM July 27 at its height but has eased to just ~35 CPM the evening of August 5; Raleigh NC hit ~170 CPM July 24 and cut out and still hasn’t come back on; holy Toledo OH is going through the roof right at the same time as their drinking water crisis eases with the beta peaking at ~370 CPM August 5, a four-month high; Corvalis OR hit ~145 CPM July 26 and has kept going up hitting a four-month high August 4 with a whopping ~235 CPM August 4 in a place that has a background of under 20 CPM; Pittsburgh PA‘s beta graph hit ~205 CPM August 5 in active ionizing; Puerto Rico‘s beta graph doesn’t work but the gamma remains low and steady which makes it even cooler even with the one-day data hiccup August 3; Amarillo TX went literally off the chart August 3 blasting through 1,000 CPM and you can tell this is no anomaly; Dallas TX was ~270 CPM August 4; Ft. Worth, is trending upward hitting ~180 CPM August 3; Salt Lake City UT‘s beta station is still down since a huge beta increase over 200 CPM in early May and it’s gamma bears watching as it has pulses of spikes; and Madison WI hit a four-month high August 4 nearly hitting 500 CPM.
This short animation of Northern, and Southern Hemisphere air circulation, shows why we can get detections so far south.
Summary
July’s 2014 monthly average background level is the same as July 2013, 5% above the pre-Fukushima average. This is less than the 9% above average for 2012.
July 2014 background levels here have been very stable. This generally occurs every winter, as we get increased Southern Ocean air flows.
Note:
The monitoring Geiger counter has been in the same room, and room location, data logging background radiation levels, over the years. This year we had to do much needed renovations to the room. If you saw the room before the renovations, you would understand why. : )
Since May, the room where the monitoring Geiger counter is located, has had the ceiling, roof over the room, and carpet replaced with new materials, plus the walls have been newly painted. The wooden furniture the GammaScout Geiger counter sits on has also been changed. It is still in the same location in the room.
Overall as far as I can tell, this has not significantly changed the ambient background. If it has, it is by a very small amount.
Technical details:
(Note: The 4yr average referred to in the charts, is the 4yr pre-Fukushima average.)
July 2014 was 5% above the 4 year pre-Fukushima average.
Disclaimer: This is an amateur volunteer run service. Human error can provide incorrect information, and equipment malfunction can produce false readings. Do not rely on, or take action upon information presented here, without further research.
Thanks, Michael! I also ran across this site, which is showing levels “below detection” across southern CA. Sounds to me like the worst of it isn’t here yet.
@Kim et al: We sure do and here they are below and the results indicate that the Sea of Fuku Goo hasn’t hit Los Angeles, yet. Keep those Hemet rain measurements coming!
August 3, 2014
4:10 pm RAIN gathered 0.5 to 1.0 hours of deposition: 45.8 CPM^^^ or essentially background at 15.1% which is the conservative limit of the Inspector’s margin of error, =/-15%.
3:30 pm BG: 39.8 CPM^^^
11:30 am RAIN from overnight accumulation with on new rain for two hours: 38.4 CPM^^^
11:15 am BG: 39.3 CPM^^^
August 2, 2014
11:16 pm RAIN: 51.6 cpm^^^ which is 31.6% HIGHER THAN BACKGROUND which is not enough in excess of the background to be of significance according to us.
11:00 pm KELP gathered by waterside in Playa Del Rey, California with Denise Anne & tested at Radiation Station Santa Monica: 48.2 CPM^^^ which is 23.0% HIGHER THAN BACKGROUND but is considered insignificant by us because of the ‘natural’ radiation inherent in the plant.
10:47 pm INT BG: 39.2 CPM^^^
East Los Angeles,ca 10 minute paper towel wipe test at 10:05 pm. Background internal 44 cpm.
The wet paper towel came in at 210cpm.
Radon in the rain. Now raining heavier.
Hector
Moderate showers in East Los Angeles,ca at 9:35pm. Dose rate 24uR/hr external. Typical external dose for this are is 11-13uR/hr.
Hector
WB Johnson DSM-500+energy compensated gm probe.
Cal 4/2014
August 1, 2014: EnviroReporter.com reaches more than 6,015 special tests and original reports including 2,116 measurements from nine affiliated Radiation Stations and 3,899 samples and radiation experiments from Radiation Station Santa Monica California. EnviroReporter.com has over 1,745,585 readers and more than 1,567,663 viewers along with the 19,365 people that have seen Radiation Station Glendale California‘s continuous online streaming. In excess of 172,833 folks have watched 87 original videos on our YouTube channel and we’ve received tens of thousands of Facebook ‘likes’ for our site, investigations and Facebook channel. We thank you and the 6,767 EnviroReporter.com commenters that have sustained this award-winning online news organization.
@Craig Daniels: Thank you for this astute comment and the excellent, detailed work that you have done – check Craig’s work out, folks. I’m aware of your view that this may not be the most valid comparison but do note that I call reaching the 100 Counts Per Minute (CPM) level informally as the “uh-oh” zone. Indeed, it really becomes the uh-oh zone when there is a level of triple background (BG). This is very conservative (meaning, for the readers, we consider 3 x BG to get into the Hot Zone) when, in fact, I am looking solely at beta emissions as the determinate divided by the background. Yes, our ground/roof accumulation based gamma/beta background counts do not directly associate with the beta readings in the EPA beta graphs, but I make sure to make clear that the beta BG levels can be teased out of the different beta graphs through analysis of long trends. I’ve done this by ‘saving’ such graphs for a long time, much longer than the four month time periods in the US EPA RadNet graphs raddies see in the graphs online at EnviroReporter.com.
So, Craig, it would be more accurate to do what you will hear more of in our next video – going up right now – where I discuss beta readings versus beta background. Three times background is considered “significant” by the federal EPA Region 9 and is a threshold for considering a material and/or environment to trip a hazardous materials response by the California Highway Patrol according to Nuclear Regulatory Commission documents. As you will see/hear in our Radiation Report July 30, 2014, if you look at a site like San Diego with a normal beta range of ~15 to ~20 CPM and the beta graph is spiking to 90 CPM, that is over four times background, and definitely troublesome, even though the spike hasn’t hit 100 CPM.
Yours is an excellent comment, Craig, and I hope you find our second video more explanatory and “oranges to oranges.” We look forward to more discussion of these crucial subjects with you and the folks on Enenews with whom you’ve been discussing this with. Thank you.
* Thanks for your easy access to EPA-RadNet graphs.
* Concerning your 7/24 US Radiation Report video, when (at 2 minutes in) you cite volatile air filter based RadNet beta counts/min –in comparison to (essentially) ground/roof accumulation based gamma background counts/min –well: how can there be a valid comparison?
This strikes me as being “Apples to oranges”. (You might want to ask a trusted rad guy like Fairewinds’ Marco Kaltofen for an opinion on that.)
As a reminder, there are only 5 days left to submit your comment to the EPA telling them no thank you to increasing radioactive release limits of radioactive emissions from nuclear power plants.
At present levels, studies already show higher incidences of childhood leukemia in children living near/downwind of nuclear power plants:
2014/07/28 at 10:45 pm
43 out of 124 beta monitors are functional as of this date out of the 124 areas covered. Two very important California stations – Fresno and San Diego – are online which is terrific. Sometimes these beta graphs will appear to have stopped only to start up again. One important graph in Riverside California has been down since about July 23 which would be a real loss for folks in the Inland Empire. Hopefully, like Fresno and San Diego, the Riverside station comes back up. San Diego continues its (almost) inexplicable march higher in the beta readings as are a number of stations nationwide.
Readings of 100 CPM or more indicate significant beta radiation activity. Note that below, the tilde symbol (~) before some rad readings means mathematically approximate.
Since July 21 (below in archives), Montgomery AL is still bouncing around hitting ~160 CPM July 26; Anchorage AK‘s beta graph is still at under 20 CPM all week which is terrific; Fairbanks AK hit ~48 CPM July 28; Phoenix AZ was a mere ~60 CPM July 28 though it was over 100 CPM four times in the last week; Tuscon AZ hit nearly ~320 CPM July 26; Little Rock AR topped out at ~270 CPM July 24; Fort Smith AR was just ~45 CPM July 28; Anaheim CA was nice and cool at ~45 CPM July 28; Fresno CA soared to ~270 CPM in the last week with Bakersfield CA still being MIA with Bakersfield beta and gamma; Los Angeles CA‘s beta graph stopped in March but the gamma remains normal; Riverside CA hit ~110 CPM July 23, the day of its last beta reading showing now; San Bernardino County CA was a reasonable 50 CPM yestertoday; San Diego reached ~155 CPM July 26; Hartford CT was ~110 CPM July 28; Washington DC hit ~110 CPM July 25; not one beta monitor out of five works in Florida even after us reporting it three weeks in a row – Floridians are breathing beta blind; Augusta GA rose to ~230 CPM July 25; Ft. Wayne IN smashed through ~255 CPM July 18 and then nearly matched that twice in the last week; Baton Rouge LA‘s graph seems to have gone on the fritz Jlu 25; Orono ME looks nice and cool showing how the farthest away station from Fukushima usually has the lowest beta radiation but hit a negligible ~15 July 28; Baltimore MD‘s beta and gamma graphs are still out; Worcester MA blew through ~235 CPM July 28; Grand Rapids MI dropped then went higher hitting ~345 CPM July 28; St. Paul MN went soared to ~170 CPM July 25 but settled to 50 CPM July 27; St. Louis is up hitting ~180 CPM July 28; Lincoln NE registered 350 CPM in the last week; Concord NH smashed through ~225 CPM July 26 setting a four-month high; Albuquerque NM spiked to ~325 CPM July 26; Buffalo NY hit to ~150 CPM July 26; New York City NY is not functioning as it hasn’t for years but its gamma gross count is settling down; Syracuse NY‘s beta graph went out before hitting ~135 CPM July 27; Charlotte NC is picking up repeatedly hitting over 100 CPM and was ~130 CPM July 27 at its height; Raleigh NC hit ~170 CPM July 24 and cut out; holy Toledo OH reached ~145 CPM July 26; Corvalis OR hit ~145 CPM July 26; Pittsburgh PA‘s beta graph hit ~95 CPM July 27; Puerto Rico‘s beta graph doesn’t work but the gamma remains low and steady which makes it even cooler; Amarillo TX was ‘only’ ~147 CPM July 26 in a week that saw the beta blast past 660 CPM July 24; Dallas TX was ~195 CPM July 25; Ft. Worth, was just 40 CPM July 26; Salt Lake City UT‘s beta station is still down since a huge beta increase over 200 CPM in early May and it’s gamma bears watching though it settled down in the last few days; and Madison WI hit ~320 CPM July 27 on a higher beta trajectory.
@Chase: Thank you so much. Very interesting advice but your optimal recommendation is to report on 10 locations in 30 seconds which sounds a little too fast for such an important subject. But we’re up for an experiment and want your raddie friends at the sites you habituate to participate. Share the link to this video, “U.S. Radiation Report 24 July 2014” at http://youtu.be/P6nf22rcPMY and ask them what they think. Perhaps making the report a short commercial-like video is the way to go but it just might be that raddies might want a little more meat on the bones. Please share any results.
Very informative. Should be a mini segment on the NBC National News. (ha)
Suggestion:
Make a weekly NATIONWIDE Radiation Reports – TOP 10. Make the video less than 60 seconds. 30 seconds is optimal. The shorter and more like a commercial the video is, the more likely people will watch.
Amarillo has always been the worst from what I remember over the last couple of years.
Fort Wayne, IN has also had ongoing issues too.
Salt Lake City, UT really makes one wonder. They should at least post a note as to why a unit is offline and when it is supposed to be working again. How hard is that?
With our Radiation Stations kicking it up a notch with even more invaluable radiation readings, we thought we’d do the same thing by YouTubing our weekly Nationwide Radiation Report to give raddies a one-stop-shop to peruse the country’s beta and gamma readings. We hope you like it and welcome any comments you may have here or over on our YouTube channel.
East Los Angeles, CA 97 degrees in the shade!! Gamma ambient dose reading at 12:44pm.
13uR/h- normal range
Hector
WB Johnston Instruments DSM-500
calibrated April 2014
@Chase, lester et al: Thank you so much! These weekly reports will also be coming out soon in videos so we can also walk you through the graphs describing what is hot and what is not. By having these Nationwide Radiation Reports archived online, along with daily readings of 124 sites nationwide available 24/7, 365 days a year at RadNet Air Monitoring, it allows us to keep you informed of the big picture as well as the hot spots. And is it hot this week? Oh yes and the latest report doesn’t even include the latest highly radioactive rain detected by Radiation Station Harrisburg, North Carolina, which poured in at nearly 7 times background!
Of course, EnviroReporter.com has another huge exposé in the works that we’ll be publishing soon that will blow your socks off.
2014/07/21 at 11:20 pm
42 out of 124 beta monitors are functional as of this date out of the 124 areas covered. Two very important California stations – Fresno and San Diego – seem to have gone offline which is very problematic as the beta radiation we’re looking for flows from west to east and California is on, obviously, the Left Coast. What comes here first heads east. Overall, there is a significant trend sharply upwards this week as the following readings show.
Readings of 100 CPM or more indicate significant beta radiation activity. Note that below, the tilde symbol (~) before some rad readings means mathematically approximate.
Since July 14 (below in archives), Montgomery AL is bouncing around hitting 155 CPM July 18; Anchorage AK‘s beta graph is working again and still at under 20 CPM July 21; Fairbanks AK hit ~90 CPM in the last week; Phoenix AZ‘s graph looks to be live again with ~90 CPM July 20 which is still way lower than before; Tuscon AZ is still bouncing around and hitting nearly ~195 CPM in this latest period; Little Rock AR dropped to ~60 CPM July; Fort Smith AR is getting busy too but a a lot cooler at under 50 CPM since July 17; Anaheim CA is nice and cool at ~20 CPM today but our very own Radiation Station Glendale California is showing marked jumps in the low 40s CPMs hitting 47 CPM in the last hour; Fresno CA‘s graph cut our July 18 joining Bakersfield CA as being MIA with Bakersfield not even having a gamma graph in this town that read extremely high before the monitors cut out long ago; Radiation Station Pacifica California, about a 100 miles to the west, is showing ~32 CPM July 21; Los Angeles CA‘s beta graph stopped in March but the gamma is still not very active; Riverside CA remains active hitting ~90 CPM July 21; San Bernardino County CA was a reasonable 50 CPM yestertoday; San Diego is bottoming out nicely at ~25 CPM July 18 and then the graph stopped; Hartford CT was ~60 CPM July 21; Washington DC hit ~110 CPM in the last week; not one beta monitor out of five works in Florida even after us reporting it two weeks in a row; Augusta GA rose to ~147 CPM July 21; Ft. Wayne IN smashed through ~255 CPM July 18 and then the graph cuts out; Baton Rouge LA hit ~73 CPM in an active week trending upward; Orono ME looks nice and cool showing how the farthest away station from Fukushima usually has the lowest beta radiation but hit a negligible ~20 today; Baltimore MD‘s beta and gamma graphs are still out which is troubling but apparently not enough to anyone to do something about it; Grand Rapids MI is radically trending higher hitting ~260 CPM today; St. Paul MN went soared to ~150 CPM July 21; St. Louis is heading up and up hitting over 200 CPM today; Lincoln NE sailed over ~360 CPM in the last week; Albuquerque NM peaked at ~370 CPM in the last week; Buffalo NY jumped to ~180 CPM in this latest period; New York City NY is not functioning as it hasn’t for years but its gamma gross count is getting busy; Syracuse NY‘s beta graph is getting jumpy hitting ~125 CPM in the last week; Charlotte NC is picking up repeatedly hitting over 100 CPM and was ~120 CPM today at its height; Raleigh NC eased to ~50 CPM today after a jumpy week; holy Toledo OH jumped to over 150 CPM three times in the last few days; Corvalis OR hit ~150 CPM July 19; Pittsburgh PA‘s beta graph hit ~150 CPM today; Puerto Rico‘s beta graph doesn’t work but the gamma remains low and steady; Amarillo TX continues to astound with ~640 CPM July 20; Dallas TX was “just” ~80 CPM today; the whole state of Texas, save Ft. Worth, is getting hammered but lack of beta information – OOPS! Ft. Worth his ~125 CPM today; Salt Lake City UT‘s beta station is still down since a huge beta increase over 200 CPM in early May and it’s gamma bears watching; Charleston WV is still out after nearly hitting 400 CPM in March then the beta graph going belly up March 13 but the gamma graph works and is getting very active; and Madison WI hit ~192 CPM July 19.
No, it’s not a Fuku cloud; it’s just lightening. As we reported in Beta Watch, radiation impacted sea mist can travel over 100 miles inland. We also reported on March 11, 2014 in Fukushima – The Perfect Crime? that the Sea of Fuku Goo has been detected as far south as Capitola which is just up the coast from Salinas. Beware the lightening and play it safe by not eating any of the local seafood or any, for that matter, from the northeast Pacific.
Emergency Action Alert for San Benito County appeared on TV today starting around 2:55 pm 7/20/14. Advising everyone to go inside and stay away from the windows and doors. A severe lightening storm was stationary near Pinnacles National monument. Could this be a Fuku cloud?
Stay inside? Still not cancelled at 5:00 PM PST. I live in Salinas CA.
@biggee: Thank you for this latest and shockingly high rain radiation reading. As we have reported repeatedly based on a Nuclear Regulatory Commission obtained by EnviroReporter.com, the California Highway Patrol considers anything three times background to trigger a hazardous materials situation. Your readings, biggee, are triple this haz-mat trip wire. EnviroReporter.com maintains that rain this hot should be avoided by young women, pregnant women and children.
@All: The beta radiation in the western Los Angeles basin has risen considerably since we last tested it in June according to our monthly HEPA filters debris tests.
July 17, 2014
6:00pm INT HEPA DUST from two HEPA filters, one Ionizer/HEPA filter and an exhaust fan’s blade dust buildup: 74.6 CPM^^ which is 64.7% HIGHER than background over a 31 day period. This is over 25% higher per day as the previous period that ended June 16, 2014. Los Angeles RadNet beta stationstill not functioning after working for three years after the Fukushima triple meltdowns began.
5:30pm INT BG: 45.3 CPM^^
RADIATION STATION HARRISBURG NC…report for 7/15/2014
Heavy thunder/lightning storm from W to E @ around 4:30 pm
1…319.8 cpm
2….33.7 cpm background
……..9.49 X background
Thank you Deeann for that notice below. The more I read about the state of the nuclear power industry, the more I have to wonder about all those assumptions that are made at the outset of the building, expansion, and nuclear plant certification renewal programs. The existing rules, and policies it seems, turned out to be “outdated” based on assumptions that were wrong in many respects. Meaning, historically, the situation just didn’t turn out that way the way they expected. It never does, of course. But, that is the motivation for updating the rules.
Now, it seems, the stakeholders want to release even more radiation during normal operations. If you read through the link to the EPA document, you will see that part of what they are doing is balancing costs against risks.
Are the stakeholders intending to increase safety for people and the environment? It seems more likely that they wish the EPA to change the rules to reduce their costs and potential liability. More radiation released into the environment cannot produce greater safety. Can a case be made to state what level of expense is required to produce acceptably low levels of radiation that cannot harm us or the environment? Will the EPA be able to make such a judgement? Will their determination be based on facts, or additional assumptions? How much additional radiation would you like to breathe, eat, or sprinkle on your garden?
2014/07/14 at 5:05 pm
Up five stations since last week, 44 out of 124 beta monitors are functional as of this date out of the 124 areas covered. Albuquerque, New Mexico is back online. That station is one of the closest to the troubled, and radiation-leaking WIPP facility in the Land of Enchantment.
Readings of 100 CPM or more indicate significant beta radiation activity. Note that below, the tilde symbol (~) before some rad readings means mathematically approximate.
Since July 7 (below in archives), Montgomery AL has settled down to ~30 CPM today; Anchorage AK‘s beta graph is working again and so nicely low; Fairbanks AK eased up and is ~40 CPM today; Phoenix AZ‘s graph looks to be live again with ~40 CPM which is way lower than before; Tuscon AZ is still bouncing around considerably over 100 CPM hitting ~385 CPM July 12; Little Rock AR is still picking up hitting ~165 CPM today; Fort Smith AR is getting busy too but a little cooler at ~90 CPM today; Anaheim CA is nice and cool at ~30 CPM today but our very own Radiation Station Glendale California is showing marked jumps in the low 30 CPMs; Fresno CA has is coming in at 35 CPM this afternoon, which is quite low for the scenic city; Radiation Station Pacifica California, about a 100 miles to the west, is showing tangible heightened radiation today coming in at about 3 times its background at 40 CPM; Los Angeles CA‘s beta graph stopped in March but the gamma is not very active; Riverside CA remains active but eased up to ~60 CPM today; San Bernardino County CA was a reasonable ~60 CPM today; San Diego is bottoming out nicely at ~19 CPM today; Hartford CT hit the threshold 100 CPM July 12; Washington DC at ~65 CPM today; not one beta monitor out of five works in Florida even after us reporting it last week; Augusta GA settled down to 65 CPM today; Ft. Wayne IN hit ~155 CPM today; Baton Rouge LA topped a three month high July 13 with a whopping 150 CPM; Orono ME looks nice and cool showing how the farthest away station from Fukushima has the lowest beta radiation with ~7 CPM today (!!!); Baltimore MD‘s beta and gamma graphs are still out; Grand Rapids MI dipped to just ~24 CPM July 12; St. Paul MN went soared to ~180 CPM July 12; St. Louis remains active with ~75 CPM today; Lincoln NE hitting a sizzling 250 CPM today in a state known for beef production and high beta radiation in its atmosphere judging from the numbers; Albuquerque NM‘s beta station is now online after peaking at ~335 CPM June 22 with the previous high being ~417 CPM April Fools Day – today was a mere ~65 CPM even with the continuing reports out of the nearby WIPP; Buffalo NY was ~70 CPM yesterday; New York City NY is not functioning as it hasn’t for years but its gamma gross count has leveled out somewhat; Syracuse NY‘s beta graph is getting jumpy hitting ~115 CPM today; Charlotte NC is picking up repeatedly hitting over 100 CPM but is ~60 CPM today; Raleigh NC eased to ~40 CPM today; holy Toledo OH jumped to ~177 CPM ~July 5 but is ~97 CPM today; Corvalis OR is just ~38 CPM today; Pittsburgh PA‘s beta graph hit a hot ~260 CPM July 12; Puerto Rico‘s beta graph doesn’t work but the gamma is still low and steady; Amarillo TX continues to amaze with ~475 CPM July 12; Dallas TX hit ~270 CPM on the 4th of July but dropped to ~25 CPM today in a most welcome reversal; the whole state of Texas, save Ft. Worth, is getting hammered but lack of beta information; Salt Lake City UT‘s beta station is still down since a huge beta increase over 200 CPM in early May; Charleston WV is still out after nearly hitting 400 CPM in March then the beta graph going belly up March 13 but the gamma graph works and is getting active; and Madison WI hit ~265 CPM July 13 but had reached ~295 CPM May 28, 2014.
The EPA is asking for public comments on their new attempt to raise the amount of radiation emitted from nuclear power plants.
This summary explains what they want to do:
“This Advance Notice of Proposed Rulemaking (ANPR) requests public comment and information on potential approaches to updating the Environmental Protection Agency’s “Environmental Radiation Protection Standards for Nuclear Power Operations” (40 CFR part 190). These standards, originally issued in 1977, limit radiation releases and doses to the public from normal operation of nuclear power plants and other uranium fuel cycle facilities—that is, facilities involved in the milling, conversion, fabrication, use and reprocessing of uranium fuel for generating commercial electrical power. These standards were the earliest radiation rules developed by EPA and are based on nuclear power technology and the understanding of radiation biology current at that time. The Nuclear Regulatory Commission (NRC) is responsible for implementing and enforcing these standards.”
East Los Angeles external gamma ambient dose at 1:05pm. 12 microrems per hour. Normal for this area.
Hector
Wb Johnson Instruments GSM-500 with energy compensated probe.
Sophisticated radiation detector designed for broad public use. The system is a miniaturized gamma ray spectrometer, which means it can measure not only the intensity of radiation but also identify the type of radionuclide that is creating it. Such a system is far more sophisticated than old-fashioned “Geiger counters” that provide only minimal information about the presence and level of radioactivity.
2014/07/07 at 3:54 pm
Just 39 out of 124 beta monitors are functional as of this date out of the 124 cities covered. Three stations went off line in just the last week including Albuquerque, New Mexico which has seen heightened activity. That station is one of the closest to the troubled, and radiation-leaking WIPP facility in the same state. At least the gamma graphs are working which is some consolation, but not much. See our June 30, 2014 report for deeper analysis on gamma graphs.
Readings of 100 CPM or more indicate significant beta radiation activity. Note that below, the tilde symbol (~) before some rad readings means mathematically approximate.
Since June 30 (below in archives), Montgomery AL started trending up again up to ~165 CPM yesterday; Anchorage AK‘s beta graph stopped producing data July 3; Fairbanks AK is picking up hitting 100 CPM in the last week; Phoenix AZ‘s graph is still offline since June 10 when it was ranging up to 165 CPM the week before outage; Tuscon AZ is still bouncing around considerably over 100 CPM; Little Rock AR is picking up hitting 200 CPM today; Fort Smith AR is getting busy too hitting ~220 CPM today; Anaheim CA is nice and cool at ~25 CPM today; Fresno CA has is coming in at 90 CPM this afternoon; Los Angeles CA‘s beta graph stopped in March but the gamma is not active; Riverside CA remains quite active marking ~135 CPM today; San Bernardino County CA keeps crossing the 100 CPM threshold but is a reasonable 75 CPM today; San Diego is chillin’ at just 30 CPM today which is higher than normal for the beach city; Washington DC is somewhat active at ~90 CPM today; not one beta monitor out of five works in Florida; Augusta GA settled down to 500 CPM today; Ft. Wayne IN hit ~225 CPM again in the last week; Orono ME looks nice and cool showing how the farthest away station from Fukushima has the lowest beta radiation with ~19 CPM today; Baltimore MD‘s beta and gamma graphs are still out; Grand Rapids MI hit ~180 CPM July 5 up from ~20 CPM July 4; St. Paul MN went soared to ~255 CPM yesterday; St. Louis is trending active with ~75 CPM today; Albuquerque NM‘s beta station is now offline after peaking at ~335 CPM June 22 with the previous high being ~417 CPM April Fools Day; Buffalo NY was ~70 CPM yesterday; New York City NY is not functioning as it hasn’t for years but its gamma gross count has picked up somewhat; Syracuse NY‘s beta graph settled down to ~40 CPM today; Charlotte NC is picking up repeatedly hitting over 100 CPM but is ~60 CPM today; Raleigh NC jumped to 160 one day in the latest period; holy Toledo OH jumped to ~177 CPM ~July 5; Corvalis OR is up to ~80 CPM today; Pittsburgh PA‘s beta graph stopped ~July 1 after activity increase; Puerto Rico‘s beta graph doesn’t work but the gamma is still low and steady; Amarillo TX continues to amaze with ~420 CPM today; Dallas TX hit ~270 CPM on the 4th of July; the whole state of Texas, save Ft. Worth, is getting hammered but lack of beta information means the Lone Star State is still nearly blind but nevertheless hot; Salt Lake City UT‘s beta station is still down since a huge beta increase over 200 CPM in early May; Charleston WV is still out after nearly hitting 400 CPM in March then the beta graph going belly up March 13; and Madison WI hit ~175 CPM today but had reached ~295 CPM May 28, 2014.
At this location, the data suggests airborne radioactive contamination leakage into the Southern Hemisphere has stabilized at present, as increases are not as dramatic as previous years.
Technical details:
(Note: The 4yr average referred to in the charts, is the 4yr pre-Fukushima average.)
June 2014, 7% above the 4 year pre-Fukushima average.
Over 2,051 special tests and original reports from nine Radiation Stations plus Radiation Station Santa Monica California‘s 3,847 tests total 5,898 special radiation tests and reports as of July 1, 2014. As of this date, over 1,566,689 people have seen Radiation Station Santa Monica California’s 24/7 online streaming begun March 15, 2011 along with 19,144 raddies watching Radiation Station Glendale California‘s continuous online streaming complete with graphs totally over 1,585,833 visitors plus tens of thousands of folks coming to our YouTube and Facebook pages. Thank you!
Outrageous, deplorable and insanely morally wrong! 🙁
FACT: We have out of control TRIPLE CORE MELTDOWNS spewing daily and hundreds more that hold the same potential.
Why would these issues not be fixed?
Why is there not a national effort to better understand and to do our best to safely mitigate what we KNOW is here and will continue?
One would think that after 3 years the Untied States of America would be on top of this global crisis. But, that’s not the case. Ask yourself… why???
IMO – The only thing ‘under control’ is the media information regarding Fukushima and the way it’s ‘fed’ to a public that’s more concerned with so called reality shows on TV. 😉
EnviroReporter.com is now providing nationwide radiation reports culled from our RadNet Air Monitoring. This exists nowhere else and is the most accurate and detailed look at the beta and gamma radiation readings from 124 radiation stations across the United States and Puerto Rico.
NATIONWIDE RADIATION REPORT
June 30, 2014 at 6:54 pm
Our EPA RadNet Air Monitoring shows that 42 beta monitors are functional as of this date out of the 124 cities covered. That’s up from 40 but about half a dozen of them seem to have stopped on June 27. We are still counting these as active just in case it has to do with it being the end of June. Even without beta graphs, one can glean data out of the gamma graphs – take note of the radiation reading patterns in locations that do have both beta and gamma graphs. They often move together. So this could help at least give an idea of the beta readings at a site if only the gamma information is available. Note that below, the tilde symbol before some rad readings “~” means mathematically approximate.
Some places got hotter since June 19 (below in archives): Montgomery AL started settling down but zoomed up to ~140 CPM yesterday; Anchorage AK is very low; Phoenix AZ‘s graph has stayed out since June 10 when it was ranging up to 165 CPM the week before outage; Tuscon AZ was over 200 CPM today; Fresno CA has cooled down to 90 CPM; Los Angeles CA‘s beta graph crapped out in March but the gamma is not active; Riverside CA dropped to 100 CPM today; Augusta GA settled down to 100 CPM by today; Ft. Wayne IN hit 225 CPM in the last week; Orono ME looks nice and cool showing how the farthest away station from Fukushima has the lowest beta radiation with ~17 CPM today; Baltimore MD‘s beta and gamma graphs are still out; St. Paul MN went nuts and hit 340 CPM in the last week; St. Louis has dropped to ~50 CPM even with that burning radioactive dump; Albuquerque NM‘s beta station is back online and trending down with only ~55 CPM today after peaking at ~335 CPM June 22; Buffalo NY is trending up hitting ~140 CPM June 28; New York City NY is not functioning as it hasn’t for years; Syracuse NY‘s beta graph settled down to ~65 CPM today; Charlotte NC is picking up repeatedly hitting over 100 CPM; Raleigh NC jumped to 150 today; holy Toledo OH jumped to ~140 CPM today; Corvalis OR really cooled off to ~20 CPM today; Pittsburgh PA hit ~105 CPM yesterday; Puerto Rico‘s beta graph doesn’t work but the gamma is low and steady; Amarillo TX continues to amaze with 450 CPM June 27; Dallas TX down to 55 CPM today; the whole state of Texas, save Ft. Worth, is getting hammered but lack of beta information means the Lone Star State is nearly blind but nevertheless hot; Salt Lake City UT‘s beta station is still down; Charleston WV is still out after nearly hitting 400 CPM in March; and Madison WI hit ~145 CPM June 28 after topping out at ~295 CPM May 28, 2014.
This short animation of Northern, and Southern Hemisphere air circulation, shows why we can get detections so far south.
June 2014 drain soil test
I have a large 30 square meter concrete slab that flows into one drain. It is an uncovered area at the time of sample collection. It had become full of runoff. This runoff had formed a fine soil with fine plant roots throughout it. When I cleaned the drain out, I collected a 526 grams sample, and placed it into a marinelli beaker for testing.
This is mainly the soil, minus the fine plant roots. I did not dry it out, so there would be some water content.
Lots of Lead Pb-210!
Lead Pb-210 is the end product of atmospheric Radon Ra-222 decay daughter isotope washout, and has a half life of 22 years. Radon itself is a decay daughter of Uranium U-238 decay.
Are more Radon decay daughters being created in the atmosphere by the huge amount of nano sized Uranium particles released from the Fukushima Nuclear Disaster, and the use of Depleted Uranium (DU) ammunition?
When I do a scintillator test I usually have two free MCA software programs running at the same time, Theremino and Becqmoni. This allows me to cross reference chart test results. Also, each software package has different advantages over the other. I used Becqmoni to work out the Pb-210 activity, in Becquerels per kilogram, for this soil sample.
The rest of the spectrum is a mixture of Uranium and Thorium decay daughters, plus some Be-7. The peak around 186 keV is most likely Radium. Maybe just a concentrating effect of the of Pb-210 from the large concrete surface area into this drain.
Here are some previous local soil tests. The detected amounts of Pb-210 present in these tests is a lot smaller.
Our EPA RadNet Air Monitoring shows that only 40 beta monitors are functional as of this date out of the 124 sites covered. Last July 9, 60 stations were operable meaning there has been a 33% loss even as the Fukushima and WIPP fiasco’s continue unabated. These stations are run by volunteers who deserve our gratitude. They also deserve compensation because we deserve 100 percent functionality of these beta graphs.
Of particular concern are some locales that caught our attention today on the working beta graphs: Montgomery AL is at 165 CPM; Phoenix AZ’s graph is out since June 10; Tuscon AZ was over 500 CPM June 1; Fresno CA is picking up hitting over 350 CPM this month; Los Angeles CA’s beta graph crapped out in March; Riverside CA keeps cookin’; Augusta GA hit 350 CPM in the last week; Orono ME looks nice and cool showing how the farthest away station from Fukushima has the lowest beta radiation; Baltimore MD’s beta and gamma graphs are out; Albuquerque NM was trending down before its beta station, not too far from WIPP, went belly up; Buffalo NY is trending up hitting 110 CPM June 10 but Syracuse NY’s beta station quit in the last month; Corvalis OR is picking up topping 150 CPM in the last week; Pittsburgh PA continues to trouble; Amarillo TX is trending down ‘only’ hitting 300 CPM in the last week; the whole state of Texas, save Ft. Worth, is getting hammered to various degrees but El Paso TX, which is close to WIPP, has lost both beta and gamma monitors; Salt Lake City UT’s beta crapped out a month ago; Olympia WA is looking sweet with low beta and hot Charleston WV has lost both graphs when they least needed being radiation blind.
Over 2,033 special tests and original reports from nine Radiation Stations plus Radiation Station Santa Monica’s 3,829 tests total 5,862 special radiation tests and reports as of June 17, 2014.
Australian Banana and Strawberry Plant Mutation Report
I was sent twin bananas to test, from Northern New South Wales. Around the same time, we also found a mutated strawberry in a strawberry punnet, purchased from the local supermarket. The strawberries came from Victoria.
Both the banana and the strawberry samples were long count tested, with a very sensitive Geiger counter. These tests showed no elevation above background. The samples were then tested with a Scintillator, in a lead and copper lined test chamber. Each sample was tested twice, and each test was run for 24 hours.
Voltage setting;
800 Volts
Scintillator Model:
2″ Alpha Spectra NaI 818/2B,
resolution 7%
Note: Experimental software MCA Theremino V6.2 was used for the scintillator testing. It is quite noisy, near background levels. We are talking very low counts per second (CPS) at this level, as low as one count every 100 + seconds. This can make it difficult to define if some very small peaks are actual isotope detections, or random variations in background levels.
Note: This scintillator has around 50% efficiency at 60 keV.
Banana Test
The brown and gold lines are the Banana tests, and the grey is background.
You will see both banana tests overlaid on the test chart. I have highlighted the significant areas above background that are common to both tests, in yellow. Possible isotopes candidates for these peak areas are Lead Pb-210, Americium Am-241, Thorium Th-234, Uranium U-235 and Beryllium Be-7. Common isotope peak markers are at the top of the chart. The suggested Lead Pb-210, Am-241, Thorium Th-234, Uranium U-235 detections were so small that there is considerable uncertainty to this analysis.
If Thorium Th-234, and Uranium U-235 are present it, would indicate refined uranium was a contaminant. More expensive sensitive equipment would be needed to verify these detections. The bananas went rotten during the testing, and becoming liquid mush. This may explain the peak differences between tests, as sample material moved around during the testing period.
The strawberry weighed was only 9 grams. This is a very small plant sample amount to test for possible trace amounts of radioactive contamination. Any possible peaks that showed up in the first test, turned out to be random variations in background. If there was any radioactive contamination present in the mutated strawberry, my equipment was not sensitive enough to identify it.
Did radiation isotope contamination cause these plant mutations?
There is not enough evidence gained from either of the mutated banana or strawberry tests to conclude definitively that the radioactive isotope contamination was the cause of these plant mutations. More sensitive equipment or other methods of testing, would be needed to definitively identify the isotope contamination.
These are the first two plant mutations I have been provided with for testing here in Australia. Besides man made radioactive isotope contamination, plant mutations can also be created by ultraviolet radiation, chemical, hormonal, genetic, bacterial, fungal, and viral causes etc.
Disclaimer: This is an amateur volunteer run service. Human error can provide incorrect information, and equipment malfunction can produce false readings. Do not rely on, or take action upon information presented here, without further research.
The 2007 to 2011 chart data was recorded by GammaScout Alert Geiger counter sampling once a week. (This is the sampling factory setting when it arrives in the post.) The four year recorded per Fukushima average works out at ~0.10 uSv/hr.
It would be interesting to see a graph or chart that shows the readings over a 3 year period.
The readings taken by everyone over the last three years may someday, someday soon, mark what used to be considered normal backgrounds.
As the initial fallout from Fukushima’s Nuclear Plant explosions and triple core meltdowns continue to circle the globe it should also be noted that the atmosphere is and has been receiving constant ‘daily’ emissions from Fukushima.
So, it seems to me that at some point there will be a ‘new’ normal background.
What will new backgrounds be in 3 years, 6 or 12 years based on what we know now if there is a slight but steady overall increase.
IMO – Based on my general observations of multiple sources the data seems to suggest an increase overall. Please correct me if I’m wrong.
>>
The farthest ever photo of Earth.
The Pale Blue Dot is a photograph of planet Earth taken in 1990 by the Voyager 1 space probe from a record distance of about 3.7 billion miles from Earth.
If you were born prior to the summer of 1990, YOU are in this picture.
“From this distant vantage point, the Earth might not seem of any particular interest. But for us, it’s different. Consider again that dot. That’s here. That’s home. That’s us. On it everyone you love, everyone you know, everyone you ever heard of, every human being who ever was…”
– Carl Sagan
ALERT! Airborne Radiation Spike In Saint Charles Mo, Suspected Source Underground Nuclear Fire At West Lake Landfill.
Extract:
Our Live Outdoor Radiation Monitor is showing a several hour long ramping spike in airborne radiation levels. The spike appears to be tied to a shift in wind direction, surface winds are blowing in from the East. Based on wind direction, the suspect source of this spike is the underground nuclear fire at Bridgeton’s Westlake Landfill (EPA Superfund site).
May 2014 Southern Hemisphere Background Radiation Report
Summary:
May 2014 was 13% above the pre-Fukushima average. May 2013 was 7% above, and May 2012 was 7% above the pre-Fukushima ~0.10 uSv/hr month average.
In the colder months I see a drop in background here, as most of the prevailing winds are from the Southern Ocean. May 2014 saw a 6% increase above May 2012 and 2013 month average background radiation levels. If you look at the May 2014 day average chart you will see more day to day dynamic swings in the day averages background radiation levels compared to 2012 and 2013.
@Tray: Because this fee-based service doesn’t allow non-payers to look at their charts, I can’t speak to the accuracy of NETC but I do know that any entity right now with “levels showing in many states show an evacuation-level cpm count (including Los Angeles)” is not accurate. I also am personally not engaged by websites asking for a healthy chunk of change to sell cheap Geiger counters that have Bible quotes that actually warn against “knowledge,” of all things. Better to look at the EPA’s RadNet Air Monitoring which, unfortunately, has just 44 out of 124 beta graphs working as of today. Places that give us concern, based on today’s and recent readings, are Tuscon AZ, Anaheim CA, Riverside CA, Augusta GA, Fort Wayne IN, St. Louis MO, Lincoln NE, Albuquerque NM, Syracuse NY, Charlotte NC, Raleigh NC, Corvallis OR, Pittsburgh PA, all of Texas, and Madison WI.
Over 1,996 special tests and original reports from nine Radiation Stations plus Radiation Station Santa Monica’s 3,741 tests total 5.737 special radiation tests and reports as of June 1, 2014.
Recent Australian and New Zealand elevated detections.
Sydney 26th May 2014 – I woke up with the alarm on (I set my Geiger alarm at 0.30uSv). Averages today are around 0.22uSv. Measurement confirmed by the second counter.
Dunedin New Zealand 25th May 2014 – Background here has increased to 0.19 micros per hour – a new high over the average of about 0.17 …. and the ionisation chamber has shot up to 1.7 picoCuries per litre – where the running average is 1.0 picoCuries per litre over winter … spikey …
Baldivis near Perth, Monitoring Station (Western Australia) 25th May 2014 – Chart shows an increase from around the beginning of April 2014, when the rains started…
North Island New Zealand 24th May 2014 – Kapiti Gaigakaunta radiation monitoring station detected two brief increases in background levels, as a weather event passed through the area.
Just when one may think that the N Atlantic around the UK/Norway/Scotland etc would be safe to eat the seafood there as its far from the Pacific/Gulf Coast etc, just watch this documentary below… Must watch!
May 19, 2014
3:11pm INT HEPA DUST from two HEPA filters and one Ionizer/HEPA filter: 65.0 CPM which is 48.4% HIGHER than background over a 25 day period. This is lower than previous period that ended April 25, 2014. Los Angeles RadNet beta station still not functioning.
2:57pm INT BG: 43.8 CPM
Hi Michael – Glad to be back. I’m unsure what capacity I’ll have over the next couple of months but will post as much as possible.
Since there was a break in my readings, I averaged all daily exterior readings I had for Jan & Dec and that came out to be 51 CPM so yesterday’s reading was a bit higher. I’m unsure if it has to do with Runkle Canyon but could very well be. Today’s reading was more in line with average.
Simi Valley, CA – 10 MIN AVG clear sky
9:15a EXT 50.7 CPM
9:25a INT 48.6 CPM
2014/05/19
Simi Valley, CA – 10 MIN AVG clear sky
6:25a INT 44.2 CPM
6:35a EXT 56.2 CPM
[Editor: WELCOME BACK SIMI RICH!!! And what a way to come back after a well-deserved break: The exterior reading is 27.2% over background, nearly double the Inspector Alert conservative +/-15% margin of error. Is this from Runkle Canyon construction dust?]
Australia
Queensland
Sunshine Coast
April 2014 rain water test report
Summary:
This filter had a lot of green algae growing in it by the time I tested it. The chart is minus background, and is using CPS for the y axis. Testing time was 24 hours. As you can see, there are clear peak markers for Beryllium Be-7, and a combination peak of Iodine I-129 and Lead Pb-210.
There was more Be-7, I-129 and Pb-210 detected in April’s test compared to March 2014. Interestingly, March had more rain, 204mm compared to April’s 171 mm. This suggests there was a lot more Be-7, Pb-210 and I-129 in the atmosphere here in April, compared to March 2014.
A pre-Fukushima Argentina studying indicates that the I-129 would eventually reach the Southern Hemisphere, as it has from other major sources, like the nuclear fuel reprocessing plants of Cape de La Hague (France) and Sellafield (UK).
It has been suggested that the Japanese have been pumping large amounts of liquid Nitrogen and Boron onto the multiple molten coriums at the Fukushima Nuclear disaster. Neutron bombardment, plus lots of underground corium venting, has also been releasing large amounts Beryllium Be-7 and 1-129.
For background on this subject read this article on using Be-7 as a tracer for I-129.
Be-7 can also be produced by cosmic/solar ray spallation in the upper atmosphere. Be-7 created by this process takes around two weeks to reach sea level. The Sun has been very quite this cycle.
There is a natural Be-7 / Pb-210 cycle here in the Southern Hemisphere, which means there should be more Be-7 and Pb-210 detected in the summer months compared to winter.
Is some of this Be-7, I-129 and Pb-210 from Fukushima?
The slight peak position shift to the left of the ideal in the April 2014 chart could indicate another isotope contaminant is also present with Be-7, around the same location.
For background on this subject read this article on using Be-7 as a tracer for I-129.
Disclaimer: This is an amateur volunteer run service. Human error can provide incorrect information, and equipment malfunction can produce false readings. Do not rely on, or take action upon information presented here, without further research.
After various 1 hour internal and external tests we established a normal background baseline of 12-14 uR/h for the East Los Angeles area. This is good to keep in mind since a rise in gamma at this location would indicate something is going on.
Hector
WB Johnson GSM 500
HP-265 “pancake”
GP-1001 low range gamma
April 2014 was 22% above the pre-Fukushima average. April 2012 was 10% above, and April 2013 was 13% above the pre-Fukushima average.
In the colder months I see a drop in background here, as most of the prevailing winds are from the Southern Ocean. The drop for April 2014 was less than April 2012 and 2013.
Leaving men, women and children living in highly radioactive contaminated areas is criminal. The Japanese officials responsible for this policy should go to jail! This is mass murder!
Hot particles photographed on slippers of kindergarten children Namie Town Ohori district 121,497 bq / kg (Cs134 +137), 4,000 cpm.
In the commodities of sampling so far, this slipper 1,500 cpm is one of those shown the strongest pollution.
Hello Hector! This is terrific news! Your work in a crucial part of this massive metropolis is outstanding. Radiation Station East Los Angeles gets many views every day. You are a shining example of what a smart and dutiful person can do to help us all know just how hot, or not, it is in the City of Angels.
I was delighted to visit recently with Dr Solar of Radiation Station Glendale California who is an OR – Original Raddie. We had the time of our lives regaling each other. Dr Solar is also known as Dale Ramicone who was so thoughtful and insightful in our recent expose Fukushima – The Perfect Crime?
EnviroReporter.com‘s nine Radiation Stations in the USA and Australia have completed over 1,936 tests & reports as of April 26, 2014. Radiation Station Santa Monica California has performed and created over 3,668 tests & reports, including our Eat Me testing, as of the yesterday bringing this websites grand total of tests and radiation reports to 5,604 since March 15, 2011, four days after the triple meltdowns began. That doesn’t even include the hundreds of tests of food, water and other important media at our Radiation Food Lab run by Peter Daley of Radiation Station Sunshine Coast Australia.
Denise Anne, aka Lady Fingers, and I, aka Man Hands, are blessed to be able to work with such fine folks as Hector, Dale and Peter. The world would be a much better and more informed place regarding radiation levels if it had more individuals of such solid character. And so are you. That’s perhaps why over three million people have visited our site and Radiation Stations since the Fukushima mega-disaster began. It’s hot news, real hot news.
Hello fellow reporters. We will be back soon reporting levels from the east side of los angeles. We are awaiting our johnston gsm 500 survey meter to return from a fresh calibration. We also added an energy compensated probe in order to give more accurate ambient dose readings from a range of 5 uR/h up to 200 mR/r this would apply to gamma only.we will also report in counts per minute (CPM)with the sesnitive pancake probe. Stay tuned for count readings from the east side of town.
8 miles east of downtown los angeles
Hector
wb johnston gsm 500
Johnston hp-265
Johnson gp-1001
Very radioactive hot particles found in Japanese home vacuum cleaner dust, long distances from the Fukushima Nuclear disaster site, up to 450 km away in fact.
Extracts:
Results: The median total activity of eighty four Japanese bulk house dust samples studied was 2.5 KBq/ kg.
Conclusion: Radioactively-hot particles of the respirable size range were routinely detected, with one as far as 460 km from the re lease site.
April 25, 2014
10:20am RAIN SAMPLE: 45.2 CPM^^ which is BACKGROUND. Again, note how radon daughters (progeny) would show up in this sample if it were present, and it isn’t. No rain samples taken at Radiation Station Santa Monica are impacted by radon progeny meaning anything over background of significance is not impacted by these phenomena.
10:00pm INT RADIATION STATION SANTA MONICA BACKGROUND: 44.8 CPM^^
April 25, 2014
4:40pm INT HEPA DUST from two HEPA filters and one Ionizer/HEPA filter: 97.4^^ CPM^^ which is 116% HIGHER than background over a 44 day period. This is lower than previous period that ended March 12, 2014. US EPA RadNet Los Angeles beta monitor has ground to a halt providing accurate data. The second largest metropolitan in the United States is flying beta blind to the man-made radionuclides spewing into the Pacific from Fukushima then made airborne in choppy seas to become clouds then rain. All heading towards the West Coast including Los Angeles. RadNet stations in San Bernadino and Riverside are operating, thankfully, and show high beta readings but nothing like places like Amarillo Texas. Radiation Station Santa Monica down temporarily for routine maintenance.
4:25pm INT BG: 45.1 CPM^^
It was a fairly wet month with 204mm of rain, so a fair bit of rain water flowed through the filter. The main isotopes detected were Iodine I-129, Lead Pb-210, and Beryllium Be-7, with possible traces of Uranium U-235?. There was more rain in March 204mm, but less detectable traces of isotopes than February. In February we had 37mm rain. This chart is using a new background, recorded on the 21st March 2014.
Disclaimer: This is an amateur volunteer run service. Human error can provide incorrect information, and equipment malfunction can produce false readings. Do not rely on, or take action upon information presented here, without further research.
April 2, 2014
10:20am RAIN SAMPLE: 49.4 CPM^^ which is 15.7% HIGHER THAN BACKGROUND which is above the Inspector’s +/- 15% margin of error meaning it is a valid measurement and slightly above background. EnviroReporter.com considers this negligible.
12:10am INT RADIATION STATION SANTA MONICA BACKGROUND: 42.7 CPM^^
April 1, 2014
10:20am RAIN SAMPLE: 41.9 CPM^^ meaning background. Again see that there is no evidence, per usual, of any radon progeny impacting our readings. No readings performed at this site have been or will be affected by radon daughters.
10:10am INT RADIATION STATION SANTA MONICA BACKGROUND: 43.2 CPM^^
This short animation of Northern, and Southern Hemisphere air circulation, shows why we can get detections so far south.
Summary:
The extensive local recorded data shows that the background radiation level increases have stabilized. March had a 1% decrease in average background compared to 2013. This was still 7% above the March 2012 average, and 31% above pre-Fukushima levels.
An unusual rain event around the 26th of March caused a drop in radiation for a couple of days. This was surprising. After investigation, I found the event was caused by Southern low pressure system. You can see this Southern low around 1.40 seconds into this “Three Minute News” Youtube video. We had a significant spike in background on a dry 29th and 30th of March, when the air flow started to come from the tropics again.
Technical details:
What do the colour alert codes in the charts mean?
Disclaimer: This is an amateur volunteer run service. Human error can provide incorrect information, and equipment malfunction can produce false readings. Do not rely on, or take action upon information presented here, without further research.
Great presentation, the truth of what actually happened is presented clearly for everyone to understand. This presentation exposes the Government and industry lies.
Governments and industry are using the same evil playbook of lies and deceit, for the Fukushima Nuclear Disaster.
March 12, 2014
9:00pm INT HEPA DUST from two HEPA filters and one Ionizer/HEPA filter: 124.9 CPM^^ which is 184.5% HIGHER than background over a 57 day period. This is 1.6 times HIGHER per day than previous period that ended Jan. 12, 2014. Also note that RadNet’s Los Angeles beta monitor has stopped reporting results and looks abandoned.
8:40pm INT BG: 43.9 CPM^^
They called them ‘activists’ and not fear mongering anti-nukers.
“The war that had to be lost to be won.” 😉
(Reminds me of the play “The Mouse That Roared”.)
“If being physically able to touch the reactors is not being in a sensitive place, I don’t know what is,” Rousselet told Reuters. “People with bad intentions could have posed a threat to the reactor’s safety.”
– NBC News
Spike in background Caloundra Australia 17th March 2014
Had a significant local background increase here on the 17th March. Background day average went to yellow alert level, at 43% above average. This was mainly a free air detection increase. Except for a very light late evening shower that lasted a minute or two, it was fine and hot the rest of the day.
During yellow alert levels or higher, we suggest staying out of the rain.
North Island New Zealand 17th March 2014 – Kapiti Gaigakaunta radiation monitoring station detected a brief increase in background levels as a weather event passed through the area. Screen Shot.
April 16, 2026 Actress, singer, and producer Rita Wilson endorsed the Reiners preserve renaming petition!
April 13, 2026 Stand-up comedian, actress, writer, television host, and producer Chelsea Handler endorsed the Reiners preserve petition!
April 1, 2026 No April Fools joke that 18 Hollywood stars have already endorsed the Rob and Michele Reiner Open Space Preserve renaming petition!
March 31, 2026 Actor and singer Mandy Patinkin signed the Reiners preserve renaming petition!
March 31, 2026 Actress and comedian Carol Kane signed Reiners petition!
March 30, 2026 Actor, singer and comedian Josh Gad endorsed the petition!
March 30, 2026 Actor and professional wrestler Paul Walter Hauser signed the Reiner petition after heartfelt eulogy saluting them!
March 30, 2026 Actor and producer Alec Balwin signed the Change.org petition renaming old Ahmanson Ranch the Rob and Michele Reiner Open Space Preserve!
March 24, 2026 Actor and musician Corey Feldman signed the name-change petition for the Rob and Michele Reiner Open Space Preserve!
March 17, 2026 Actor, musician and producer Jack Black signed the name change petition for the Rob and Michele Reiner Open Space Preserve on St. Patrick’s Day!
March 17, 2026 Actress Zooey Deschanel supported the Rob and Michele Reiner Open Space Preserve name change petition on St. Patrick’s Day!
March 10, 2026 Actress Marlee Matlin signed the Rob and Michele Reiner Open Space Preserve name change petition!
March 10, 2026 Actor Kevin Nealon endorsed the Rob and Michele Reiner Open Space Preserve name change petition!
March 6, 2026 Actress Jane Fonda supported the Rob and Michele Reiner Open Space Preserve name change petition!
February 11, 2026 Actor & comedian Martin Short endorsed the Reiner petition that renames the Upper Las Virgenes Canyon Open Space Preserve to the Rob and Michele Reiner Open Space Preserve!
February 3, 2026 Actor Nick Robinson signed the Reiner petition!
January 27, 2026 Actress Rebecca De Mornay supports Reiner petition!
January 26, 2026 Actress Lisa Marie Elwes endorses Reiner petition!
January 20, 2026 Actress Whoopie Goldberg signs Reiner petition!


This is a really valuable space for sharing observations and concerns about radiation, especially with so much misinformation floating around online. It’s clear that monitoring real data like background levels and trends from reliable stations is far more helpful than panic or speculation. Understanding how wind patterns and multiple detectors work together to confirm events is the kind of practical info that empowers people rather than scares them. And while it’s important to stay aware of nuclear issues globally, it’s also worth keeping in mind what credible science says about exposure levels and real health risks so we don’t accidentally spread fear. Thanks to everyone here for keeping the conversation grounded and informative!
This is false impression and, frankly, a pretty dumb one. The IAEA team “had not observed any Russian military deployment inside the Zaporizhia nuclear power plant” BECAUSE PUTIN’S INVADERS EVACULATED IT BEFORE DETONATING IT AT THEIR OPTION.
Watch this video that shows “RUSSIAN TROOPS ARE MOVING AWAY FROM ZAPORIZHZHIA NUCLEAR PLANT!”
The IAEI looks daft for actually thinking this malarkey and then serving it up publicly. Most observers we’ve read aren’t that stupid, thank goodness. The only hope, at this point, is that the Ukrainians can find and disable any left explosives before they blow up the largest nuclear complex in Europe, courtesy of war criminal and soon-to-be-deposed Putin.
30th June 2023 – IAEA saw no evidence Moscow planning attack on Zaporizhia nuclear plant, but ‘anything can happen’ (9 minutes 26 secs)
Extract:
The Director General of the International Atomic Energy Agency Rafael Grossi spoke to FRANCE 24 from Vienna and stated that his teams had not observed any Russian military deployment inside the Zaporizhia nuclear power plant, despite Ukrainian authorities claiming that Moscow was preparing to attack the plant.
Russia and Ukraine On The Brink!
Russia and Ukraine are presently both accusing the other of planning to orchestrate a major nuclear event.
The Ukrainian’s are claiming that Russian’s have have placed mines in the Zaporizhzhia Nuclear plant spent fuel cooling pools and is presently evacuating staff in preparation for blowing up the facility.
The Russians claim that the Ukrainians have secretly collected nuclear material from one of the Ukrainian nuclear reactors, and that this will enable them to make a dirty bomb, or nuclear bomb.
“In the fog of war the truth is the first casualty!”
Let us to all pray that is madness is averted.
There will be no winners if an event like this were to occur. It would also have serious health affects on multiple future generations in multiple countries as the radiation will spread far and wide. The nuclear plant site and surrounding landscape would also become so contaminated it would become another radioactive exclusion zone, just like the Ukraine Chernobyl Nuclear Power Plant exclusion zone, created after it’s reactor 4 melted down in 1986.
Link to Chernobyl Nuclear Power Plant radiation monitoring stations.
https://www.saveecobot.com/en/platform/chnpp
The SaveEcoBot site link has been added under the Ukraine and Belarus country headings on EnviroReporter’s International list of Radiation Monitoring Stations. You will also find other radiation monitoring system links listed under the Ukraine and Belarus country headings there. The local monitoring stations on SaveEcoBot measure background radiation levels in Nano Sievert per hour nS/hr. Most of the local background stations in Ukraine and Belarus outside the Chernobyl exclusion zone are presently showing around 100 to 200 nS/hr. Thirty seven years after the Chernobyl reactor 4 meltdown, the exclusion zone is still showing very high background radiation levels. The highest level being 5300 nSu/hr.
If you are new to this, 100 to 200 nS/hr will be the present local background reference level for you on SaveEcoBot.
SaveEcoBot raw link:
https://www.saveecobot.com/en/radiation-maps#10/49.4163/27.1204/gamma
If you see levels increasing above this on multiple monitoring sites in Ukraine and Belarus near each other, then it likely means a significant nuclear event has occurred, and you will need to start looking for live surface wind direction and weather patterns so you can determine whether a radioactive cloud is heading in your direction. This will help you make a decision on whether to evacuate or shelter in place. Links to live wind and weather monitoring resources are also provided on the EnviroReporter’s International list of Radiation Monitoring Stations page.
You need to learn how to use the wind, weather and radiation monitoring systems before a major nuclear event occurs. Otherwise you will be fumbling around in the dark, trying to figure out how everything works.
If it is headed outside the boarders of Ukraine and Belarus you can then go to EnviroReporter’s “International list of Radiation Monitoring Stations”, to look up other countries radiation monitoring stations.
In the present world environment, owning a Geiger counter and knowing how to use it, could be a potential life saver. If you have questions about how to use a Geiger counter, or how to test food for radiation, please leave questions in the EnviroReporter radiation conversation comment section here.
Also feel free to share your knowledge on the subject.
Get a feel for your Geiger Counter. Knowing what is the average background level you would expect for your local area is important. You need to build up a knowledge base of your local weather and local background radiation levels. Then you have a baseline from which to work.
I have provided a screenshot below from the Khmelnytskyi monitoring station in Ukraine. It is showing a increase in local background Gamma dose. This is not a huge increase, but an increase was detected.
This increase in background level seems to be confined to the local area at present. I have not been able to find any other regional monitoring stations showing an increase like this during this period of time.
Ukraine_Khmelnytskyi_Gamma_Dose_Rate_15th_20May_2023.png
“A colossal explosion was heard at the main weapons and ammunition storage facility supplied by NATO in Khmelnytskyi, western Ukraine. Repeated large detonation explosions occurred after being hit by the missiles, as the depots stockpiled very large quantities of fuel and ammunition for Ukrainian forces’ planned offensive operation.”
I was investigating this massive explosion in real time (video report below), and keeping an eye on the European Ukraine radiation monitoring stations just in case there had been a nuclear component to these explosions. There may have been British depleted uranium anti tank munitions stored there.
At the time nothing above normal background levels were showing up in any of the EU monitoring stations located in Ukraine. I would pop back every now and then to see if there were any significant detections.
Around 7.30 pm my time I found the entire country wide Ukrainian monitoring system had gone down. At around 8pm, all stations came back online again, showing no changes in background levels. Fishy?
This explosion created a massive 3.4 magnitude seismic event at ground level! See screenshot below.
There maybe a significant radioactive event happening that is being covered up.
Can’t say until we have more evidence.
Colossal explosion heard at NATO supplied ammunition facility in Khmelnytskyi (2 minutes 30 secs)
Extract:
A colossal explosion was heard at the main weapons and ammunition storage facility supplied by NATO in Khmelnytskyi, western Ukraine. Repeated large detonation explosions occurred after being hit by the missiles, as the depots stockpiled very large quantities of fuel and ammunition for Ukrainian forces’ planned offensive operation.
https://www.youtube.com/watch?v=Tkr5Q0aadXk
Ukraine Khemelnytskyi 3.4 earthquake from massive explosion 13th May 2023.png
On 10/6/2022 the New York Times reports: “A day after the Kremlin announced that it would “nationalize” the Zaporizhzhia Nuclear Power Plant it has seized in Ukraine, the United Nation’s top atomic energy official said on Thursday that he could not recognize any change of ownership of the plant, which he described as unlawful and destabilizing. And he said a nuclear accident there is “a very, very clear possibility.”
Europe or Ukraine
Here is a basic guide to quickly find out if a significant radiological event is occurring in Europe or Ukraine.
The link I provide below takes you to the EURDEP radiation monitoring web site.
Extract:
“EUropean Radiological Data Exchange Platform () network for the exchange of radiological monitoring data between participating countries almost in REAL TIME. Monitoring information are collected from automatic surveillance systems in 39 countries. These data reflect essentially the natural radiation background, if NO radiological events occur.”
The EURDEP site link I have provided will take you to their advanced map radiation monitoring page. When you first go to this page scroll down the page and click on the blue button that says, “Open the map, I understand and consent”. If a box appears asking you to allow cookies, you must allow cookies if you want to see the map, and all their radiation monitoring stations.
The radiation monitoring station location dots on the map are colour coded. You can zoom in and out of the map with your mouse wheel. The different colours indicate the radiation level range that is presently being detected at that monitoring location. Purple being the highest and light aqua is the lowest levels being detected.
Once the map view opens you will see a box on the top right of the map area. This box contains layered coloured rows, you will also see a number to the right of each row. This indicates the number of radiation monitoring stations in their system detecting at that level of radiation.
Place your mouse cursor over the coloured bar showing the radiation levels you are interested in, and click.
Once you do this it will filter out all the other monitoring stations on the map that are not in this detection range.
You can use this feature to quickly filter and see what are the highest radiation detections across Europe and Ukraine.
At present there is only one radiation station that is detecting radiation in the 300 to 500 nSv/h range and zero stations in the levels above it. This is a site located in Belarus which was significantly contaminated by fallout from the Chernobyl nuclear reactor meltdown in 1986. Zoom in and you will see that this monitoring station is located just north of the Ukraine border.
If you see more than that one monitoring station showing at this level, you will know there is potentially a major nuclear event in progress.
Note: All monitoring systems are subject to malfunctions at times. Two or more monitoring stations in close proximity indicating an increase in background level is more statistically an indication of a genuine event.
If you click on the monitoring station location dot, a chart will pop up, showing you the radiation levels over time.
https://remap.jrc.ec.europa.eu/Advanced.aspx
If you do see a significant detection, knowing the location’s wind direction at the time will be very important, particularly if you live in Europe.
Wind direction is an important factor in determining where the radiation will go.
The Nullschool 3D Earth wind map service allows you to see wind direction worldwide at different heights. You can rotate the map by holding down your mouse on the map, and dragging. If you use your mouse scroll wheel you can zoom the map location in and out.
If you click on the “Earth” item at the lower left corner of the Nullschool map page, a menu will pop up, that allows you to select different wind height data.
https://earth.nullschool.net/#current/wind/surface/level/orthographic=-336.91,51.77,851
The Russians keep shelling the Zaporizhzhia nuclear power plant in eastern Ukraine, like they did five times today, Thursday August 11, 2022.
This is the largest nuclear reactor in Europe and one of the ten largest in the world. Should it be destroyed, the consequences are going to be massive.
“This is a serious hour, a grave hour and the IAEA [International Atomic Energy Agency] must be allowed to conduct its mission to Zaporizhzhia as soon as possible,” the agency’s chief said at an emergency meeting of the UN security council Thursday night.
EnviroReporter.com recognized the need for accurate US RadNet radiation information being available 24/7/365 soon after the still-ongoing triple meltdowns began at Fukushima Japan March 11, 2011. Millions have seen EnviroReporter.com radiation monitoring ever since because it’s easy and free to use.
There are 142 EPA RadNet stations across America monitoring gamma and beta radiation levels and gamma exposure rates displayed. As of August 11, 2022, there are 483 live graphs continuously streaming though some stations can cut out for periods of time.
Gamma Gross Count Rate and Gamma Gross Count Rate by Channel Range as well as Gamma Exposure Rate and Beta Air Filter Results are graphed continuously courtesy of the U.S. Environmental Protection Agency. EnviroReporter.com organized this vital data for ease of use.
Should the “grave hour” become the unthinkable, know that the radiation from any kind of meltdown, fire, explosion or any combination therewith, the air plume would blow over eastern Ukraine but mostly Russia first.
But what glows around goes around and soon enough it could reach North America. That’s when to turn to EnviroReporter.com’s RadNet Air Monitoring.
Florida local TV stations are on the internet. You can watch them, commercials and all, in California or even in Story City, Iowa.
Gavin Newsom is running personal, self promotional advertisements on local Florida television stations. We’ve seen 6 of them so far, and estimate that there are at least 3 variations, which represents a lot of cash outlay in terms of production costs.
In each of the ads, a smiling active Gavin directs his comments to Florida voters, telling them that the Florida elected officials are doing bad things. On his commercials Gavin Newsom promotes California and invites Floridians to move there.
Obviously, Gavin Newsom is really promoting himself, because he doesn’t mention a single Florida Democrat candidate or ask that people vote for them to make people’s lives better in Florida. The focus is just on Gavin’s smiling face.
Its crystal clear that Gavin Newsom is going to take a shot at running for President in 2024. I am betting Boeing has orally promised to make contributions to him.
Boeing panders to whoever is in office, and donated $1 Million to the Democratic Party committee which was sponsoring the Biden/Harris inaugural ball, after the inaugural ball, even after it was cancelled. Boeing did that after having been loyal supporters of Trump when he was in office.
Gavin Newsom has to understand, loudly and clearly, that whatever primary he will be in, his opponents, the local press and local voters are going to hear about his making a sweetheart deal with Boeing, so they [Boeing] don’t have to clean up their toxic mess at Santa Susana Field Lab which has been instrumental in making children and adults sick with cancer.
The Santa Susana Field Lab and the affected people living and dying within 5 miles of it are what stands in the way of Gavin Newsom’s quest for the Presidency.
By the time the Democratic Primary season ends in 2024, the whole of the U.S. electorate will know Gavin Newsom is in Boeing’s pocket and his deal-making in California is killing children as well as adults.
EnviroReporter.com will continue its unique, award-winning work covering the Santa Susana Field Laboratory, aka Rocketdyne, and its associated issues including Runkle Canyon, Brandeis-Bardin and Ahmanson Ranch, which was as good as protected as parkland once our “Rocketdyne Ranch” cover story hit the stands in December 2002. The 2,783 acre “Upper Las Virgenes Open Space Reserve” has thousands of ancient oaks, rolling savannahs, red-legged frogs and mountain lions. The bucolic place has hiking trails, mountain biking, horseback riding, picnicking and even a splendid ranch house for weddings. What you won’t find, however, are the 3,050 luxury homes stopped by our reporting and the community. It’s the perfect staycation destination and you Californians own it in perpetuity!
June 3, 2022
2:40 pm PDST INT RSSMC DUST AGGREGATE FROM 3 HEPA FILTER MACHINES: 55.3 CPM OR 47.9% ABOVE BACKGROUND^^ which is negligible and a substantial drop since the last measurement in identical conditions just over two months ago on March 30, 2022.
2:00 pm PDST INT RADIATION STATION SANTA MONICA CALIFORNIA OFFICE BACKGROUND: 37.4 CPM^^
Monthly milestone radiation readings at EnviroReporter.com‘s Radiation Station Stats and Special Radiation Station Tests show no indications of additional airborne radiation resultant of Russia’s invasion of Ukraine, though that is to be expected considering no significant nuclear event has been detected.
Likewise our Eat Me! food testing and RadNet Air Monitoring have not picked up any additional radiation.
There are at least two factors to remember when nothing unusual is detected in this case. First, the source. EnviroReporter.com‘s 11 years of extensive radiation testing across the United States numbers over 10,000. Our Eat Me! food and drink monitoring has checked thousands of consumables for telltale beta radiation with an Inspector Nuclear Radiation Monitor.
The RadNet Air Monitoring has testing for beta and gamma radiation across America and really keeps a close eye on the big picture of possible radioactive events impacting the country regardless of their source or national origin. There are 142 EPA RadNet stations, with 483 live graphs, organized here testing for Gamma Gross Count Rate and Gamma Gross Count Rate by Channel Range as well as Gamma Exposure Rate and Beta Air Filter Results that are live-graphed continuously courtesy of the U.S. Environmental Protection Agency.
EnviroReporter.com‘s organization of these data makes it easier to monitor the radiation situation with current normal conditions, and how they look on the graphs, versus anything extraordinary and/or disastrous that may happen in the future. This is an invaluable resource in case of nuclear emergency.
March 30, 2022
9:35 pm PDST INT RSSMC DUST AGGREGATE FROM 3 HEPA FILTER MACHINES: 95.9 CPM OR 2.3 TIMES BACKGROUND^^
9:20 pm PDST INT RADIATION STATION SANTA MONICA CALIFORNIA OFFICE BACKGROUND: 41.3 CPM^^
February 21, 2022
6:45 pm PT INT RSSMC DUST AGGREGATE FROM 3 HEPA FILTER MACHINES: 92.3 CPM OR 2.4 TIMES BACKGROUND^^
6:25 pm PT INT RADIATION STATION SANTA MONICA CALIFORNIA OFFICE BACKGROUND: 38.5 CPM^^
January 17, 2022
2:15 pm PT INT RADIATION STATION SANTA MONICA RAIN: 44.9 CPM^^ or normal background
2:00 pm PT INT RADIATION STATION SANTA MONICA OFFICE BACKGROUND: 43.5 CPM^^
December 30, 2021
2:30 pm PT INT RSSMC DUST AGGREGATE FROM 3 HEPA FILTER MACHINES: 74.7 CPM^^ OR 1.7 TIMES BACKGROUND WHICH IS LOW
2:00 pm PT INT RADIATION STATION SANTA MONICA RAIN: 44.3 CPM^^ – Normal background thereby not contaminated by external event(s)
1:45 pm PT INT RADIATION STATION SANTA MONICA CALIFORNIA OFFICE BACKGROUND: 43.1 CPM^^
https://www.saveecobot.com/en/radiation-maps?s=09
Here is the link to the map
The gamma radiation around Chernobyl increased by an average of 300%. See under Radiological maps in Ukraine
The U.S. Department of Energy has undertaken another profoundly dishonest operation, in shipping “hot” nuclear waste to the Nevada Test Site, which is something forbidden under the Federal law the late Senator Harry Reid got enacted and which is still in effect:
https://www.usnews.com/news/best-states/idaho/articles/2022-01-12/us-acknowledges-shipping-idaho-radioactive-waste-to-nevada
It’s worth noting that the U.S. 9th Circuit Court of Appeals has opined in the SB 990 case that the Secretary of Energy is the Federal regulator in charge of nuclear waste from reactor meltdowns, which is what happened at Santa Susana Field Lab and is what happened at Idaho Falls. Even the radioactively contaminated dirt is classified as “nuclear waste” under the Secretary of Energy’s jurisdiction, according to that opinion, which the U.S. Supreme Court sustained without hearing a case.
Former Governor of Michigan, Corporate Democrat, Harvard Law Grad Jennifer Granholm, she of the immaculate bleached blond hairdo which is so phony at her advanced age, is the Secretary of Energy these days, even though from her resume it appears she had no experience for that job other than being a loyal Biden supporter.
Such a person we can all admire, Jennifer Granholm. She shafts the sick and dying kids around the Santa Susana Field Lab by not ordering Boeing to remediate the radioactive waste, and she also allows her dishonest employees to mislabel nuclear waste and deliver it to Nevada, where Federal law bars her from disposing of it.
And Even More Unbelievable, the DOJ Lead Criminal Prosecutor on the Boeing Case Mentioned in Earlier Links Has Become a Partner in the Huge Law Firm Representing Boeing in the Case She Prosecuted:
Follow-up to comment on JDSupra news story and court opinion on conduct of Boeing Directors and senior officers:
News about Deferred Prosecution Agreement Boeing reached with Trump Administration DOJ’s Criminal Division, coincidentally as announced by DOJ on the day after the Capitol Riot:
https://www.justice.gov/opa/pr/boeing-charged-737-max-fraud-conspiracy-and-agrees-pay-over-25-billion
One can assume that Boeing’s executives and lawyers were anxious to “get the deal done” to avoid the potential criminal prosecution carrying over into the Biden Administration.
Even more important news about families of victims in the 2 Boeing 737-Max crashes asking a Federal court to set aside the Deferred Prosecution Agreement which DOJ entered into with Boeing:
https://www.usnews.com/news/us/articles/2021-12-16/737-max-crash-relatives-ask-court-to-rescind-boeing-criminal-prosecution-immunity
The families’ request for a set-aside of the non-prosecution agreement brings to light the fact that the dollar amount of the “fine” paid by Boeing is remarkably similar to the amount Sherwin Alumina’s Officers & Directors Insurance policy paid to settle the breach of fiduciary duty case as described in my other December 2021 comment.
The online lawyer magazine JDSupra tells the tale of a lawsuit filed on behalf of Boeing’s shareholders/owners against the members of Boeing’s Board of Directors for allowing a climate of abject recklessness on aircraft safety issues which caused the two disastrous crashes of Boeing’s 737-Max airliners and grounded the production of the company’s most valuable cash income producing product line. According to JDSupra the Directors were portrayed in a highly unflattering light in the case. The members of the Board of Directors were covered by Officers & Directors Insurance, which is purchased by corporations to protect their shareholders from events of Director misconduct. https://www.jdsupra.com/legalnews/boeing-s-board-agrees-to-237-5-million-3235085/
The case settled recently for $237.5 Million which will be paid by the insurance company to the shareholders, as theoretical compensation for the Boeing Board of Directors’ errors and misconduct which led to decreases in value of Boeing stock owned by the shareholders. Because the money will be paid under a Settlement Agreement the members of Boeing’s Board of Directors will admit no liability for wrongdoing or negligence, and none will immediately lose their seats on the Board as a direct consequence of the lawsuit or its settlement.
What was particularly interesting about the JDSupra article is that it disclosed and linked to a formal opinion written by a judge of the Delaware Chancery Court which is the court with jurisdiction to rule on misconduct and negligence by the Boards of Directors and corporate officers of most of America’s large corporations, which are fairly uniformly incorporated in Delaware. (In Delaware Chancery Court judges are called “Chancellors” and “Vice Chancellors” but the title doesn’t change their judicial role in terms of issuing binding opinions.) The judge’s opinion is a real eye-popper and can be read here: https://courts.delaware.gov/Opinions/Download.aspx?id=324120 Because the case settled, the lawyers for the Boeing Directors won’t have the opportunity to erase or invalidate the judge’s opinion.
Readers of Enviroreporter who follow the travails of the people who live around the Santa Susana Field Lab might recognize the alleged conduct by the Boeing Board of Directors in the article, and as recounted and characterized by the Delaware Chancery Court judge’s Opinion and might think the allegations and characterizations have a familiar ring to them.
In the third in a continuing series of groundwater remediation lawsuits which the Whittaker-Bermite Community Advisory Group in Santa Clarita got rolling, by intensely lobbying their local water agencies to “sue the polluter” way back in 1999-2000, on FRIDAY 12/4/21 a U.S. District Court jury in LA rendered a $75 Million money damages verdict against Whittaker Bermite Corp. (a subsidiary of the British industrial giant Meggitt) payable to Santa Clarita Valley Water Agency, the drinking water provider in the Santa Clarita Valley of California. What did Whittaker do? Leaked VOCs into the ground water and refused to pay to remediate them starting 21 years ago when the first lawsuit was filed. There is yet more litigation to be done by the water agency’s lawyers (Nossaman Guthner) on that case, to try to get even more money out of Whittaker’s insurance company or Whittaker themselves, to pay for the cost of “cleaning up the source of 50+% Santa Clarita’s drinking water” but the verdict shows progress. What is fascinating is that the jury members were young, and they “totally got it” in terms of who should pay to clean-up environmental contamination.
Just like with Rocketdyne, justice for the public takes a long time, but it does happen if people are persistent. Take heart about that point, and share the victory in terms of feeling good!
Las Virgenes Open Space Preserve Officially Opens 18 Years Ago Today!
November 24, 2021
5:45 pm PT INT RSSMC DUST AGGREGATE FROM 3 HEPA FILTER MACHINES: 164.2 CPM OR 4.4 TIMES BACKGROUND^^
5:30 pm PT INT RADIATION STATION SANTA MONICA CALIFORNIA OFFICE BACKGROUND: 37.5 CPM^^
November 23, 2021
12:55 pm PDST INT RSSMC DUST VACUUM ONLY: 49.6 CPM OR 49.6 OR BACKGROUND^^
12:40 pm PT INT RADIATION STATION SANTA MONICA CALIFORNIA OFFICE BACKGROUND: 43.1 CPM^^
https://www.bloomberg.com/news/features/2021-11-02/china-climate-goals-hinge-on-440-billion-nuclear-power-plan-to-rival-u-s?utm_campaign=bn&utm_medium=distro&utm_source=msn
What could possibly go wrong?
[From Michael Collins: To answer Another Simi Mom, rhetorically yet realistially, everything. EnviroReporter.com‘s coverage began in 1998 of the worst partial nuclear reactor meltdown in U.S. history which happened above Simi Valley at the Santa Susana Field Laboratory’s Sodium Reactor Experiment in 1959. Our reporting on this site, commonly known as Rocketdyne led to the creation of adjacent Ahmanson Ranch as preserved open space in 2003.
Now comes the film version which will bring this story to massive audiences from MSNBC Films with their first documentary feature film called In the Dark of the Valley.
The documentary’s trailer takes tragedy and makes art and sense of it for all sorts of folks who will be entertained and outraged.
Here’s what MSNBC Films has to say about their documentary:
A Southern California mother discovers that the Santa Susana Field Lab, the site of one of the largest nuclear accidents in U.S. history, is located only 7 miles from her home. Concealed from the public eye for 20 years and never fully cleaned up, she grapples with the idea that the site may be responsible for exposing her daughter and community to cancer-causing radioactive waste. The feature documentary, directed by Nicholas Mihm, airs Sunday, November 14th at 10 p.m. ET on MSNBC.
The Chinese people should be made aware of what their totalitarian government is getting into. Would translated, dubbed or subtitled versions of this potent and illuminating film benefit the Chinese people? Would, say, 150 translated copies of this piece be distributed on DVD there every year for 15 years? The power of the Internet puts that decision in your hands, not the iron fists of the Chinese government.
Look at what EnviroReporter.com has done since it began 15 years ago. Gifting the Chinese people the terrifying truth of nuclear power gone wrong would be the greatest present one could give this august and ancient peoples. It worked here. It can work there.]
October 4, 2021
5:35 pm PDST INT RADIATION STATION SANTA MONICA RAIN: 41.6 CPM^^ or normal background
5:20 pm PDST INT RADIATION STATION SANTA MONICA OFFICE BACKGROUND: 41.0 CPM^^
August 20, 2021
12:55 pm PDST INT RSSMC DUST AGGREGATE FROM 3 HEPA FILTER MACHINES + VACUUM DUST/DEBRIS: 69.3 CPM OR 65.8% ABOVE BACKGROUND.^^
12:40 pm PDST INT RADIATION STATION SANTA MONICA CALIFORNIA OFFICE BACKGROUND: 41.8 CPM^^
Texas legislators are, once again, being hypocrites. Two nuclear power plants are located in Texas, but apparently even spent fuel rods from those reactors are just too dangerous for Texan sensibilities:
CHINA NUCLEAR EVENT UPDATE
Comment:
Since my last post I have found that the whole Hong Kong Observatory radiation monitoring site has been given a complete make over.
The Taishan Nuclear Power Plant in Guangdong province is located 85 miles west of Hong Kong.
You can now find the up to date hourly average ambient radiation dose rate information in Hong Kong, here.
https://www.hko.gov.hk/en/radiation/monitoring/index.html
20th June 2021 – As Chinese Nuclear Incident Unfolds, Expert Falls Off Building & Dies
Extract:
Ministry of Ecology and the Environment, responsible for news around nuclear power plants, also said no leak into the environment had occurred. “At present, monitoring results of the radiation environment around the Taishan Nuclear Power Plant show that there is no abnormality in the radiation level around the nuclear power plant,” the statement said.
The housings of about five of the more than 60,000 fuel rods in the Number One reactor are estimated to have been damaged, accounting for less than 0.01 percent of the total number, far lower than the assumed maximum damage proportion of 0.25 percent in the design for the reactor, it said.
With the jet stream able to transport radioactive particles and gases far from their source, people around the world are continuing to keep their eye on whatever is unfolding at the nuclear power plant. While China admitted that a leak of radioactive gas did make it into the environment in April, they say no radioactive gas or matter has escaped into the environment in this latest incident. During April 9 incident, the Taishan facility leaked what officials described as a “small amount” of radioactive gas. The Chinese National Nuclear Safety Administration said that event was a “Level 0” event that lacked safety significance.
Nevertheless, scientists continue to track wind movement for any potential cloud of suspicious gas rising from the nuclear power plant.
Current Leak at Nuclear Power Plant in China (Not Japan):
This is a situation to watch closely, in no small part because governments have a strong tendency NOT to be truthful with the public about health and safety risks members of the public face:
https://www.cnn.com/2021/06/14/politics/china-nuclear-reactor-leak-us-monitoring/index.html
&
Not Surprising, the Commenters on the Washington Post Do Not Believe What Chinese Gov’t Has to Say About Taishan Plant Troubles:
https://www.washingtonpost.com/world/2021/06/14/china-nuclear-plant-leak/
14th June 2021 – Exclusive: US assessing reported leak at Chinese nuclear power facility
Extracts:
The company, mainly owned by Électricité de France (EDF), a French utility company, then submitted an operational safety assistance request on June 3, formally asking for a waiver that would allow them to address an urgent safety matter, to the Department of Energy, warning American officials that the nuclear reactor is leaking fission gas.
Framatome reached out to the US government for assistance, the document indicates, because a Chinese government agency was continuing to increase its limits on the amount of gas that could safely be released from the facility without shutting it down, according to the documents reviewed by CNN.
“If they do have a gas leak, that indicates some of their containment is broken,” Rofer said. “It also argues that maybe some of the fuel elements could be broken, which would be a more serious problem.”
Comment:
China has hardly any publicly available monitoring stations available on the Internet, so unless the radioactive gas release flows in an easterly direction offshore, it may be hard to get any publicly reliable detection information.
For those who are interested, you could keep an eye on the situation by using the list of International monitoring stations located here.
https://sccc.org.au/international-radiation-monitoring-stations
Note: The Hong Kong monitoring station in this list does not appear to be working anymore, as the last readings were in late November 2018.
Taiwan does have a very good publicly available radiation monitoring system, so if there was any offshore release that headed in their direction, their system would very likely detect it.
Article:
https://edition.cnn.com/2021/06/14/politics/china-nuclear-reactor-leak-us-monitoring/index.html
The COVID-19 pandemic led to a surge in rollerskating popularity in 2020, which is fantastic. Now, just in time for Summer 2021, EnviroReporter.com shares the first of three inline skating articles that explore the world of 1) the best recreational skate path in Los Angeles; 2) some of the most insane and challenging long distance skate “jaunts” in Southern California; and 3) where to find the best downhill skate slaloms in the Southland.
Here’s our first piece called “SMOOTH SKATING” featuring inline speed skater “Derby” (aka Denise Anne Duffield, Editor of EnviroReporter.com)
https://www.enviroreporter.com/investigations/other-environmental-stories/smooth-skating/
+++++++++++++++++++++++++++++++++++++++++++++++++++++++++++++++++++++++++++++++++++++++++++++++++++++++++++++++++++++++++++++++++++++++++++++++++++++++++++++++
There is nothing more liberating after a punishing pandemic than a sixty mile inline speed skate on a “jaunt.” This is extreme long distance speed skating on beautiful routes throughout Southern California that are nearly as fun to imagine as to actually skate. Check out “ROLL ON!”
https://www.enviroreporter.com/investigations/other-environmental-stories/roll-on/
+++++++++++++++++++++++++++++++++++++++++++++++++++++++++++++++++++++++++++++++++++++++++++++++++++++++++++++++++++++++++++++++++++++++++++++++++++++++++++++++
Long distance speed skater Derby knows the dangers of going down. Hard. That’s why she wears protective gear and knows which hills to slalom. You will too reading “BEST STREET SKATING SLALOMS”
https://www.enviroreporter.com/investigations/other-environmental-stories/best-street-skating-slaloms/
May 25, 2021
2:15 pm PDST INT RSSMC DUST AGGREGATE FROM 3 HEPA FILTER MACHINES + VACUUM DUST/DEBRIS: 68.9 CPM OR 67.2% ABOVE BACKGROUND.^^ Did the May 15, 2021 Pacific Palisades Fire impact this reading? Unlikely.
2:00 pm PDST INT RADIATION STATION SANTA MONICA CALIFORNIA OFFICE BACKGROUND: 41.2 CPM^^
May 10, 2021
4:00 pm PDST EXT INTERSECTION RUNKLE HAUL ROAD/ALBERTSON FIRE ROAD: 60.5 CPM^^
2:30 pm PDST EXT RUNKLE CANYON PARK – SOUTH PARKING LOT: 48.3 CPM^^
At Chernobyl: Nuclear reactions, located in inaccessible part of the plant, discovered to be smoldering like a barbeque:
https://www.independent.co.uk/news/world/europe/chernobyl-explosion-nuclear-radiation-ukraine-b1845672.html
Below is a story of seemingly left wing political behavior in Texas. The politics in the story is very obnoxious to me, having traveled throughout rural Texas and read their little local newspapers which spew right wing politics while at the same time ranting about the risk to Texans of the transport of high level nuclear waste on U.S. 20 anywhere near Texans’ beloved Dallas/Fort Worth or their holyland, the area where the Permian Oil Basin is located, surrounding Midland/Odessa.
https://www.caller.com/story/news/local/texas/state-bureau/2021/05/05/bill-cut-fees-texas-radioactive-waste-dump-operator-derailed/4921796001/?utm_source=caller-Daily%20Briefing&utm_medium=email&utm_campaign=daily_briefing&utm_term=hero
I’ve been to the dry desert county in West Texas where storage of spent nuclear fuel rods is proposed. Geographically, it’s closer to San Diego than to Houston and the Sabine River forming East Texas’ border. It’s called Andrews County and is due east of the far southeast corner of New Mexico where WIPP is located and where parts for nuclear bombs are manufactured every day. That’s where the proposed nuclear waste disposal site in Texas is proposed, as referred to in the newspaper story linked above.
I find it more than hypocritical that even though Texas has two fully operating nuclear power reactors, and even though Texas politicians are the most obnoxiously “business friendly” folks you’re ever going to meet, in the minds of Texas politicians every part of Texas must be held sacrosanct from being spoiled by the disposal of Texas’s own nuclear garbage, let alone anyone else’s.
As shown in the article linked above, Texan politicians and the state’s large land/ranch/farm owners would much rather Texas’ own high level nuclear waste be disposed of “somewhere else”, such as in Nye County Nevada, where local politicians and business people would rather “make a buck” by putting their own people a physical risk of harm from shipment of high level nuclear waste from all over the USA.
The article linked above from a “mainstream” Texas newspaper owned by Hearst illustrates that while there are many Texans who support “Texit” it’s unlikely the Texit politicos and zealots will be willing to bear the burden of “nationhood” and store Texas’ own nuclear waste from their own nuclear power plants.
12th April 2021 – Japan Decides To Dump One Million Tons Of Radioactive Fukushima Water Into The Pacific; IAEA Approves
Extract:
But wait… we thought that “scientists” said it was safe: does China and South Korea practice a different “science” – one where a million tons of radioactive water getting dumped into the ocean is actually – gasp – dangerous.
Could it be that we have two “scientific” camps, one of which is motivated by things far more mundane than the scientific method to reach its conclusion. Things such as money?
Of course, for Japan which prints trillions of said money every months, it’s not a concern, and that’s music to the “scientists” ears. Suga said the IAEA and other third parties will be involved in the plan, ensuring it is carried out with transparency. We can only assume that the “third parties” will also receive copious amounts of money to find that nothing is wrong here.
https://www.zerohedge.com/markets/japan-decides-dump-one-million-tons-radioactive-fukushima-water-pacific-iaea-approves
There is much more than radioactive tritium in that water!!!
23rd October 2020 – Greenpeace Warns ‘Potential Damage to Human DNA’ at Risk With Japan’s Plan to Dump Fukushima Water Into Ocean
Extracts:
According to the report,
If the contaminated water is discharged to the Pacific Ocean, all of the carbon-14 will be released to the environment. With a half-life of 5,730 years, carbon-14 is a major contributor to global human collective dose; once introduced into the environment carbon-14 will be delivered to local, regional, and global populations for many generations.
Contrary to the understanding of the Japanese government, water that contains large quantities of radioactive carbon-14 (as well as the other radioactive isotopes including strontium-90 and tritium) can only be described as contaminated.
Comment:
It is important for the health of the whole planet that this radioactive contaminated water must be prevented from being released into the Pacific Ocean. The Japanese government want to use the already stressed Pacific Ocean as a cheap dump for the environmental disaster waste they are responsible for. They have been running a public relations campaign for years now claiming that this radioactive water only contains tritium, when in fact it contains a radioactive soup of different harmful isotopes.
https://www.commondreams.org/news/2020/10/23/greenpeace-warns-potential-damage-human-dna-risk-japans-plan-dump-fukushima-water
Tritium is much more dangerous than they want the public to know!!!
04.12.2011 – Radioactive Berkeley: No Safe Dose
Extracts:
The video also expressed a public concern over children visiting the Lawrence Hall of Science to exposure to tritium emissions from the Lawrence Berkeley National Laboratory’s (LBNL) National Tritium Labeling Facility.
Comment:
This video brings up a lot of independent research on the biological effects of radioactive Tritium releases. That Tritium is something to be very concerned about.
http://www.youtube.com/watch?v=wf4G0NRBfqY
Despite having 2 operating nuclear power plants called Comanche Peak Nuclear Power Plant and South Texas Nuclear Generating Station, officials of the State of Texas are proposing to outlaw disposal of high-level nuclear waste in their state. Property owners in Andrews County Texas have proposed using naturally occurring subterranean caves for that purpose. Andrews County is due east of and directly adjoining Hobbs, NM which has several nuclear processing and storage facilities.
March 10, 2021
1:50 am PST INT RADIATION STATION SANTA MONICA RAIN: 41.5 CPM^^ or normal background
1:15 pm PST INT RADIATION STATION SANTA MONICA OFFICE BACKGROUND: 42.8 CPM^^
March 3, 2021
11:00 am PST INT RADIATION STATION SANTA MONICA RAIN: 57.4 CPM^^ or 26.2% ABOVE BACKGROUND
10:45 am PST INT RADIATION STATION SANTA MONICA OFFICE BACKGROUND: 45.5 CPM^^
January 28, 2021
7:30 am PST INT RADIATION STATION SANTA MONICA RAIN: 45.3 CPM^^ or normal background
7:15 pm PST INT RADIATION STATION SANTA MONICA OFFICE BACKGROUND: 44.7 CPM^^
POSTED MARCH 8, 2021
19th February 2021 – Water leaks indicate new damage at Fukushima nuclear plant
Extract:
Cooling water levels have fallen in two reactors at the wrecked Fukushima nuclear plant since a powerful earthquake hit the area last weekend, indicating possible additional damage, its operator said Friday.
Tokyo Electric Power Co. spokesman Keisuke Matsuo said the drop in water levels in the Unit 1 and 3 reactors indicates that the existing damage to their primary containment chambers was worsened by Saturday’s magnitude 7.3 quake, allowing more water to leak.
Meanwhile, the Tokyo High Court on Friday held the government as well as TEPCO accountable for the 2011 nuclear disaster, ordering both to pay about 280 million yen ($2.6 million) in compensation to more than 40 plaintiffs forced to evacuate to Chiba, near Tokyo, for their lost livelihoods and homes.
Comment:
After nearly ten years the government and TEPCO have been found accountable. The victims are still suffering, and the disaster is ongoing! In my opinion, that is extremely poor compensation for all the pain and suffering those people have been through, because of this disaster. Plus there are still large numbers of victims who have not been compensated at all!
https://apnews.com/article/water-leaks-fukushima-new-damage-a7ecf765d0233b1cad7332ff9fed5ffe
2nd January 2021 – Fukushima Radiation Levels: ‘Worse’ than Previously Thought
Extracts:
A massive amount of radioactive materials “attached to shield plugs of the containment vessels in the No. 2 and No. 3 reactors,” according to Japan’s Nuclear Regulation Authority (NRA).
The finding poses an “extremely serious” challenge to the shutdown process NRA has been attempting at the site, part of an overall decommissioning of the plant.
http://www.asahi.com/ajw/articles/14071742
December 14, 2020
11:30 am PST INT RADIATION STATION SANTA MONICA DUST AGGREGATE FROM 3 HEPA FILTER MACHINES + VACUUM DUST/DEBRIS: 79.9 CPM^^ OR 78.8% ABOVE BACKGROUND
11:15 am PST INT RADIATION STATION SANTA MONICA OFFICE BACKGROUND: 44.7 CPM^^
November 13, 2020
4:00 pm PST INT RADIATION STATION SANTA MONICA DUST AGGREGATE FROM 3 HEPA FILTER MACHINES + VACUUM DUST/DEBRIS: 70.1 CPM^^ OR 68.9% ABOVE BACKGROUND
2:35 pm PST INT RADIATION STATION SANTA MONICA OFFICE BACKGROUND: 41.5 CPM^^
October 12, 2020
2:30 pm PDST INT RADIATION STATION SANTA MONICA DUST AGGREGATE FROM 3 HEPA FILTER MACHINES + VACUUM DUST/DEBRIS: 58.6 CPM^^ OR 37.6% ABOVE BACKGROUND
2:05 pm PDST INT RADIATION STATION SANTA MONICA OFFICE BACKGROUND: 42.6 CPM^^
September 7, 2020
7:50 pm PDST INT RADIATION STATION SANTA MONICA DUST AGGREGATE FROM 3 HEPA FILTER MACHINES + VACUUM DUST/DEBRIS: 51.3 CPM^^ OR 29.9% ABOVE BACKGROUND
7:30 pm PDST INT RADIATION STATION SANTA MONICA OFFICE BACKGROUND: 39.5 CPM^^
July 20, 2020
6:10 pm PDST INT RADIATION STATION SANTA MONICA DUST AGGREGATE FROM 3 HEPA FILTER MACHINES + VACUUM DUST/DEBRIS: 44.5 CPM^^ or background
5:55 pm PDST INT RADIATION STATION SANTA MONICA OFFICE BACKGROUND: 42.6 CPM^^
July 6, 2020
1:40 pm PDST INT RADIATION STATION SANTA MONICA DUST AGGREGATE FROM 3 HEPA FILTER MACHINES + VACUUM DUST/DEBRIS: 45.1 CPM^^ OR 19.3% ABOVE BACKGROUND
1:20 pm PDST INT RADIATION STATION SANTA MONICA OFFICE BACKGROUND: 38.3 CPM^^
June 29, 2020
9:30 am PDST INT RADIATION STATION SANTA MONICA DUST AGGREGATE FROM 3 HEPA FILTER MACHINES + VACUUM DUST/DEBRIS: 54.2 CPM^^ OR 31.8% ABOVE BACKGROUND
9:15 am PDST INT RADIATION STATION SANTA MONICA OFFICE BACKGROUND: 41.1 CPM^^
June 23, 2020
12:45 pm PDST INT RADIATION STATION SANTA MONICA DUST AGGREGATE FROM 3 HEPA FILTER MACHINES + VACUUM DUST/DEBRIS: 47.7 CPM^^ OR BACKGROUND
12:30 pm PDST INT RADIATION STATION SANTA MONICA OFFICE BACKGROUND: 43.6 CPM^^
Southern Hemisphere November 2020 Background Level Report
Station location.
http://sccc.org.au/monitoring/Australian-Map.jpg
This short animation of Northern and Southern Hemisphere air circulation shows why we can get detections so far south.
November 2020 day average background chart. (Month Average 109 cpm)
November did not see as many ups and downs in local background as October, it was a much dryer month, with fewer storms.
November 2020 Background Level Chart
https://sccc.org.au/wp-content/uploads/2020/11/Caloundra-local-average-background-radiation-levels-November-2020.jpg
Disclaimer: This is an amateur volunteer run service. Human error can provide incorrect information, and equipment malfunction can produce false readings. Do not rely on, or take action upon information presented on this web site, without further research.
A serious emergency situation, at around 1 pm (12 noon CET) on December 10th, in Block 2 of the the Olkiluoto nuclear power plant on the western coast of Finland resulted in a reactor shutdown. The plant operator Teollisuuden Voima reported that the radiation levels within the nuclear power unit have increased, but no radioactivity has leaked out.
Southern Hemisphere October 2020 Background Level Report
Station location.
http://sccc.org.au/monitoring/Australian-Map.jpg
This short animation of Northern and Southern Hemisphere air circulation shows why we can get detections so far south.
October 2020 day average background chart. (Month Average 109 cpm)
October saw rather volatile swings in local background levels. This is our storm season, and when storms pass through during this time of the year, local area radon levels tend to increase. These radon increases occur when we get northern tropical air flows off the Pacific Ocean. I have set up a local live Radon detector, and I can see all this happening in real time, as the storms pass through the area.
October 2020 Background Level Chart
https://sccc.org.au/wp-content/uploads/2020/10/Caloundra-local-average-background-radiation-levels-October-2020.jpg
A page has been set up on the Sunshine Coast Computer Club Inc., web site so members can view the local live radiation monitoring station information. This local live radiation monitoring station is publicly available.
https://sccc.org.au/monitoring/sunshinecoast-monitoring-station.html
Disclaimer: This is an amateur volunteer run service. Human error can provide incorrect information, and equipment malfunction can produce false readings. Do not rely on, or take action upon information presented on this web site, without further research.
JAPAN
23rd October 2020 – Greenpeace Warns ‘Potential Damage to Human DNA’ at Risk With Japan’s Plan to Dump Fukushima Water Into Ocean
Extracts:
According to the report,
If the contaminated water is discharged to the Pacific Ocean, all of the carbon-14 will be released to the environment. With a half-life of 5,730 years, carbon-14 is a major contributor to global human collective dose; once introduced into the environment carbon-14 will be delivered to local, regional, and global populations for many generations.
Contrary to the understanding of the Japanese government, water that contains large quantities of radioactive carbon-14 (as well as the other radioactive isotopes including strontium-90 and tritium) can only be described as contaminated.
Comment:
It is important for the health of the whole planet that this radioactive contaminated water must be prevented from being released into the Pacific Ocean. The Japanese government want to use the already stressed Pacific Ocean as a cheap dump for the environmental disaster waste they are responsible for. They have been running a public relations campaign for years now claiming that this radioactive water only contains tritium, when in fact it contains a radioactive soup of different harmful isotopes.
https://www.commondreams.org/news/2020/10/23/greenpeace-warns-potential-damage-human-dna-risk-japans-plan-dump-fukushima-water
Southern Hemisphere September 2020 Background Level Report
Station location.
http://sccc.org.au/monitoring/Australian-Map.jpg
This short animation of Northern and Southern Hemisphere air circulation, shows why we can get detections so far south.
Local background has been stable here, nothing significant to report.
September 2020 day average background chart. (Month Average 107 cpm)
https://sccc.org.au/wp-content/uploads/2020/09/Caloundra-local-average-background-radiation-levels-September-2020.jpg
Disclaimer: This is an amateur volunteer run service. Human error can provide incorrect information, and equipment malfunction can produce false readings. Do not rely on, or take action upon information presented on this web site, without further research.
Southern Hemisphere August 2020 Background Level Report
Station location.
http://sccc.org.au/monitoring/Australian-Map.jpg
This short animation of Northern and Southern Hemisphere air circulation, shows why we can get detections so far south.
August 2020 day average background chart. (Month Average 107 cpm)
All is stable here. The background radiation levels for August was within season norms.
https://sccc.org.au/wp-content/uploads/2020/08/Caloundra-local-average-background-radiation-levels-August-2020.jpg
Disclaimer: This is an amateur volunteer run service. Human error can provide incorrect information, and equipment malfunction can produce false readings. Do not rely on, or take action upon information presented on this web site, without further research.
Southern Hemisphere July 2020 Background Level Report
Station location
http://sccc.org.au/monitoring/Australian-Map.jpg
This short animation of Northern and Southern Hemisphere air circulation, shows why we can get detections so far south.
July 2020 day average background chart. (Month Average 107 cpm)
All is stable here. The background radiation levels for July are within season norms.
https://sccc.org.au/wp-content/uploads/2020/07/Caloundra-local-average-background-radiation-levels-July-2020.jpg
Disclaimer: This is an amateur volunteer run service. Human error can provide incorrect information, and equipment malfunction can produce false readings. Do not rely on, or take action upon information presented on this web site, without further research.
Southern Hemisphere June 2020 Background Level Report
Station location
http://sccc.org.au/monitoring/Australian-Map.jpg
This short animation of Northern and Southern Hemisphere air circulation, shows why we can get detections so far south.
June 2020 day average background chart. (Month Average 107 cpm)
June average monthly background levels here are showing the usual seasonal variation. We see background levels drop here at this location in the southern hemisphere, during the winter months. The reason for this is that more seasonal winds start coming from the southern ocean air circulation, rather than from the tropics.
http://sccc.org.au/wp-content/uploads/2020/06/Caloundra-local-average-background-radiation-levels-June-2020.jpg
Disclaimer: This is an amateur volunteer run service. Human error can provide incorrect information, and equipment malfunction can produce false readings. Do not rely on, or take action upon information presented on this web site, without further research.
Did they already do it (again)?
Russia’s ‘doomsday drone’ prepares for testing.
One year after the fatal accident with a nuclear-powered missile in the White Sea, Russia’s weapon designers say a test launch for the Poseidon nuclear powered underwater drone will take place this fall. We don’t know yet.
What we know:
While iodine-131 is only measured in the north, in the Kirkenes area and at Svalbard, Swedish and Finnish radiation authorities inform about other isotopes blowing in the skies over southern Scandinavia.
“We found 0,9 microBq/m3 at Svanhovd and 1,3 microBq/m3 at Viksjøfjell.”
Finland’s Radiation and Nuclear Safety Authority (STUK) detected on June 16 and 17 small amounts of the radioactive isotopes cobalt, ruthenium and cesium (Co-60, Ru-103, Cs-134 and Cs-137).
All these isotopes indicate that the release comes from a nuclear-reactor. Iodine-131 has a half-life of 8 days, and given the small amount measured in the north, this isotope could be gone before the radioactive cloud reached the southern parts of Finland and Sweden a week after the first measurements in the north.
They say the radionuclides came from the direction of Western Russia.
27th June 2020 – Sensors detect rise in nuclear particles on Baltic Sea, global body says
Extracts:
VIENNA (Reuters) – Radiation sensors in Stockholm have detected higher-than-usual but still harmless levels of isotopes produced by nuclear fission, probably from somewhere on or near the Baltic Sea, a body running a worldwide network of the sensors said on Friday.
One of its stations scanning the air for radionuclides – telltale radioactive particles that can be carried long distances by the wind – detected unusually high levels of three radionuclides earlier this week: caesium-134, caesium-137 and ruthenium-103.
Comment:
The detections were on the 22nd and 23 of June. We are just hearing about it now, four days later!
This free community resource was created after the Fukushima nuclear catastrophe, so people could quickly locate International radiation monitoring stations, in the event of a major nuclear accident. It is regularly updated and includes a lot of private as well as government monitoring stations.
https://sccc.org.au/international-radiation-monitoring-stations
Article:
https://www.reuters.com/article/us-nuclear-particles-baltic/sensors-detect-rise-in-nuclear-particles-on-baltic-sea-global-body-says-idUSKBN23X2TN
UPDATE to PhoneGate Alert!
Two new smartphones have just been sanctioned for exceeding the SAR level: the Xiaomi Redmi 7 and the Gigaset plus. This is a new advance in our alert action!
However, we have been waiting since last October for the Government to deliver on its promise to update the excessive SAR levels of several hundred mobile phone models. We demand that the commitments made following the recommendations of the French National Health Agency (ANSES) be fulfilled.
The Covid19 crisis does not justify such a delay. The Phonegate scandal is also a real health emergency!
See here the list of the 23 smartphones sanctioned to date:
See also the list of hundreds of models awaiting government intervention :
https://www.phonegatealert.org/wp-content/uploads/2018/06/Dossier-de-presse-liste-des-mod%C3%A9les-%C3%A0-risques-28-juin-2018.pdf
Please share widely around you until we get the same thing all over Europe and internationally. Together we can do it!
The Phonegate Alert team
PhoneGate Alert!
Large numbers of mobile phones in use are emitting microwave frequency radiation way above the regulatory limit, when placed against the body. For safety reasons it would be wise to check if you are, or a family member is using one of these mobile phone models.
Independent scientific experts around the world have been saying for decades that the SAR’s regulatory limits are already set far to high to protect public health, and particularly children!
25th May 2020 – Withdrawal of the Razer Phone 2: not seeing the forest for the trees!
Extracts:
Since then, in two years, thanks to our action, 23 different smartphone models controlled by ANFR have been found to have SAR levels for the head and body above the regulatory limit of 2 W/kg during ANFR inspections. Four have been withdrawn from the French market. The others have only had their SAR level “updated” (reduced by updating).
However, tests conducted by both ANFR and the journalist Sam Roe for the Chicago Tribune have shown that the local body SAR level is multiplied by a factor of 3 to 4 when measured either at direct skin contact or at 2mm. That of the Razer Phone 2 could reach over 10 W/kg at direct contact with the skin.
“that the representative of the European Commission is hiding behind a staggering technocratic cynicism. His non-reaction shows the extent to which the mobile telephony industry lobbies have knowingly silenced the European authorities. We demand that this new health scandal, Phonegate, be treated with seriousness and a sense of responsibility. The health of hundreds of millions of Europeans citizen is at stake”.
Further information can be found at the PhoneGate web site.
https://www.phonegatealert.org/en
Southern Hemisphere May 2020 Background Level Report
Station location
http://sccc.org.au/monitoring/Australian-Map.jpg
This short animation of Northern and Southern Hemisphere air circulation, shows why we can get detections so far south.
May 2020 day average background chart. (Month Average 108 cpm)
Local background radiation levels for May have been stable.
https://sccc.org.au/wp-content/uploads/2020/05/Caloundra-local-average-background-radiation-levels-May-2020.jpg
Disclaimer: This is an amateur volunteer run service. Human error can provide incorrect information, and equipment malfunction can produce false readings. Do not rely on, or take action upon information presented on this web site, without further research.
May 18, 2020
8:45 am PST INT RADIATION STATION SANTA MONICA RAIN: 41.7 CPM^^ or normal background
8:15 am PST INT RADIATION STATION SANTA MONICA OFFICE BACKGROUND: 42.7 CPM^^
It is very likely that large numbers of people around the world are now suffering from vitamin D deficiency, after being confined to their homes for months. Even before the pandemic, large numbers of people were already vitamin D deficient.
Below is a link to a recent medical management protocol for COVID-19, released by the Eastern Virginia Medical School (EVMS) in the US. It points out that vitamin D deficiency could be a significant contributing factor leading to a serious outcome if one were to contract COVID-19. Also, on page three, there is a list of suggested supplements that may have a role in the prevention / mitigation of COVID-19.
EVMS CRITICAL CARE COVID-19 MANAGEMENT PROTOCOL
Developed and updated by Paul Marik, MDChief of Pulmonary and Critical Care Medicine Eastern Virginia Medical School, Norfolk, VAMay 5th, 2020
Extracts Page 3:
Prophylaxis
While there is very limited data (and none specific for COVID-19), the following “cocktail” may have a role in the prevention/mitigation of COVID-19 disease. While there is no high-level evidence that this cocktail is effective; it is cheap, safe and widely available.
• Vitamin C 500 mg BID and Quercetin 250-500 mg BID [1-5]
• Zinc 75-100 mg/day (acetate, gluconate or picolinate). Zinc lozenges are preferred. After 1 month, reduce the dose to 30-50 mg/day.[1,6-9]
• Melatonin (slow release): Begin with 0.3mg and increase as tolerated to 2 mg at night [10-13]
• Vitamin D3 1000-4000 u/day [14-20]
• Optional: Famotidine 20-40mg/day [21]
Extract Page 12:
Furthermore, Vitamin D insufficiency exacerbates the cytokine storm and likely increases the risk of death.
Document:
This EVMS document also contains information on suggested treatments if an infected person progresses into a more serious condition, where they need medical care.
https://www.evms.edu/media/evms_public/departments/internal_medicine/EVMS_Critical_Care_COVID-19_Protocol.pdf
(Note: If you are currently taking prescribed medications any self-medication should not be used without your doctor’s knowledge and approval. Non prescribed medications may have unwanted side effects, change the way prescription medicines being used work in your body, interact with alcohol and other drugs or treatments, Always check with your doctor first — especially if you have any health conditions.)
May 11, 2020
6:20 pm PDST INT RADIATION STATION SANTA MONICA DUST AGGREGATE FROM 3 HEPA FILTER MACHINES + VACUUM DUST/DEBRIS: 42.5 CPM^^ OR BACKGROUND
6:00 pm PDST INT RADIATION STATION SANTA MONICA OFFICE BACKGROUND: 44.5 CPM^^
May 4, 2020
2:30 pm PDST INT RADIATION STATION SANTA MONICA DUST AGGREGATE FROM 3 HEPA FILTER MACHINES + VACUUM DUST/DEBRIS: 57.3 CPM^^ OR 35.5% ABOVE BACKGROUND
2:10 pm PDST INT RADIATION STATION SANTA MONICA OFFICE BACKGROUND: 42.3 CPM^^
Southern Hemisphere April 2020 Background Level Report
Station location
http://sccc.org.au/monitoring/Australian-Map.jpg
This short animation of Northern and Southern Hemisphere air circulation, shows why we can get detections so far south.
April 2020 day average background chart. (Month Average 109 cpm)
Local background radiation levels for April were stable, with nothing significant to report.
https://sccc.org.au/wp-content/uploads/2020/04/Caloundra-local-average-background-radiation-levels-April-2020.jpg
Disclaimer: This is an amateur volunteer run service. Human error can provide incorrect information, and equipment malfunction can produce false readings. Do not rely on, or take action upon information presented on this web site, without further research.
Just In Time Supply Lines Breaking!
The Coronavirus pandemic and worldwide economic collapse is breaking the “just in time” supply lines for food growing, processing and delivery in many countries. All the indications are that food inflation and shortages are on the way. If you took notice of my previous article on earth changes, pointing to worldwide crop losses, that were occurring before Covid-19, you would have already set up a home garden. Your locality or country may be spared the worst of this, even so in the present world environment it would be very advisable to have a garden or microgreen system up and running, to supplement your families food requirements. If you are just getting started there are articles below that can help you, even if you are finding it difficult sourcing seeds at present.
Here is a recent article pointing to food inflation and food shortages. This is just one of numerous recent articles on this subject.
19th April 2020 – Meat Prices Suddenly Surge As Food Processing Plants Shut Down, With 1000s Of Tons Left To Spoil
Extracts:
The real takeaway here is that the supply chain for American staples was badly damaged by the outbreak, with the damage more extensive and stubborn than government officials have really acknowledged. Two months on, and millions of Americans are still having trouble finding toilet paper and sterilizing wipes. A comprehensive list of products in perpetual short-supply would be quite lengthy, at this point.
If closures like these continue, it could add further strain on the supply chain. Everywhere you look, you see experts talking about an overabundance of food thanks to the closure of restaurants, which has resulted in unprecedented levels of food waste. But sadly, thanks to the way our food distribution is set up, if there’s no way to process the products, package them and then distribute them to markets around the country, due to staff in lock down, then the food will spoil before it’s eaten.
Bottom line: Thanks to the surprising complexity of food supply chains, there’s a scenario where farmers are dumping milk and other product, factories and farms are closing or rolling back activity, causing the number of products getting to the shelves to fall, leading to instantaneous upward pressure on prices.
Article:
https://www.zerohedge.com/geopolitical/price-meat-climbing-quickly-more-food-processing-plants-close
Today the ABC in Australia has published an excellent article on planning a vegetable patch that produces all year round. Gardening is a great way to get fresh air and exercise. It is productive and a cost saving activity you can do during the lock down. Gets you away from all those device screens and is also excellent for the mind, body and soul.
Planning a vegetable patch that produces all year round.
https://www.abc.net.au/life/how-to-eat-from-your-garden-vegetable-patch-all-year/11096242
If you are having trouble sourcing seeds at present, the ABC also has this article.
How to grow fruit, vegetables and herbs from scraps
https://www.abc.net.au/life/growing-new-veggies-from-scraps/12128496
Tips For Building A Garden While Renting
Growing Microgreens
For those off you who are new here or who haven’t yet started a garden, microgreens are a very quick and efficient way to grow nutritious food. You can get a crop in a week to ten days instead waiting a month or more to get a crop from a home garden. It also takes up very little space. You can also use specialized indoor lighting to grow them if you need to. Here is some basic practical information to get you started.
https://www.livingsmartqld.com.au/posts/getting-started-with-microgreens
Good practical advice on how grow microgreens easily and efficiently.
There are also lots of great Youtube videos with excellent gardening and microgreen growing tips.
USA
10th April 2020 – Terrified Atomic Workers Warn That the COVID-19 Pandemic May Threaten Nuclear Reactor Disaster
Extracts:
Of critical importance: every 18-24 months each reactor must shut for refueling and repairs. Itinerant crews of 1000 to 1500 technicians travel to 58 sites in 29 states, usually staying 30-60 days. They often board with local families, or in RVs, hotels, or Air B&Bs.
Industry-wide the pandemic has brought working conditions to the brink of collapse. At Pennsylvania’s Limerick Generating Station, workers say they are “terrified” that the plant has become a “breeding ground…a complete cesspool” for the coronavirus. “I’m in a constant state of paranoia,” one technician told Carl Hessler, Jr., of MontcoCourtNews.
The industry is now using the coronavirus pandemic to rush through a wide range of deregulation demands. Among them is a move to allow radioactive waste to be dumped into municipal landfills.
Comment:
The Covid-19 pandemic is going to affect nuclear power plant safety worldwide. As nuclear workers become infected and taken out of the workforce all those countries with operating nuclear reactors will be facing the similar staffing and maintenance problems. Let’s pray and hope that governments around the world are capable of making very good decisions on how to deal with skilled nuclear worker shortages.
Article:
https://www.commondreams.org/views/2020/04/10/terrified-atomic-workers-warn-covid-19-pandemic-may-threaten-nuclear-reactor
Southern Hemisphere February & March 2020 Background Level Reports
Station location
http://sccc.org.au/monitoring/Australian-Map.jpg
This short animation of Northern and Southern Hemisphere air circulation, shows why we can get detections so far south.
March 2020 day average background chart. (Month Average 108 cpm)
Local background radiation levels for March were stable.
https://sccc.org.au/wp-content/uploads/2020/03/Caloundra-local-average-background-radiation-levels-March-2020.jpg
February 2020 day average background chart. (Month Average 109 cpm)
Local background radiation levels for February were stable.
https://sccc.org.au/wp-content/uploads/2020/02/Caloundra-local-average-background-radiation-levels-February-2020.jpg
Disclaimer: This is an amateur volunteer run service. Human error can provide incorrect information, and equipment malfunction can produce false readings. Do not rely on, or take action upon information presented on this web site, without further research.
“The radioactive cloud will reportedly reach Kyiv and parts of Kyiv Oblast adjacent to the exclusion zone on April 10-11. But it does not pose any risk to public health since the concentration of Caesium-137 is very low, Ukraine’s State Nuclear and Radiation Safety Center said in a statement on April 10. ” https://www.kyivpost.com/multimedia/photo/fires-rage-in-chornobyl-zone-but-no-radiation-risk-nuclear-agency-says-photos
10th April 2020 – Chernobyl fires: Radiation fears as firefighters struggle to contain blazes in radioactive zone
Extracts:
A senior environmental official, Egor Firsov, said at the weekend that radiation in the area was detected at 16 times higher than normal background levels.
A 27-year-old resident of a settlement near the exclusion zone is under investigation on suspicion of having started at least one of the local fires.
Comment:
Fires in the Chernobyl nuclear plant fallout contamination zones are always of concern, because they often release large amounts of radioactive fallout contamination back into the atmosphere.
These recurring fire events place the firefighters and local communities at risk of being exposed to significant radiation exposure.
https://www.9news.com.au/world/chernobyl-fires-radiation-concerns-radioactive-ash-nuclear-disaster-zone/3d363469-536e-4f57-b224-1b6e27810315
The fires in the contaminated forests around the damaged Chernobyl nuclear power plant are still not under control. The Ukrainian civil protection agency said that the fire spread to the surrounding grass areas. Three planes and three helicopters are in the air to help fight the fire. https://www.sciencedirect.com/science/article/pii/S0160412014002608?via%3Dihub
After the meltdown at the Chernobyl nuclear power plant in 1986, large amounts of radioactivity leaked out. The area directly around the nuclear power plant was hardest hit. The pine trees standing there, caught some of the radioactive particles and built them into their wood. Thats the problem now. A study from 2014 came to the conclusion that If around half of the forest in the exclusion zone burned down, we would have a renewed radioactive precipitation.
Two forest fires broke out on Saturday and spread over 250 acres in a forested area near the Chernobyl power plant. Firefighters in Ukraine are battling to extinguish the forest fires.
A Doctor Explains How to Make the Safest Face Mask
It utilizes a HEPA filter, which is much, much better than a cotton mask.
Directions for making masks: https://drive.google.com/file/d/1fW_Qrv_1J26Lgd1kawSWqqyKvbYOY2Fu/view
Mask patterns: https://drive.google.com/file/d/1gaiM3yZLalU1_7mlMeLR-3967A8cEu5H/view
Reusing Manufactured Medical Masks
1. It was found that dry heat disinfection (heating at 70 ℃ for 30 minutes) had the least effect on damaging the filtering mechanism, and the filtering effect could be maintained above 95%.
2. The disinfection method of spraying alcohol on the mask will destroy the electrostatic absorption of the mask, causing filtering efficiency of the mask lowering below 95%.
3. Other methods such as steamer damp heat method and high-pressure high temperature sterilization methods also made the filtering efficiency of the mask lower than 95%.In addition, high temperature and high-pressure method makes the mask seriously deformed.
4. The new coronavirus is sensitive to ultraviolet rays, and ultraviolet disinfection does not affect the filtration efficiency of respirators. However, the inactivation effect of viruses in mask fibers, which cannot be directly observed, is unknown. Therefore, it is not recommended.
Article:
https://www.imcclinics.com/english/index.php/news/view?id=83
Other DIY Mask Alternatives
Instructional video for sewing the Olson mask (COVID-19)
Updated pattern and more information can be found at: https://www.unitypoint.org/cedarrapids/sewing-surgical-masks.
Just want the PDF of the pattern go here: https://www.unitypoint.org/cedarrapids/filesimages/Coronavirus/003902oo-1%20Olson%20Mask%20V07.pdf
How to make your own mask: Hong Kong scientists reveal temporary solution for those unable to get protective gear because of panic buying and price-gouging
https://www.scmp.com/news/hong-kong/health-environment/article/3050689/how-make-your-own-mask-hong-kong-scientists
I’m very happy to see stats at RSSM still active during the coronavirus emergency. And, it’s also encouraging that radiation levels are going in the downward direction. Hopefully, all are well at RSSM. I have been self-isolating these past 10 days due to mild symptoms. Looks like I either have something else or it’s just a mild case. In any event, having read the advice on this website for the past six years, I feel adequately prepared for the current emergency. Not so much in terms of hand sanitizer or toilet paper mind you, but I am ready to bunker-up for an extended time for emergencies in general. Thank you to Michael Collins and Enviroreporter.com for keeping us informed and helping us to get ready for whatever may be coming our way. Stay safe and do try to stay indoors as much as possible.
March 23, 2020
6:00 pm PDST INT RADIATION STATION SANTA MONICA DUST AGGREGATE FROM 3 HEPA FILTER MACHINES + VACUUM DUST/DEBRIS: 53.2 CPM^^ OR 1.4 TIMES BACKGROUND which is considerably less than the previous period’s reading. This is due in part to the sealing of RSSM in light of the Coronavirus pandemic reducing outside particulates and the exterior reduced human activity which has greatly improved the air and diminished the dust. The radiation above background is just one sixth (1/6) that of the last assessment March 6, 2020.
5:40 pm PDST INT RADIATION STATION SANTA MONICA OFFICE BACKGROUND: 37.8 CPM^^
If implemented early, Social Distancing can potentially significantly lower the fatality rate off patients and medical staff during a pandemic.
13th March 2020 – Coronavirus fears prompt health officials to ask Australia’s leaders to ban events with more than 500 people.
Extract:
A senior West Australian doctor has called for all schools to be closed soon and for there to be no crowds allowed at events as the coronavirus spreads, declaring he wants his colleagues to stay alive. Coronavirus claims Coast event as others hang in balance
WA Australian Medical Association (AMA) president Andrew Miller posted on social media: “You want to go to the footy? I want my colleagues to stay alive.”
https://www.abc.net.au/news/2020-03-13/coronavirus-scott-morrison-coag-premiers-cancelling-events/12053382
Why, in this article, are these doctors saying they want their colleagues to stay alive?
This is why?
Look to Italy as an example. They have one of the best hospitals systems in the world. Their hospitals are well equipped, and they were prepared. The Italian public were also told everything was fine. They had two cases a month and a half ago.
On the 30th January 2020, had two Chinese tourists who tested positive for COVID-19.
By 24th February 2020, Italy had 229 confirmed cases and 6 fatalities.
On the 8th March 2020, Italy lock down a region with a population of 16 million people. By this time the number of confirmed cases had risen to 6,387 and deaths had risen to 366.
By 9th March 2020, Italy went into whole country lock down.
On 10th March 2020, there were 10,149 confirmed cases and 631 deaths.
Their hospitals systems are now completely overloaded because the viruses infection rate is exponential. Their staff are exhausted. They can’t treat all the patients. In situations like this, medical staff contract the virus. If you look around the Internet, top Italian medical doctors are telling everyone please don’t make the same mistakes we made.
If you don’t implement social distancing early in an outbreak, a country’s hospital systems can become totally overwhelmed very quickly. This means the fatality rate will increase by a factor of five to ten times or more.
If you implement social distancing in the very early stages of the outbreak, the hospital system has a chance. It spreads the load of infected patients over a longer period of time. This means that the hospitals and staff have a better chance to treat everyone effectively.
Social distancing means a lot more people and medical staff end up surviving the contagion, because many more people were able to get good medical care. See chart below.
https://media.juancole.com/images/2020/03/social-distancing-what-it-is-and-750×422.jpg
During a pandemic you don’t need to wait for a government directive to implement proper social distancing, start implementing it immediately. The sooner social distancing is implemented, the more lives will be saved. Watch this 6.29 minute video. This is what we all need to do. Our personal actions can potentially save a lot of lives.
16th March 2020 – Why fighting the coronavirus depends on you
March 12, 2020
12:20 pm PST INT RADIATION STATION SANTA MONICA RAIN: 47.7 CPM^^ or normal background
12:00 pm PST INT RADIATION STATION SANTA MONICA OFFICE BACKGROUND: 42.0 CPM^^
Three robust High Efficiency Air Particle (HEPA) filter air-cleaning and negative ion generating machines have kept EnviroReporter.com‘s Radiation Station Santa Monica air clean and refreshing since the advent of the ongoing triple meltdowns in Fukushima Japan in 2011 as we wrote in Eat Me! that year. One of our machine removes “99.97% of as small as 0.3 microns contaminant particles like pet dander, mold, viruses, bacteria and pollen,” according to a review of the Honeywell 17000-S Air Purifier. “The HRF-AP1 pre-filter has Activated Carbon filter in it. This will both help adsorb VOCs, gases, odors and trap larger particles such as dust, lint, fibers, pet hair & fur.”
EnviroReporter.com‘s air cleaners ‘harvest’ much of the dust and debris that we test for radiation (by vacuuming it off first). The air cleaners also remove viruses like the Coronavirus (COVID-19) making them potentially very effective in rooms in buildings where air is circulated and shared. Aston An added benefit is that HEPA machines filter out the radiation we regularly test for and find, as shown below. This latest test finds the dust/debris sample testing at 230% of background, which is actually a decrease from the previous period’s testing. The following reading is below the California Highway Patrol’s limit of 3.0 times background before a substance is considered hazardous requiring HAZ-MAT protocols.
March 6, 2020
1:00 pm PST INT RADIATION STATION SANTA MONICA DUST AGGREGATE FROM 3 HEPA FILTER MACHINES + VACUUM DUST/DEBRIS: 79.1 CPM^^ OR 2.3 TIMES BACKGROUND
12:40 pm PST INT RADIATION STATION SANTA MONICA OFFICE BACKGROUND: 35.0 CPM^^
This recent study shows how very important regular hand washing with soap and water is in preventing infection, and preventing the spread of a global pandemic!
There should be way more up front and visible public education on the importance of hand washing. Watch the educational video Germ Smart, how to wash your hands properly in the post below.
23rd December 2019 – Hand‐Hygiene Mitigation Strategies Against Global Disease Spreading through the Air Transportation Network
Abstract Extracts:
Centers for Disease Control and Prevention (CDC) and World Health Organization (WHO) consider hand hygiene as the most efficient and cost‐effective way to limit disease propagation.
Here, we use epidemiological modeling and data‐driven simulations to elucidate the role of individual engagement with hand hygiene inside airports in conjunction with human travel on the global spread of epidemics. We find that, by increasing travelers engagement with hand hygiene at all airports, a potential pandemic can be inhibited by 24% to 69%.
https://onlinelibrary.wiley.com/doi/full/10.1111/risa.13438
Coronavirus COVID-19, first line of defense!
It is my opinion, as the Coronavirus virus spreads around the World, a number of governments will hide the true infection numbers. They will do this to shield their economies against the resulting economic shock that would result by them revealing the true numbers. This could work if the infected numbers remain manageable.
If they lose control, and the infection numbers dramatically increase all of a sudden, you could find your everyday life turned upside down. Within a a very short period of time large parts of your country, towns or districts could be placed under quarantine.
This may not happen in your location. Lets hope it doesn’t. If it does, having the proper knowledge, skills and equipment on hand will greatly improve your family’s chances of of avoiding infection. Do research, bookmark, printout, and download instructional information that will provide your family with the necessary knowledge and skills.
Example, lets start with preventing infection, your family’s first line of defense!
As the Coronavirus spreads Worldwide large numbers of people are purchasing, goggles, gloves, masks, sanitizers and disinfectants etc.
That maybe a great idea, but next to useless exercise if you don’t know how to sanitize, or use the equipment correctly!
The skills provide in the instruction videos below could significantly improve your family member’s chances of avoiding infection.
It is better for all the members of your family to practice and master these techniques now, than wait until the last minute. Remember, for this to work, all the family members will need to work together as a well oiled team.
Don’t just rely on the information presented here, do more research, as there is much more you will need to know.
Firstly and most importantly keep your hands away from your face!
You think you have been washing you hands correctly all these years? Well sorry to say the vast majority of you haven’t been!
Germ Smart – How To Wash Your Hands
I would also suggest that you stop wearing hand jewelry, watches, false nails or nail varnish, plus keep your nails as short a possible. Doing this will significantly improve the effectiveness of using this hand washing technique.
https://www.youtube.com/watch?v=riApbjnhLfc
Medical Respirators N95 Fitting Instructions
To get a good seal of a facial mask like this, it will be important for men to remove facial hair.
There are detailed written instructions in the “Show More” description area under the video.
https://www.youtube.com/watch?v=05wyH1-mLGk
Face Mask vs Respirator Comparison by 3M
https://www.youtube.com/watch?v=Gdsy_sZnBZg
Eye Protection
With the potential for COVID-19 to infect through the eyes, it will be import to use whatever eye protection you have available, goggles, wrap around safety glasses, sunglasses, ordinary glasses etc.
Putting on Sterile Gloves
Again, I would also suggest that you also stop wearing hand jewelry, watches, false nails and keep your finger nails as short a possible. These sharp items can puncture the gloves.
https://www.youtube.com/watch?v=PH_cyaqdT3k
Proper Disposable Glove Removal
Personal Protective Equipment (PPE)
Obviously, most of you will not be wearing a full PPE kit. It is still very important to know in what order and how to remove the equipment that you are wearing.
Cleaning and Sanitizing (Food Preparation Areas)
How to Properly Disinfect Surfaces to Kill Germs
This is a commercial product video, I have put it in this list because it provides important information.
Look around your environment for those surfaces that are frequently touched by people. They are the surfaces that will need to be sanitized often. Some surfaces can be damaged by some cleaning and sanitizing chemicals, particularly electronic devices, so do your research first before applying!
https://www.youtube.com/watch?v=0jhHEbNlgAw
Important
6 Cleaning Products Combinations To NEVER Mix
Phone Soap Tested on Discovery Channel
With just about everyone addicted to their mobile phone, it would be a very good idea to learn how to sanitize it properly. These devices can be a significant vector in the spread of a contagion. Use speaker phone, texting and avoided placing it on your head or face. Stop using it, or limit its use to absolutely essential calls if possible.
If you touched the outside of the Phone Soap device with your hands as you placed the phone into the device, you will then need to also sanitize the outside of the Phone Soap device, and your hands before removing the phone. There are a number of other phone and tablet sanitizing systems out there that are based on wipes and cloths, that you could research.
Toilet Seat
Put the toilet lid down before flushing the toilet. This will help contain potential aerosol contaminated water droplets from entering the home, or business environment.
RUSSIA
This Reuters article provides detailed information on the likely source of the recent 60x background level radiation detection in Moscow. The report is in English.
11th December 2019 – Russians protest over plans to build road near Soviet-era radioactive waste site
Extracts:
The 34-km (21-mile) road, which city authorities say is safe and will help ease traffic, is set to pass the Moscow Polymetal Plant and a fenced-off site where it disposed of radioactive substances decades ago.
“The thing is, the presence of this nuclear waste dump and its danger are not being acknowledged by the people in charge of construction,” she said. “But it’s obviously not safe for the people living here.”
Article:
https://www.reuters.com/article/us-russia-nuclear-waste-idUSKBN1YE202
February 19, 2020
12:45 pm PST INT RADIATION STATION SANTA MONICA DUST AGGREGATE FROM 3 HEPA FILTER MACHINES + VACUUM DUST/DEBRIS: 101.1 CPM^^ OR 2.4 TIMES BACKGROUND
12:25 pm PST INT RADIATION STATION SANTA MONICA OFFICE BACKGROUND: 41.9 CPM^^
February 2020 – Moscow recorded a 60-fold excess of radiation levels in the area of the new highway. Ministry of Emergencies denies everything Evgenia Malyarenko, Natalya Telegin
Extracts:
Local residents and activists who are on duty on the slope of the Moscow River, where authorities are planning to build a new expressway – the Southeast Chord, recorded five surges in radiation over the past weekend in this area. They reported this to Open Media. The highest level – 18.06 microsievert per hour – the FSUE Radon sensor on the slope showed on the evening of February 9. The corresponding video on his Facebook page was published by the municipal deputy from the Pechatniki District Sergey Vlasov. He noted that the recorded indicators are 60 times higher than the norm.
A radiation repository in the construction area of the new highway New Highway – the Southeast Chord, which, according to city authorities, should connect the Enthusiasts Highway and the Warsaw Highway, is being built in the south of the capital near the Kolomenskoye Park. The project received wide publicity last summer, when activists found that the construction zone of the chord passes through a radioactive repository.
Quote:
“After that, the leadership of Radon arrived on the slope urgently, the parliamentarian said. Representatives of the enterprise suggested that such jumps were caused by “electrical interference”, the deputy explained. Later, the director general of the Radon Federal State Unitary Enterprise Alexey Luzhetsky explained officially the failure of high radiation rates in the capital. “Since the sensor is still in setup mode, the readings may be confused.”
Was the detection equipment malfunctioning?
This type of radiation detection equipment is already calibrated and tested, before it is located at a site.
Article: (In Russian, so you will need to use Google translate.)
https://openmedia.io/news/n1/aktivisty-zafiksirovali-60-kratnoe-prevyshenie-urovnya-radiacii-v-rajone-novoj-avtostrady-mchs-vsyo-otricaet/
I have an acquaintance in Santa Clarita named Carl Goldman. He and his wife Jeri own a local radio station. They are passengers on the Diamond Princess, the ship which is quarantined in Yokohama. Carl has been writing a daily diary which is posted on his radio station’s website, telling his friends what is happening with the quarantine.
Traveling with the Goldmans are a couple with the last name Jorgenson. They used to live in Santa Clarita. I don’t know them. Apparently on Friday Mrs. Jorgenson (also named Jeri) was taken away by Japanese government officials because she “tested positive” for the new corona virus. Her husband did not test positive, so he is being shipped home to the USA today, for quarantine here.
Incredibly, the Japanese government is sending the latest coronavirus patients to a hospital in Fukushima!
What an outrage.
Update on Dimitrovgrad radiation leak in Russia.
8th February 2020 – What is known about the institute where the radioactive release occurred
Extracts:
The Research Institute of Atomic Reactors (SSC RIAR) is located in the Ulyanovsk Region in the city of Dimitrovgrad, which residents themselves call the “atomic capital.”
According to experts from the Business Online publication, the greatest danger to the Middle Volga region is the BOR-60 fast neutron reactor operating in NIIAR. And one of the main dangers lies in its coolant, which is sodium.
So, the summer of 1997, when an increased release of radioactive iodine-131 began at one of the NIIAR facilities, lasting almost three weeks. Moreover, on some days, the limit level for the emission of iodine-131 in the RIAR exceeded 15-20 times. Local residents continue to sue the university so far and require official documentation of what happened.
In April 2000, an emergency occurred at the VK-50 reactor, which threatened to turn into a “Chernobyl” catastrophe: one of the three emergency protection cassettes spontaneously plunged into the active zone due to a break in the lower thermal insulation of the actuator that fell on the emergency protection working body. The Gosatomnadzor inspection then suspended the VK-50 reactor.
In 2011, information on radiation emissions at the institute was already appearing on the network. Concerned residents called the city hall, saying that an accident had occurred at the RIAR base. But then the press service of the institution told Interfax that there was no accident.
In 2017, RBC wrote about the contamination of part of Russia with the radioactive isotope ruthenium-106. Then Europe suffered from it, which also received a dose of ruthenium. Experts argued that the production of ionizing radiation sources based on ruthenium-106 is in Dimitrovgrad.
On February 3, 2020, in Dimitrovgrad, on the territory of the Research Institute of Atomic Reactors (SSC RIAR), radioactive pollution of snow was recorded. Now the background radiation level is also normal, according to the institution. Journalists investigating this case found that minor pollution with radium-226 is present only at site No. 1 of the institute itself, where the release occurred. Radium-226 is formed during the decay of uranium. The half-life of radium-226 is 1,600 years.
Comment:
With this type of history, this site is just an accident waiting to happen!
“Now the background radiation level is also normal, according to the institution. Journalists investigating this case found that minor pollution with radium-226 is present only at site No. 1”
Which Journalist, and what news organisation do they represent?
This appears to be the usual nuclear industry propaganda, that is disseminated to calm the population.
Article: (In Russian, so you will need to use Google translate)
https://inkazan.ru/news/incident/08-02-2020/chto-izvestno-ob-institute-gde-proizoshel-radioaktivnyy-vybros
Southern Hemisphere January 2020 Background Level Report
Station location
http://sccc.org.au/monitoring/Australian-Map.jpg
This short animation of Northern and Southern Hemisphere air circulation, shows why we can get detections so far south.
January 2020 day average background chart. (Month Average 110 cpm)
At this location radiation levels have been very stable, compared to the wild swings detected just after 3/11.
http://sccc.org.au/wp-content/uploads/2020/01/Caloundra-local-average-background-radiation-levels-January-2020.jpg
Disclaimer: This is an amateur volunteer run service. Human error can provide incorrect information, and equipment malfunction can produce false readings. Do not rely on, or take action upon information presented on this web site, without further research.
RUSSIA
4th February 2020 – In Dimitrovgrad, radiation leaks occurred. Residents bought up drugs with iodine
(Below is a Google translation of this report.)
Extacts:
There is information that yesterday there was a slight pollution of the snow due to the leakage of a radioactive substance. However, employees of the enterprise report that the radiation level is not exceeded. Yesterday, city residents were asked not to leave their homes. Today, due to an emergency, some of the employees in RIAR did not go to work, Khvorov described the situation.
The Ulyanovsk media also reported that yesterday, due to the leakage of radioactive substances at RIAR, the children were not allowed to leave the city on time. According to official data, now the radioactive background in RIAR itself and beyond does not exceed the norm.
Comment:
Here is the google map location of Dimitrovgrad in Russia, zoom out to see the world map.
[Editor: Here is the location of the Research Institute of Atomic Reactors (NIIAR) in Dimitrovgrad]
If I find anymore information I will post it here.
Article:
https://www.idelreal.org/amp/30416600.html
February 9, 2020
2:30 pm PST INT RSSMC OFFICE RAIN SAMPLE: 79.5 CPM^^ or 66% ABOVE NORMAL BACKGROUND
2:10 pm PST INT RSSMC OFFICE BACKGROUND: 47.9 CPM^^
January 16, 2020
11:40 pm PST INT RSSMC OFFICE RAIN SAMPLE: 40.6 CPM^^ or normal background
11:25 pm PST INT RSSMC OFFICE BACKGROUND: 41.8 CPM^^
January 2, 2020
8:45 pm EST INT SOUTHWEST MICHIGAN ROOM FIRST FLOOR SNOW SAMPLE: 38.4 CPM^^
8:30 pm EST INT SOUTHWEST MICHIGAN ROOM FIRST FLOOR BACKGROUND: 44.1 CPM^^
11:00 am EST INT SOUTHWEST MICHIGAN ROOM FIRST FLOOR BACKGROU 36.0 CPM^^
December 30, 2019
8:45 pm EST INT SOUTHWEST MICHIGAN ROOM FIRST FLOOR SNOW SAMPLE: 95.0 CPM^^ OR 120.9% OVER BACKGROUND
8:10 pm EST INT SOUTHWEST MICHIGAN ROOM FIRST FLOOR BACKGROUND: 43.0 CPM^^
7:00 pm EST INT SOUTHWEST MICHIGAN ROOM FIRST FLOOR BACKGROUND: 45.2 CPM^^
December 29, 2019
10:25 pm EST INT SOUTHWEST MICHIGAN ROOM FIRST FLOOR RAIN SAMPLE: 54.2 CPM^^ OR 21.8% OVER BACKGROUND
10:10 pm EST INT SOUTHWEST MICHIGAN ROOM FIRST FLOOR BACKGROUND: 44.5 CPM^^
The location of the radiation monitoring equipment used for the December 2019 radiation report below, is not located anywhere near the major fires affecting the East Coast of Australia.
At present the smoke from those fires have not affected this location.
Southern Hemisphere December 2019 Background Level Report
Station location
http://sccc.org.au/monitoring/Australian-Map.jpg
This short animation of Northern and Southern Hemisphere air circulation, shows why we can get detections so far south.
December 2019 day average background chart. (Month Average 111 cpm)
This December, our summer, we saw a small increase in local background levels compared to the winter months.
Overall, the 2019 local background radiation levels were very stable, compared to other years since 3/11.
http://sccc.org.au/wp-content/uploads/2019/12/Caloundra-local-average-background-radiation-levels-December-2019.jpg
Disclaimer: This is an amateur volunteer run service. Human error can provide incorrect information, and equipment malfunction can produce false readings. Do not rely on, or take action upon information presented on this web site, without further research.
Another Simi Mom reports:
This article describes the Russian missle and nuclear warhead combination which crashed into the White Sea in northwest Russia earlier this year, releasing radiation into the sea and air and killing Russian nuclear scientists and technicians. While it’s intellectually satisfying to have the mystery of the nuclear accident and radiation release solved by a formal press release, the details of the nuclear weapon delivery system are sobering to say the least.
https://apnews.com/597e7f2b20b21af959e4c6983b255c37
On Thursday the19th of December 2019, the floating nuclear power plant Akademik Lomonossow was put into operation as the first of its kind in the Russian Far East. The facility, designed and built in Russia, symbolically illuminated the central Christmas tree in the city of Pewek, Russia. The Russian group Rosenergoatom, which operates the nuclear power plant, described the commissioning as a historic event not only for the Russian, but also for the global atomic energy industry. This is reported by RIA Novosti. Akademik Lomonossow is not only the first floating but also the northernmost nuclear power plant worldwide. According to Rosenergoatom, the thermal power plant has a high safety factor. It is equipped with two KLT-40S reactors, which are used in nuclear icebreakers. Together they can generate up to 70 MW electrical energy and 50 Gcal / h thermal energy. This is said to be able to supply electricity to a city with around 100,000 inhabitants. https://ria.ru/20191219/1562573532.html Let’s pray it stays afloat.
Potential 110 Times Regulatory Limit Exposure For Children!
Supreme Court Rejects Cell Phone Industry Challenge To Berkeley Ordinance
Extracts:
“The court agreed that our precious First Amendment guarantees that we have the right to know that cell phones emit radiation and that levels can be exceeded when phones contact the body. Astonishingly, the industry argued that compelling them to provide information about tested distances set for large adults denied their right to keep this information hidden as part of their right to free speech.
Investigations at FCC accredited labs by the Chicago Tribune, the law firm of Fegan Scott, and CBC Broadcasting, as well as tests of hundreds of phones by the French government disclosed that the Berkeley advice may well understate exposures. Some of the most popular smartphones emit up to 11 times as much radiation as permitted under outdated FCC radiation exposure guidelines when tested against the body.”
https://www.ibtimes.com/supreme-court-rejects-cell-phone-industry-challenge-berkeley-ordinance-2882980
Comment:
Extract from page two of a research article, link below:
“The use of cell phone in children is dangerous due to the closer proximity of the mobile phone to their brain compared to adults; the average RF exposure from its use is higher by a factor of 2 in a child’s brain and by a factor of 10 in the bone marrow of the skull.
Brain and bone marrow have a higher conductivity in children than in adults and receive a higher energy deposition from RF sources. With age, the bone marrow progressively incorporates more fat, and the bone itself increases in thickness, hardens, and loses water over time, thus making the tissues less vulnerable.”
The statement of 11 times the radiation exposure limit if used against the body, in the Berkeley Ordinance article, is for an adult sized body. This means the child dose equivalent above the regulatory limit would be much much greater, because their body size and head size is smaller than an adults.
Extrapolating from the information provided in the research paper, it would mean that the brains of children, using some of the most popular smartphones, would potentially be exposed to,
an equivalent of 11 X 2, or 22 times above the regulatory limit for their brains,
and
11 X 10, or 110 times greater for their skull bone marrow!
Every parent should be socked by this revelation!!
Research Article Link: (The full article can be downloaded as a PDF if you click the download PDF button, at the top left of the page, under the article heading.)
http://www.journal-ina.com/article.asp?issn=2394-2916;year=2018;volume=5;issue=1;spage=1;epage=5;aulast=El-Ham
November 28, 2019
11:45 am PST INT STOVEPIPE WELLS DEATH VALLEY NATIONAL PARK RAIN: 74.1 CPM^^^ OR 1.9 TIMES PRIOR BACKGROUND
11:30 am PST INT STOVEPIPE WELLS DEATH VALLEY NATIONAL PARK BACKGROUND: 37.6 CPM^^^
November 27, 2019
1:10 pm PST EXT FURNACE CREEK DEATH VALLEY NATIONAL PARK HEADQUARTERS PARKING LOT BACKGROUND: 34.9 CPM^^
12:55 pm PST EXT FURNACE CREEK DEATH VALLEY NATIONAL PARK HEADQUARTERS PARKING LOT RAIN: 100.8 CPM^^ OR 2.9 TIMES SUBSEQUENT BACKGROUND NEAR THE CALIFORNIA HIGHWAY PATROL’S THRESHOLD OF THREE TIMES BACKGROUND TO INITIATE HAZARDOUS MATERIALS PROTOCOLS.
This hot rain reading pales in comparison to rains we sampled and tested in situ in Death Valley in 2013 where we found rain sizzling at up to 31.5 times background as reported in Boreas Storm Packs Radioactive Punch. That said, 2.9 times background is hot indeed. According to documentation reported on by EnviroReporter.com, the California Highway Patrol considers any material or situation over 3.0 times background to be the triggering level for a hazardous materials incident.
11:30 am PST INT STOVEPIPE WELLS DEATH VALLEY NATIONAL PARK: 42.2 CPM^^^
EXT/INT SOUTHERN CALIFORNIA – Multiple multi-media radiation tests – air, precipitation, potable & non-potable water, food (See Eat Me!), flora, urban, wild lands, freeways, roads, oases, desert, mountains, coast
October 30, 2019
EXT/INT SOUTHERN CALIFORNIA – Santa Ysabel, Ramona, San Pasqual Battlefield, Vista, Agra, San Onofre, Fountain Valley, Signal Hill, Carson, Santa Monica – NO RADIATION ABOVE BACKGROUND DETECTED
October 29, 2019
EXT/INT SOUTHERN CALIFORNIA – Vallecito, Mortero Wash, Anza-Borrego State Park – NO RADIATION ABOVE BACKGROUND DETECTED
October 28, 2019
EXT/INT SOUTHERN CALIFORNIA – Oasis, Sonoran Desert badlands, Agua Caliente, Sweeney Pass, Sonoran Desert – NO RADIATION ABOVE BACKGROUND DETECTED
October 28, 2019
EXT/INT SOUTHERN CALIFORNIA – Julian, Banner, Scissors Crossing, Great Southern Overland Stage Route, Sonoran Desert – NO RADIATION ABOVE BACKGROUND DETECTED
October 27, 2019
EXT/INT SOUTHERN CALIFORNIA – Los Angeles, Industry, Pomona, Chino Hills, Alberhill, Terra Cota, Temecula, Radec, Wynola – NO RADIATION ABOVE BACKGROUND DETECTED
October 27-30-7, 2019
EXT/INT SOUTHERN CALIFORNIA – Multiple multi-media radiation tests – air, precipitation, potable & non-potable water, food (See Eat Me!), flora, urban, wild lands, freeways, roads, oases, desert, mountains, coast
Southern Hemisphere November 2019 Background Level Report
Station location
http://sccc.org.au/monitoring/Australian-Map.jpg
This short animation of Northern and Southern Hemisphere air circulation, shows why we can get detections so far south.
November 2019 day average background chart. (Month Average 110 cpm)
In the warmer months more tropical air flows to this location compared to the colder months. This November, our spring, we saw a small increase in local background levels compared to the winter months. Spring and summer up ticks in local background have become the new normal here since Fukushima. For comparison, this July’s month average was 107 CPM.
http://sccc.org.au/wp-content/uploads/2019/11/Caloundra-local-average-background-radiation-levels-November-2019.jpg
Disclaimer: This is an amateur volunteer run service. Human error can provide incorrect information, and equipment malfunction can produce false readings. Do not rely on, or take action upon information presented on this web site, without further research.
Hello,
My name is Carolyn Tyler, and I firstly want to thank you for your dedication to this issue of environmental toxins.
I lived in Northridge, six miles from the SSFL and Rocketdyne, from 1956 to 1975. I lost five members of my family to cancer, and my one remaining family member (middle sister) has survived thyroid and breast cancers, starting when she was 20 in 1971. So far, despite testing with high levels of cesium, thallium, cobalt, vanadium, and rubidium in my system, I thankfully remain cancer-free.
When I first read about the meltdown in 1959, I was stunned, but it explained the cancer in my family (grandmother, mother, father, sister, niece, and brother-in-law) , and my neighbors’ families all around me. When I received my heavy-metal toxicity tests in 2014, I discovered that I also had extremely high levels of MANGANESE in addition to the radioactive isotopes, which stymied my doctors, since this element only stays in the body through inhalation of vapor or dust during welding or mining.
Through diligent sleuthing, one immunology researcher I met at a detox clinic in Bangkok found a third source of environmental manganese poisoning–rocket testing. He asked about my lifelong severe and chronic depression, which was noted in my chart, and said that “treatment-resistant chronic and severe depression, bipolar II”, along with Parkinsonism, dementia, and a host of other neurological disorders are associated with high levels of manganese, which migrates from the lungs to the brain. He recommended 2-5 years of intense chelation therapy using EDTA and zeolite clay solution to remove the heavy metals which included lead, arsenic, mercury, as well as the radiation. I added daily infrared sauna treatments, and was down to normal levels by 2016. As the doctor suggested, I weaned myself off antidepressants and have been depression-free for almost four years. This is clear proof to me that my depression was caused by toxic chemicals from Rocketdyne, since there was no other source or opportunity for exposure.
I am hoping you can help get the word out to people who lived in the Valley during the exposure years who may be suffering neurological problems and autoimmune disorders needlessly. I don’t think anyone else has figured out that particulate fallout from spent rocket fuel causes neurological problems including depression–at least I have not found anything online suggesting this, so this is very important news.
Please feel free to write to me with comments or questions at: carolyntyler@gmail.com, and please join my Facebook group: San Fernando Valley Secrets: What You Don’t Know CAN Hurt You for updates and info on how to get help.
Sincerely, Carolyn Tyler
20th October 2019 – Russia covered up explosion of Skyfall nuclear superweapon
Extracts:
“The explosion was caused by the Skyfall experiencing a criticality accident, an uncontrolled nuclear reaction that released a burst of radiation while Russian personnel retrieved it from the seafloor,” Mr. DiNanno said in an interview with The Washington Times.
The blast was set off after the fuel in the missile reactor was no longer cooled by seawater.
In the interview, Mr. DiNanno revealed further details about the incident. As part of the cover-up, he said, Moscow cut off the data gathered by a Russian nuclear monitoring station near the blast. That information is supposed to go to the International Monitoring System, a technical group based in Vienna that operates as a unit of the Comprehensive Test-Ban-Treaty Organization.
Article:
https://www.washingtontimes.com/news/2019/oct/20/skyfall-nuclear-cruise-missile-explosion-covered-r/
Comment:
“From what I understand, the actual radiation cloud was not dangerous per se,” Mr. DiNanno said.
Here we have a reported nuclear criticality event that sent a radioactive cloud over populated areas in Russia.
“The reactor exploded Aug. 8 off the coast of the northern Russian town of Nenoska, killing seven Russians on a barge in the White Sea as they were overseeing the recovery of a sunken Skyfall.”
There was a twenty times background radioactive cloud detection at the distance of around 30k or 18 miles from Nemoska, in the Russia city of Severodvinsk at the time. This indicates that a significant amount of airborne radioactive contamination was released.
https://www.zerohedge.com/news/2019-08-10/chernobyl-style-cover-run-iodine-pills-after-isotope-power-source-explosion-russia
Logic and evidence tells us the radiation cloud was dangerous!
Beta radiation in west Los Angeles Basin air doubles in half the time of last testing period.
October 17, 2019
6:35 pm PDST INT RADIATION STATION SANTA MONICA DUST AGGREGATE FROM 3 HEPA FILTER MACHINES + VACUUM DUST/DEBRIS: 77.7 CPM^^ OR 82.4% ABOVE BACKGROUND
6:20 pm PDST INT RADIATION STATION SANTA MONICA BACKGROUND: 42.6 CPM^^
A Federal task force issued its report on 10/11/19 concerning the F.A.A.’s failure to adequately supervise Boeing and its new 737 MAX airliner. As we’ve seen so often with respect to Rocketdyne aka Santa Susana Field Lab, Boeing simply crushes its regulators.
https://www.nytimes.com/2019/10/11/business/boeing-737-max.html?action=click&module=Well&pgtype=Homepage§ion=Business
Update: Video footage from a beach near weapon testing area Nenoksa [Russia] shows helicopters, excavators and men in protection gear involved in the removing of radioactive debris from last month’s nuclear accident.
https://thebarentsobserver.com/en/security/2019/09/nuclear-cleanup-coast-white-sea
Unclear if the barges hold the damaged small-size reactor or isotope source.
https://thebarentsobserver.com/en/security/2019/10/wreak-barge-nenoksa-accident-ends-kola-radioactive-scrap-site
Southern Hemisphere September 2019 Background Level Report
Station location
http://sccc.org.au/monitoring/Australian-Map.jpg
This short animation of Northern and Southern Hemisphere air circulation, shows why we can get detections so far south.
September 2019 day average background chart. (Month Average 110 cpm)
There has been a slight increase in month average background level for September. This seasonal variation in local background levels has become a normal trend here since Fukushima. As we get more tropical air flows at this location in the warmer months, the local background increases, and then drops back down again in winter.
http://sccc.org.au/wp-content/uploads/2019/09/Caloundra-local-average-background-radiation-levels-September-2019.jpg
Disclaimer: This is an amateur volunteer run service. Human error can provide incorrect information, and equipment malfunction can produce false readings. Do not rely on, or take action upon information presented on this web site, without further research.
The “Western Governors Association” has complained to the U.S. Department of Energy about DOE employees making final plans for shipping nuclear waste across the country without getting input from each State’s employee/experts on that topic:
https://www.washingtonpost.com/national/energy-environment/western-governors-states-not-consulted-on-nuclear-waste/2019/10/04/c7150526-e6e4-11e9-b0a6-3d03721b85ef_story.html
As to any shipment across Nevada, the routes have already been closely studied by the state and that information has been ignored:
https://lasvegassun.com/news/2019/oct/06/state-official-lists-old-new-reasons-why-yucca-mou/
September 25, 2019
11:40 am PDST INT RADIATION STATION SANTA MONICA DUST AGGREGATE FROM 3 HEPA FILTER MACHINES + VACUUM DUST/DEBRIS: 65.8 CPM^^ OR 37.4% ABOVE BACKGROUND
11:30 am PDST INT RADIATION STATION SANTA MONICA BACKGROUND: 47.9 CPM^^
Throughout its 40+/- year history of involvement with the Rocketdyne property in Ventura County south of Simi Valley, the parent company of the property owner, Boeing, has been managed with a culture of arrogance and impunity which extended to the Rocketdyne property which Boeing renamed the “Santa Susana Field Lab” when it sold the rest of the Rocketdyne company to unrelated investors.
As Californians too many of us separated our ire at the owner of the Santa Susana Field Lab from our willingness to fly on Southwest Airlines, which flies an all Boeing fleet. In 2018 I flew on a brand spanking new Boeing 737 MAX 8 without any fear at all. I sat at the front of the cabin and was able to overhear a discussion between 3 Southwest Flight Attendants about the “new” internal features of the latest Boeing planes purchased by Southwest in comparison to earlier versions of the 737. Obviously those Flight Attendants had no idea there was anything wrong with the new 737 MAX 8.
After the new Boeing 737 MAX 8’s were grounded by the FAA, in comment sections at the bottom of the Washington Post’s news stories on the new 737 MAX 8, I would spot comments clearly written by airline pilots and aeronautical engineers which were emphatic in their criticism of Boeing’s senior managers. I would roll my eyes and say to myself “What they are seeing in the design and manufacturing of airliners is, in a sense, the same as what we have been seeing Boeing’s managers, officers and directors decide and do with the Santa Susana Field Lab and the “allegation” that radioactive fallout spread from the Field Lab property throughout the communities surrounding it continuing after 2000.
So far, the “national press” has not made any connection at all between alleged “regulatory capture” of the FAA by Boeing in connection with the FAA airworthiness certification process and the regulatory capture by Boeing of the California DTSC, Los Angeles Regional Water Quality Control Board (which is supposed to regulate L.A. and Ventura County property owners) and other California State agencies, as well as EPA, NASA and U.S. Dept. of Energy, all in connection with radioactive contamination on and around the Santa Susana Field Lab.
On September 18, 2019 “The New Republic” published the important report by Maureen Tkacik, linked below, about the relationship between Boeing and FAA and Boeing’s management arrogance. See:
https://newrepublic.com/article/154944/boeing-737-max-investigation-indonesia-lion-air-ethiopian-airlines-manageriaSl-revolution?utm_source=pocket-newtab
That story of Boeing’s management decision making concerning the Boeing 737 MAX 8, as described in The New Republic story, is going to seem very familiar to Californians who follow the Santa Susana Field Lab story. Well down in The New Republic story the author and editors say “Indeed most of the Boeing response to the MAX disasters involved disseminating a kind of misinformation and doubt that makes the crashes look more complex than they really are.”
Conducting a disinformation campaign concerning a big problem. No surprise there.
After the second Boeing 737 MAX 8 crash, I spent some time looking at Boeing’s Income Statements and Balance Sheets which they had filed with the U.S. Securities & Exchange Commission. Those official financial records showed that at the time of the second crash Boeing was sitting on more than $1 Billion in cash. Of course they have some sort of liability insurance as well, though I haven’t found the amounts of the policy limits or deductibles. Since I’m familiar with the shorthand thinking of air and rail disaster plaintiff’s lawyers I figured that Boeing had more than enough cash and insurance to litigate their way through two airplane crash lawsuits, the thought that Boeing might be financially endangered by the occurrence of the the two crashes didn’t cross my mind.
Then came the grounding of the 737 MAX 8 airplanes, all of them.
In some jurisdictions, but not all, when there is a lawsuit between a large corporation and the family of a human being who was killed by the corporation’s negligence, the lawyers for the plaintiffs can explore through document production demands, document production subpoenas to third parties, written questions and “demands for admissions” which the defendant company must answer, and deposition testimony of the company’s line employees and management as well as independent witnesses, about what other negligent or wrongful acts the company’s senior management has been accused of engaging in during the recent past. A lot of that wrongful acts/repeated negligence evidence is used in connection with punitive damage claims relating to a defendant corporation’s “course of conduct” over many years and analogous circumstances.
If I were Boeing’s lead lawyer, I would advise their Board of Directors to pay and settle all of the claims of the families of the dead arising out of the two 737 MAX 8 crashes NOW. I would advise Boeing’s Board of Directorss to pay and settle, RIGHT NOW, all of the money claims of domestic and foreign airlines for their money damages arising out of the “defects in the 737 MAX 8s causing them to be considered by a jury to be defective products”, leading to the U.S. and foreign governments grounding of all of the 737 MAX 8s the airlines recently purchased. Making those settlements immediately would “shut the door” to statute and judge-compelled discovery concerning the Boeing Board of Director’s and managements policies in analogous circumstances.
I would advise Boeing’s Board of Directors to make those payments and settlements RIGHT NOW, even if Boeing’s liability insurance carriers are/were/would refuse to allow the settlements under the terms of Boeing’s insurance policies. I would advise immediate settlement even if those insurance companies would “deny coverage” if the settlements were made without the insurance companies consenting to the settlements. I would advise Boeing’s Board of Directors to ay those settlement amounts to minimize Boeing shareholders’ long term risk arising out of a 19+ year course of regulatory-capture conduct by the corporation’s senior management.
Boeing’s course of conduct in dealing with California and Federal agencies regulating the Santa Susana Field Lab and in dealing with the FAA concerning the Boeing MAX 8 appear to be nearly identical. https://www.youtube.com/watch?v=ewLM0zkoXFM
If the national/world press and the plaintiffs’ lawyers examining the crashes and grounding of the “new” Boeing 737 MAX 8s focus on Boeing’s long history of regulatory captures, such as the ones involving the Santa Susana Field Lab, “Katie Bar the Door”.
Condolences to Ralph Nader for the death of his grand-niece in the crash of the new Boeing 737 MAX 8 in Ethiopia. https://www.cnbc.com/video/2019/05/23/ralph-nader-the-faa-is-a-consulting-firm-for-airlines-not-a-regulator.html and https://www.cnbc.com/2019/07/23/ralph-nader-says-boeing-737-max-should-never-fly-again.html
Southern Hemisphere August 2019 Background Level Report
Station location
http://sccc.org.au/monitoring/Australian-Map.jpg
This short animation of Northern and Southern Hemisphere air circulation, shows why we can get detections so far south.
August 2019 day average background chart. (Month Average 108 cpm)
The last few months have been relatively quiet, with relatively low background levels. This has been the historical norm for the cooler winter months here.
http://sccc.org.au/wp-content/uploads/2019/08/Caloundra-local-average-background-radiation-levels-August-2019.jpg
Disclaimer: This is an amateur volunteer run service. Human error can provide incorrect information, and equipment malfunction can produce false readings. Do not rely on, or take action upon information presented on this web site, without further research.
More news from Arctic Russia near Finland. The nuclear accident there this summer might NOT have occurred during the testing of a nuclear powered missile. It may turn out that the missile was test fired, ended up at the bottom of a bay in the White Sea, and that the scientists who died from primary exposure to radionuclides were NOT exposed during the test firing.
Instead there’s a possibility the scientists were exposed as part of efforts by the Russians to pull the test missile up from the bottom of the White Sea. That news was reported by 3 reporters from Radio Free Europe. See:
https://www.rferl.org/a/angry-villagers-beached-pontoons-irradiated-flotsam-more-clues-to-mysterious-russian-explosion/30144751.html
https://www.rferl.org/a/angry-villagers-beached-pontoons-irradiated-flotsam-more-clues-to-mysterious-russian-explosion/30144751.htm
Rachel Maddow has become interested in the stories about the nuclear accident at the White Sea. If you go on the internet and look for MSNBC’s broadcast of her show on 9/5/19 calling attention to the work of those 2 reporters you’ll find her discussion of the nuclear accident about 15 minutes into her show.
“According to three of the doctors, including both senior sources, one of the doctors flown to Moscow was found to have Caesium-137 — a radioactive isotope that is a byproduct of the nuclear fission of uranium-235 — in their muscle tissue. One of the sources said the affected doctor had told him so directly, though he was not informed about the amount or concentration of the isotope found. …….Last Friday, Aug. 9, the Baza news outlet, which has close ties to Russia’s security services, reported that men injured during the blast had been brought to a Moscow clinic for radiation sickness treatment. The outlet published a video of a convoy of police cars and ambulances travelling through the Russian capital.
According to three of the doctors, two of the three patients that were treated at the Arkhangelsk Regional Clinical Hospital didn’t even reach Moscow, dying en route to the airport. https://thebarentsobserver.com/en/security/2019/08/exclusive-russian-doctors-say-they-werent-warned-patients-were-nuclear-accident
13th August 2019 – Deadly Explosions Aside, Kremlin Says Putin’s Nuclear-Powered Missile Far Ahead Of US Technology
Quote:
“The maximum reported level of radiation would be harmless and on a par with a dental x-ray, according to Jonathan Cobb, a spokesman for the World Nuclear Association. ”
https://www.bloomberg.com/news/articles/2019-08-13/russia-says-radiation-levels-reached-16x-norm-in-aug-8-accident
Comment:
The radiation release was from a large explosion. This means that people exposed to this radioactive cloud as it passed through their area, would have breathed in radioactive contaminated dust and gases. Some of this material would also have been deposited as dust!
The external radiation dose levels reported do not represent the real health risks to the exposed populations. In a radioactive cloud event like this, the microscopic radioactive material potentially breathed in, is far more dangerous than any detected external dose level would indicate!
The 20x background detection only informs us that a significant radioactive cloud passed through. Other downwind communities would also have been exposed to this hazardous airborne radioactive material. Also, the toxic chemicals released from this type of explosion would add a significant multiplier of toxicity to this exposure.
By way of disclosure, I am 1/4 Norwegian. My great grandparents moved from Norway to Iowa in 1866. I have no relatives who are from Finland or Russia. My husband’s paternal grandparents emigrated from Brody and Sambir, in the Austrian Crown Province of Galicia (which had a Tsarist Russian eastern border) around 1905. All of the relatives who were left behind in 1905 died at the hands of the Soviets and the Third Reich. Today both of those small cities are in Western Ukraine, near the much larger formerly Austrian city of Lviv, Lwow, Lvov, Lemberg, all of them being west of Chernobyl. Neither of us, or our children are employed or politically active in any manner having to do with Russia or Ukraine. However my grandson Oleksei, age 7, does have a beautiful blond Russian girlfriend at his elementary school in Las Vegas, which has a reasonably large Russian and Ukrainian immigrant population, and from time-to-time a good Russian restaurant.
THE MOOD OF THE RUSSIAN/SOVIET PEOPLE DURING A NUCLEAR ACCIDENT
I was alive during the Chernobyl nuclear emergency. I took particular interest in the trials and tribulations of the ordinary Soviet people who lived near that nuclear power plant, or down-river heading towards Kiev. If you are interested in experiencing the mood of ordinary Soviet people in the aftermath of the accident and the meltdown, I suggest finding the novel called “Chernobyl Murders” written by Chicago based Ukrainian Michael Beres. Beres’ book is very atmospheric and moody. It tells the story of a woman scientist and her Kiev resident boyfriend as they try to avoid being herded into a displaced persons camp for the residents of Pripyat. Towards the end of the story, the Soviet law enforcement officials stop to have a good meal in a foreign cuisine at a Polish restaurant in Sambir, the same beautiful little Austrian-style city where my inlaws lived in 1904.
Also read Martin Cruz Smith’s novel “Wolves Eat Dogs” which is set in the forest surrounding Chernobyl and Pripyat many years after the nuclear accident. Cruz Smith is famous for writing “Red Square” and other succeeding books with the same character, a Soviet/Ukrainian policeman Arkady Renko, the son of a famous ethnic Ukrainian General in the Soviet Army who led a major group of Soviet forces during World War II. Cruz’s books about Ukraine and Russia are very moody and cosmic.
WHAT HAS LEAKED OUT ABOUT THE RUSSIAN GOVERNMENT’S RESPONSE TO THE EMERGENCY
As to the current status on the ground in the area around this 2019 accident site, the Russians are proceeding much like the Soviets did in the days after the Chernobyl accident. The first responders, including medical personnel, have been flown to Moscow for specialized medical treatment at one or more hospitals with medical experts on nuclear accidents. Many first responders quickly died, in Moscow, in the days after the Chernobyl accident.
The area around the nuclear accident site in 2019 has been cordoned off by Russian government officials. Russian scientists in the appropriate nuclear discipline are investigating what happened while others are trying to figure out what to do with the raw radioactive materials which have been released into the White Sea at Dvina Bay, onto the soil and trees in Karelia and into the ambient air.
Two days ago, Russian officials told the residents of the village nearest to the nuclear accident site, Nenoksa, that they were going to be evacuated “just for a few hours”. However the evacuation was cancelled a few hours later. Perhaps the village residents understand what happened to the residents of Pripyat and the villages immediately around and downstream from Chernobyl: They were told they had to evacuate “just for a few days”, but they were never allowed to return to their apartments and cottages to “get their stuff”.
USING MAPS TO UNDERSTAND WHAT IS GOING ON WHERE IN TERMS OF LOCAL HISTORY BEFORE AND AFTER THIS 2019 NUCLEAR ACCIDENT
Take a look at the map posted at the bottom of my August 14 comment on Radiation Conversation II below. I read in Al Jazeera online last night (8/14/19) that the Russians are trying to keep people and boats away from Dvina Bay which is the SOUTHERN-MOST bay which is part of the White Sea. Dvina Bay is also the southern shoreline where the White Sea – Baltic Canal begins. According to Al Jazeera the Russian government has “closed” Dvina Bay for at least a month.
Dvina Bay is the part of the White Sea where Russian nuclear scientists were conducting their experiment on a “platform” floating in the sea, a distance away from the shoreline. The explosion which killed the 7 scientists happened on the platform, which was near a little Russian village called Nenoksa on Dvina Bay’s south shore. (When I ran a search for Nenoksa through Google Maps, the program put up a map showing the village location. If you choose “satellite” while looking at Nenoksa you can see that the surrounding land is barren but not snow covered at this time of the year.)
Nenoksa is the village which the Russian government had decided to evacuate before they changed their minds. The New York times speculated that what was left of the nuclear reactor which was on that platform fell into the White Sea after the explosion, along with the Russian scientists. We can’t see the particular spot where all of them and what remained of their experiment can be said to have fallen into Dvina Bay in particular, but we know it is offshore from Nenoska.
While you’re looking at Nenoksa on Google Maps, also look for Severodvinsk, a small city with about 134,000 people. That’s where the Russian government has set up operations to deal with the consequences of the rocket explosion which occurred some time during daylight around August 8, 2019.
Al Jazeera also reported that the dead scientists had been taken to Sarov, the city where their families reside and where the main nuclear weapons research facility in Russia is located. Sarov is in the Russian region called Nizhny Novgorod Oblast, which is a long, long way away from Dvina Bay. Knowing that long distance one can conclude that the Russian scientists thought it was far too dangerous to test the missile/rocket near Sarov or other populated areas in Russia
Also take a look at the map of the area of Russia where this latest nuclear accident occurred,on the map from Wikipedia Commons in my other comment below. You’ll see Finland’s current eastern border. The vast majority of the land on the Russian side of that border, going all the way to the White Sea is called “Karelia”. It’s the same Karelia which was part of Finland in 1940, populated by so many Finns that they represented 1/3 of the Finnish economy that year.
However, in 1940 the Soviet Army invaded Karelia on the pretext that it was needed to stage Soviet troops to protect Leningrad (formerly and now St. Petersburg) from invasion by the Germans. The Finnish Army put up a good fight, using modern weapons like machine guns, trying to fight off the Soviet military. (There’s a good history of the Winter War on Wikipedia.) The Finns lost in what is now called the “Winter War” in 1941.
At that time of the Winter War, there was a dramatic exodus of Karelian Finns towards Helsinki, because they didn’t want to live under Soviet rule. After World War II the Soviets did not give Karelia back to the Finnish people and their government. While the Soviets tried to repopulate Karelia with their own people, the population of Russian Karelia is much lower today than it was in 1940, which is a good thing in terms of a large group of Finns not living smack-dab-up-against the part of the White Sea where the 2019 nuclear accident occurred. Unfortunately, in Karelia and Finland the winds often blow from the north east, meaning that the “Down Winders” from this latest nuclear accident are likely to be Finns as well as Russian residents of Karelia.
That down wind risk in 2019 is nothing new for Finns, Swedes, Norwegians, Danes and the Sami people of Lapland, all of whom have lived down wind, since the late 1940’s, from the Soviet/Russian version of the Nevada Nevada Test Site, called the Novaya Zemlya Test Site, located on the gigantic, two-island, mountainous Novaya Zemlya Archipelago, which is crescent shaped, gigantic “arc”island located in the part of the Arctic Ocean called the Barents Sea, to the north east of Norwegian and Russian Lapland, and not too far, as the wind blows, from Karelia.
The Novaya Zemlya Archipelago looks remote, almost uninhabited and cold, given its location in part of the Arctic Sea. The archipelago was first land-surveyed by Russians in 1930 and a Russian village settlement was built in the 1870’s.
The archipelago is made up of two main islands: Yuzhny Island to the south and the much larger Severny Island to the north. The seas around Novaya Zemlya were the sites of serious naval battles during World War II, far too interesting to write here. See Wikipedia for a quick summary of what happened is the sea there.
Severny Island is where the Russians’ outdoor nuclear test site is located on the west side of the island on the Sukhoy Nos Peninsula, which adjoins Mityshikha Bay, part of the Barents Sea. Unlike the treatment of the Pai people, the Navajo and the southern Utah Mormon down-winders, the Soviet government was gracious enough to move-out the local indigenous people, called the Nenets, in 1957, before the Russian outdoor nuclear tests began. By western intelligence at least 224 nuclear bomb tests occurred at the Novaya Zemlya Test Site on Severny Island. (Of those 224 nuclear bombs explosively tested, 2 were American nukes. Wouldn’t it be interesting to learn the details of that Russian-American joint experiment.)
The Novaya Zemlya Test Site is where, as part of experiments and military training, some of those 224 nuclear bombs were detonated in the open air, including the largest outdoor nuclear bomb explosion in history-to-date called the Tsar Bomba, which was exploded on October 30, 1961, nine (9) miles inland from Mityushikha Bay.
Other outdoor and underground nuclear bomb detonations and other nuclear experiments occurred throughout Severny and Yuzhny Islands through the 1990’s.
In September 1961 the Soviets shot 2 “propelled nuclear warheads” TOWARDS the Novaya Zemlya Test Site, which covers most of the two islands. Those nuclear warheads were shot from two places on the Soviet mainlands: (1) one called Salekhard (on the Russian mainland) and (2) one from a military airfield called Vorkuta Sovietsky which was located in the Komi Republic of the Soviet Union, located due south of Novaya Zemlya. It is said that after those two tests, the launch missile was moved by the Soviets to Cuba.
Interpreting the Russians’ actions in 2019, some in the nuclear industry suspect that the test missile which exploded in Dvina Bay was being tested there, rather than on Novaya Zemlya, as an attempt to obscure what the scientists from Sarov were doing. I doubt that is true.
While the Winter War of 1940-1941 caused great sorrow among Finns, at least in 2019 Finnish citizens are not living along Dvina Bay where the accidental ‘nuclear’ explosion occurred.
Ultimately it will be interesting to see if the Russians create a new Exclusion Zone in Karelia like the exclusion zones which exist around Chernobyl in modern day Ukraine encircling the former city of Pripyat, where the Chernobyl nuclear power plant and accident were located, and the exclusion zone encircling Fukushima Japan. Clearly the Finnish government and its people will be very unhappy, if the new exclusion zone extends all the way into Finland’s current sovereign territory.
If you’re the praying kind, say a prayer for protection of the health of the people of Scandinavia and Karelia.
Norway finds minor radioactive substances in air near border to Russia
https://thebarentsobserver.com/en/ecology/2019/08/norway-finds-radioactive-substances-air-near-border-russia
Seven people died at the incident Nyonoksa. “Five representatives of nuclear power company Rosatom, and two people from the Russian Armed Forces, reportedly lost their lives while working with technical support of the isotope power source in a liquid propulsion system.”
It’s tough to write a comment for Americans concerning a significant event in modern Russia without starting with a geography and history lesson. Likely 99% of Americans have no clue where Lake Ladoga is in Russia, just as 99% of Russians have no idea where Lake of the Ozarks is here. Fortunately Wikipedia Commons has published a map of the Baltic area of Russia which we are free to copy and study. It is located below.
Early in the Russian people’s history Russia was essentially landlocked, with no access to navigable seas in Winter. In 1697 Tsar Peter I toured western Europe for 18 months. Among other things, Tsar Peter realized that European sovereigns with access to the sea for a navy and commercial shipping were substantially more affluent than rulers of landlocked countries.
Until 1703 the entire U shaped eastern coast of the Gulf of Finland (on the map below) was occupied by Swedes who were call Ingrians. On May 1, 1703 Tsar Peter’s army captured control of Ingria’s most strategic places, the Swedish fortress of Nyenschantz and the City of Nyen on the Neva River. The 40,000 Swedish Ingrians had no way to physically get back to Sweden where they would have been safe in the hands of the Swedish king. As a result Tsar Peter I turned those captured Swedes into serfs and worked them to death building the grand city of St. Petersburg 3 miles in from the Gulf of Finland (Part of the Baltic Sea) under the supervision of German and Dutch engineers he hired. Tsar Peter I designated St. Petersburg as the capital of Russia.
The Baltic Sea coast City of St. Petersburg was nurtured, improved and embellished by subsequent Tsars who kept it as the Russian capital. Access to the sea, and to world trade through the Baltic Sea allowed affluent Russian businessmen to increase their wealth through world trade.
After Tsar Nicholas II was deposed in 1917, the Bolsheviks led by Vladimir Lenin took control in the October Revolution,and Lenin moved Russia’s capital back to Moscow.
Historically Russia has had seaports on its northern coast abutting the Arctic Sea. However the winter weather being what it is, during his tenure as leader of the Soviet Union prior to World War II, Joseph Stalin decided to have Soviet laborers dig and build a ship canal from the White Sea (on the map below) to the Baltic Sea. The route chosen took advantage of naturally occurring lakes and rivers, and passed near urban Leningrad before entering the Baltic Sea. That “White Sea – Baltic Canal” was completed in 1933 and Soviet ship traffic began.
According to Russian author Aleksandr Solzhenitsyn that White Sea-Baltic Canal was constructed by forced labor of 126,000 Soviet gulag prisoners thousands of whom died during the construction process. The route of that White Sea-Baltic Sea Canal is shown on the red line on the map above. The Soviet/Russian people paid a very high price to create their White Sea – Baltic Canal.
History has proven that the bad consequence of man-made canals is that they allow unstoppable movement of chemicals, marine life and plants from one body of water to another.
That’s why the Great Lakes now have lampreys, a snake shaped garbage fish from the Atlantic who swam up the St. Lawrence Seaways canals and locks, and who feed by attacking fish of economic and sporting value like lake trout.
Canals connecting formerly disconnected bodies of water, like the Great Lakes and the canals and rivers that are located in the Great Lakes states are at risk of being invaded by the huge nuisance fish called the Asian carp. The carp got into the Mississippi River and have entered a man made canal connecting the Mississippi to Lake Michigan at Chicago. A massive effort is continuously being made in Congress and on the Great Lakes to stop the Asian carp from populating the lakes and killing off traditional lake fish.
In the late 1960’s fresh water chemists conducted extensive water tests from the Niagara River, attempting to determine the kinds of industrial chemicals in that drinking water source, and those chemicals’ locations of origin. The fresh water chemists found a cornucopia of chemicals identified as having traveled from as far away as Chicago and Milwaukee’s industrial areas as a result of the “natural” flow of water.
As we know from Enviroreporter’s extensive writing on water contamination in the Pacific Ocean near California, and in its fish used as human food, radionuclides are found in the fish and in the water which can be identified as being consistent with water run-off from the melted down nuclear reactors at Fukushima, Japan which sit at the edge of the Pacific Ocean.
On August 8, 2019 news reporting started to appear in the West indicating that there had been a nuclear accident next to or on the White Sea, near Arkangel’sk, shown on the map below. Later news stories indicated that the accident was caused when a large rocket, fueled by a nuclear reactor inside it, had exploded on a barge or dock in the White Sea.
That’s where the White Sea-Baltic Canal presents a big risk to the health and safety of Russian people, if radionuclides in the water of the White Sea enter the canal and head for the lakes and rivers forming the canal leading to the Baltic Sea. On route, those hypothetical radionuclides will contaminate the lakes and rivers incorporated into that canal. Worst case, radionuclides which have traveled through that canal will enter the Baltic Sea.
Russia’s neighbors around the Baltic Sea, Finland, Sweden, Denmark, Germany, Poland, Latvia, Lithuania and Estonia will not be very happy if they discover Fukushima style reactor melt down radionuclides contaminating their beloved and economically important Baltic Sea and its fish.
On August 13th the New York Times speculated that the nuclear reactor could have fallen into the White Sea and that the Russian government may plan to try to retrieve it in no small part to protect the waters of the White Sea from nuclear contamination like the seawaters off Fukushima.
Locals are told to leave nuclear testing area Nyonoksa
They will be taken away from the settlement located near Arkhangelsk by train. The evacuation is not related to the recent missile engine explosion, military authorities say. https://thebarentsobserver.com/en/security/2019/08/locals-are-told-leave-nuclear-testing-area-nyonoksa
Below is the map location of Nyonoksa and Severodvinsk in Northern Russia. Reportedly Nyonoksa is where the Russian experiment rocket exploded. Severodvinsk, where the 20x background detection occurred, is east of Nyonoksa. This indicates that the wind direction was westerly, at the time of the explosion.
https://www.google.com.au/maps/place/Nyonoksa,+Arkhangelsk+Oblast,+Russia,+164526/@64.605536,39.256264,9.75z/data=!4m5!3m4!1s0x44187b02480aee51:0xba867af3a567f21f!8m2!3d64.622572!4d39.18022
The Russian press have played down the event, stating in one article that Finland’s monitoring system did not detect anything, thus implying that the event was insignificant.
Quote from RT Article: (https://www.rt.com/russia/466238-russian-rocket-blast-sea-rosatom/)
“The claims of a radioactive cover-up have not been supported on the ground, and neighboring Finland has not registered any deviations from normal levels.”
The detection evidence indicates that the wind was heading Westward away from Finland. A twenty times background, at the distance of around 30k or 18 miles between Nyonoksa to Severodvinsk, indicates that a significant radioactive release occurred.
With several days of delay, the Russian authorities have revealed some details of the nuclear accident that occurred at a military base on the White Sea. At least five people lost their lives, with atomic radiation of up to 2.0 microsieverts per hour. The accident occurred on a platform in the sea. Rosatom said his employees had been tasked with running the “isotopic energy source” for a rocket that was being tested on the platform Some questions remained unanswered. For example, the authorities did not clarify whether Rosatom’s confirmed five deaths by its own employees must be supplemented by two deaths from specialists who were announced by the army shortly after the disaster. In addition, there were varying levels of atomic radiation levels – leading to panic buying of iodine tablets in the affected region. While normal background is around 0.11 µSv/h (microsivert per hour), the levels measured at the monitor on the Lomonosov Street near Lake Teatralnoye peaked at 2 µSv/h, nearly 20 times higher gamma radiation than normal.
Southern Hemisphere July 2019 Background Level Report
Station location
http://sccc.org.au/monitoring/Australian-Map.jpg
This short animation of Northern and Southern Hemisphere air circulation, shows why we can get detections so far south.
July 2019 day average background chart. (Month Average 107 cpm)
July background was slightly lower than June.
http://sccc.org.au/wp-content/uploads/2019/07/Caloundra-local-average-background-radiation-levels-July-2019.jpg
Disclaimer: This is an amateur volunteer run service. Human error can provide incorrect information, and equipment malfunction can produce false readings. Do not rely on, or take action upon information presented on this web site, without further research.
In a disaster on a military site in northern Russia apparently radioactivity was released. Seven people died. The information is sparse.
Below is a link to a National Academy of Sciences published article on a significant leak of Ruthenium 106 into the environment in September 2017 “from” the multi-purpose Russian nuclear site called “Mayak” which is located in the countryside outside of the City of Ozyorsk, Oblast (State) of Chelyabinsk, Russia.
Where is Ozyorsk Russia? It is just 150 km south southeast of the City of Ekaterinburg, where the last Tsar and his family were executed at Ipatiev House in July 1918.
Ozyorsk and Ekaterinburg are far east of Moscow in the Ural mountain region, and due north of Kazakstan.
A cloud of Ruthenium 106 is said to have been released at Mayak in September 2017. In the Soviet era, Mayak was also the site of a major nuclear accident called the “Kyshtym Disaster” in 1957.
The cloud which traveled to Europe in 2017 was made up of Ruthenium 106, a byproduct of nuclear fission with a half-life of 374 days. During the “reprocessing” of “spent” nuclear fuel, the isotopes of Ruthenium 106 usually are separated from the radioactive plutonium and uranium taken from nuclear power reactors and kept in long-term storage with other radioactive waste byproducts.
https://www.pnas.org/content/early/2019/07/25/1907571116
https://www.newsweek.com/secret-russian-nuclear-accident-caused-huge-radiation-cloud-blanket-europe-scientists-claim-1451691
July 29, 2019
4:15 pm PDST INT RADIATION STATION SANTA MONICA DUST AGGREGATE FROM 3 HEPA FILTER MACHINES: 69.8 CPM^^ OR 78.5% ABOVE BACKGROUND
4:15 pm PDST INT RADIATION STATION SANTA MONICA BACKGROUND: 39.1 CPM^^
July 2-3: LAX to O’Hare to Kalamazoo Airport, Michigan- Food + Environment test normal for radiation
July 4: Kalamazoo-area home and vicinity- Food + Environment test normal for radiation
July 5-6: Grand Haven, Michigan- Food + Environment test normal for radiation
July 7-10: Mears, Michigan – Food + Environment test normal for radiation
July 10-13: St. Ignace, Michigan (Upper Peninsula including Sault Ste. Marie, Michigan and Sault Ste. Marie, Canada) – Food + Environment test normal for radiation
July 13-16: Traverse City, Michigan – Food + Environment test normal for radiation
July 16-20: Southwest Michigan home and vicinity – Food + Environment test normal for radiation
July 20: Kalamazoo Airport to O’Hare to LAX – Food + Environment test normal for radiation
In Majak’s Russian nuclear facility in the southern Urals, a serious nuclear accident was believed to have occurred in September 2017, according to an international team of experts from 47 leading institutes. This reports the “Frankfurter Allgemeine Sonntagszeitung”. She refers to a report published by 69 scientists under the leadership of radio-ecologist Georg Steinhauser from the University of Hanover and French atmospheric researcher Olivier Masson in the American journal Proceedings of the National Academy of Science (PNAS). PNAS is one of the world’s leading science journals.
The accident, to which the researchers now allude, had led to a sudden appearance of the radioactive isotope ruthenium-106 in the atmosphere in large parts of Central and Eastern Europe.
Southern Hemisphere June 2019 Background Level Report
Station location
http://sccc.org.au/monitoring/Australian-Map.jpg
This short animation of Northern and Southern Hemisphere air circulation, shows why we can get detections so far south.
June 2019 day average background chart. (Month Average 108 cpm)
Local background levels have been relatively calm over the last few months, nothing significant to report.
http://sccc.org.au/wp-content/uploads/2019/06/Caloundra-local-average-background-radiation-levels-June-2019.jpg
Disclaimer: This is an amateur volunteer run service. Human error can provide incorrect information, and equipment malfunction can produce false readings. Do not rely on, or take action upon information presented on this web site, without further research.
Community event will call for the promised full cleanup of the Santa Susana Field Laboratory and include a memorial in honor of workers and community members harmed by exposure to the site’s contamination
On Saturday, July 13, community members who live near the Santa Susana Field Laboratory (SSFL) will hold an event to commemorate the 60th anniversary of the site’s partial nuclear meltdown and to rally in support of its long overdue cleanup. The event will take place from 10 a.m. – 12 p.m. at Rancho Tapo Community Park, 3700 Avenida Simi, Simi Valley, CA at the pavilions near the ballpark.
SSFL is a former nuclear reactor and rocket-engine testing facility located in the hills above the Simi and San Fernando Valleys. On July 13, 1959, power began to rise rapidly in the core of the Sodium Reactor Experiment (SRE). Operators barely managed to shut it down, but a few hours later, without determining the cause of the incident, inexplicably started it up again and let it run for 10 more days. By the time the SRE was finally shut down, a third of its fuel had experienced melting. Because it had no containment structure, radioactivity was released directly into the environment.
The SSFL meltdown was kept secret for two decades, until it was discovered by UCLA students and their instructor, Dan Hirsch, who brought it to public attention. Hirsch, now retired director of the Program on Environmental and Nuclear Policy at UC Santa Cruz and President of the nuclear policy organization Committee to Bridge the Gap, said a lack of candor and disregard for public safety has characterized much of the site’s operations.
“The Atomic Energy Commission issued a news release weeks after the accident merely saying that a ‘parted fuel element’ had been observed,” said Hirsch. “They didn’t admit that 13 out of 43 fuel rods melted, or that they’d intentionally vented radioactivity into the air for weeks. This kind of reckless continued for decades, with little concern for workers and nearby communities. Such disregard continues to this day, with the contamination still not cleaned up.”
SSFL remains contaminated with dangerous radionuclides including strontium-90, cesium-137, plutonium-239 and toxic chemicals such as trichloroethylene (TCE), perchlorate, dioxins and heavy metals. Federally-funded studies indicate increased cancers among site workers, elevated cancer rates in the nearby community associated with proximity to SSFL, and that contamination migrates off of the site over EPA levels of concern.
“Exposure to contaminants that are known to exist at SSFL can cause cancers and leukemias as well as developmental, genetic, neurological, and immune system disorders,” said Dr. Robert Dodge, President of Physicians for Social Responsibility-Los Angeles, a public health advocacy group that has worked for a full SSFL cleanup for over 30 years.
In 2010, the California Dept. of Toxic Substances Control signed agreements with the U.S. Dept. of Energy and NASA to fully clean up their parts of SSFL by 2017. The Boeing Company, which owns most of the site, is similarly bound by a 2007 Consent Order to have completed cleanup by 2017. However, the promised SSFL cleanup has not even begun, and the parties responsible for the contamination are now pushing to leave about 98% of the contamination not cleaned up.
“Since when do polluters get to decide how much of their mess they clean up?” said Marie Mason, Simi Valley resident and co-founder of the Rocketdyne Cleanup Coalition, which has been fighting for full cleanup since 1989. “They don’t, it’s illegal. But the SSFL cleanup has been one broken promise after another, and all the while contamination comes off that hill and into our neighborhoods. Just last fall, the Woolsey Fire started at and burned most of the site, risking increased exposures to SSFL’s pollution. It’s got to get cleaned up.”
Newer activists like Melissa Bumstead, a West Hills resident whose daughter has twice survived a rare leukemia and who has mapped over 50 other rare pediatric cancers near SSFL, are bringing fresh energy and new voices into the cleanup fight. Bumstead’s Change.org petition has now been signed by over 650,000 people and she is hoping the July 13 event will help galvanize the community to fight for the full, promised cleanup.
“As we look back at the meltdown anniversary, we also have to look forward and get more people involved in fighting for the cleanup. Rock the Cleanup will be a family friendly event, with informative speakers, games, and fun activities like rock-painting, We’ll use those rocks to create memorials to those harmed by SSFL. We have seen some positive steps from our elected officials recently, but more – many more – people have to speak out if we are ever going to get the 100% cleaned up that we were promised.”
Photos and B-roll related to meltdown can be downloaded at http://committeetobridgethegap.org/ssfl/sre-meltdown-anniversary/
# # #
Parents vs. SSFL is a grassroots group of concerned parents and residents who demand compliance with cleanup agreements signed in 2010 that require a full cleanup of all radioactive and chemical contamination at the Santa Susana Field Laboratory.
The Rocketdyne Cleanup Coalition, or RCC, is a community-based alliance dedicated to the cleanup of the Santa Susana Field Laboratory (SSFL), commonly known as Rocketdyne.
Physicians for Social Responsibility-Los Angeles (PSR-LA) works to protect public health from nuclear and environmental threats and has worked for the full cleanup of SSFL for over 30 years.
The Committee to Bridge the Gap is a non-profit nuclear policy organization focusing on issues of nuclear safety, waste disposal, proliferation, and disarmament.
Denise, many congratulations on being awarded the prestigious “Bill Mitchell Grassroots Activist Award” from the Alliance for Nuclear Accountability.
Well deserved!
Our superb editor and website maven, Denise Duffield, is an amazing person who really rocks the house, this time in Washington D.C. lobbying for the full – and promised – cleanup of the Santa Susana Field Laboratory and spearheading the Back from the Brink campaign to abolish nuclear weapons in all its many facets. Adding to her many accomplishments is her being awarded the prestigious Bill Mitchell Grassroots Activist Award from the Alliance for Nuclear Accountability for her superb work, past present and future! Here’s to the best editor (and wife for that matter) this journalist will ever have!
Southern Hemisphere May 2019 Background Level Report
Station location
http://sccc.org.au/monitoring/Australian-Map.jpg
This short animation of Northern and Southern Hemisphere air circulation, shows why we can get detections so far south.
May 2019 day average background chart. (Month Average 108 cpm)
http://sccc.org.au/wp-content/uploads/2019/05/Caloundra-local-average-background-radiation-levels-May-2019.jpg
Disclaimer: This is an amateur volunteer run service. Human error can provide incorrect information, and equipment malfunction can produce false readings. Do not rely on, or take action upon information presented on this web site, without further research.
May 24, 2019
7:45 pm PDST INT Radiation Station Santa Monica California BACKGROUND- 38.4 CPM^
7:30 pm PDST INT Radiation Station Santa Monica California – RSSMC dust from 3 HEPA filters: 66.5 CPM^ which is 73.2% above subsequent background
May 22, 2019
3:05 pm PDST INT Radiation Station Santa Monica California THUNDER LIGHTNING THEN RAIN– 62.0 CPM^ OR 35.4% ABOVE BACKGROUND
2:50 pm PDST INT Radiation Station Santa Monica California BACKGROUND – 45.8 CPM^
RAIN ACROSS SOUTHERN CALIFORNIA AT BACKGROUND
May 18, 2019
10:30 pm PDST INT Radiation Station Santa Monica California RAIN- 40.6 CPM^ below background
9:30 pm PDST INT Radiation Station Santa Monica California – 42.7 CPM^
Southern Hemisphere April 2019 Background Level Report
Station location
http://sccc.org.au/monitoring/Australian-Map.jpg
This short animation of Northern and Southern Hemisphere air circulation, shows why we can get detections so far south.
April 2019 Report. (Month Average 108 cpm)
As we move into the cooler months here in the Southern hemisphere, the month average background levels decrease. This seasonal variation in background happens every year as we get more southern ocean air flows in the cooler months. In the warmer months we get more tropical air flows.
April 2019 day average background chart.
http://sccc.org.au/wp-content/uploads/2019/04/Caloundra-local-average-background-radiation-levels-April-2019.jpg
Disclaimer: This is an amateur volunteer run service. Human error can provide incorrect information, and equipment malfunction can produce false readings. Do not rely on, or take action upon information presented on this web site, without further research.
April 29, 2019
12:30 am PDST INT Radiation Station Santa Monica California RAIN- 41.5 CPM^ below background
12:20 am PDST INT Radiation Station Santa Monica California – 45.2 CPM^
April 13, 2019
7:15 pm PDST INT Radiation Station Santa Monica California BACKGROUND- 41.0 CPM^
7:00 pm PDST INT Radiation Station Santa Monica California – RSSMC Spring Cleaning dust from 3 HEPA filters and vacuumed in-structure dust and fine particulate matter: 56.1 CPM^ which is 36.8% above subsequent background
April 4-7, 2019
EXT/INT SOUTHERN CALIFORNIA – Multiple multi-media radiation tests – air, precipitation, potable & non-potable water, food (See Eat Me!), flora, urban, wild lands, freeways, roads, oases, desert, mountains, coast
April 7, 2019
EXT/INT SOUTHERN CALIFORNIA – Santa Ysabel, Ramona, San Pasqual Battlefield, Vista, Agra, San Onofre, Fountain Valley, Signal Hill, Carson, Santa Monica – NO RADIATION ABOVE BACKGROUND DETECTED
April 6, 2019
EXT/INT SOUTHERN CALIFORNIA – Vallecito, Mortero Wash, Anza-Borrego State Park – NO RADIATION ABOVE BACKGROUND DETECTED
April 5, 2019
EXT/INT SOUTHERN CALIFORNIA – Oasis, Sonoran Desert badlands, Agua Caliente, Sweeney Pass, Sonoran Desert – NO RADIATION ABOVE BACKGROUND DETECTED
April 5, 2019
EXT/INT SOUTHERN CALIFORNIA – Julian, Banner, Scissors Crossing, Great Southern Overland Stage Route, Sonoran Desert – NO RADIATION ABOVE BACKGROUND DETECTED
April 4, 2019
EXT/INT SOUTHERN CALIFORNIA – Los Angeles, Industry, Pomona, Chino Hills, Alberhill, Terra Cota, Temecula, Radec, Wynola – NO RADIATION ABOVE BACKGROUND DETECTED
April 4-7, 2019
EXT/INT SOUTHERN CALIFORNIA – Multiple multi-media radiation tests – air, precipitation, potable & non-potable water, food (See Eat Me!), flora, urban, wild lands, freeways, roads, oases, desert, mountains, coast
Southern Hemisphere February & March 2019 Background Radiation Level Report
Station location
http://sccc.org.au/monitoring/Australian-Map.jpg
This short animation of Northern and Southern Hemisphere air circulation, shows why we can get detections so far south.
March 2019 Report.
We finally received around 300mm of rain in March, decent rain after an exceptionally dry period.
Towards the latter part of March, around when the rain started, a number of very short detection spikes showed up in the 24 hour charts.
Below are examples of a couple of the larger spike detections.
It is normal to occasionally get background spikes, three times background or less. These detections were less than three times background, so are probably not anything to be concerned about.
http://sccc.org.au/wp-content/uploads/2019/03/Caloundra-24-hour-chart-180319.jpg
http://sccc.org.au/wp-content/uploads/2019/04/Caloundra-24-hour-chart-310319.jpg
March 2019 day average background chart.
http://sccc.org.au/wp-content/uploads/2019/03/Caloundra-local-average-background-radiation-levels-March-2019.jpg
February 2019 Report.
February was exceptionally dry. February is usually one of our wettest months here.
February 2019 day average background chart.
http://sccc.org.au/wp-content/uploads/2019/02/Caloundra-local-average-background-radiation-levels-February-2019.jpg
Disclaimer: This is an amateur volunteer run service. Human error can provide incorrect information, and equipment malfunction can produce false readings. Do not rely on, or take action upon information presented on this web site, without further research.
A noteworthy KCRW news feature by veteran Jenny Hamet has hit the airwaves and online. “Families affected by cancer want state officials to lead cleanup of Santa Susana” has heartbreaking interviews and provides an excellent introduction to the sordid environmental history of the Santa Susana Field Laboratory. Boeing, NASA and the Dept. of Energy all declined taped interviews but issued grandiose statements despite estimates that they will leave 98% of the radioactive and chemical contamination at the future “Glow in the Dark Park.” SSFL cleanup activists are a fearless and inspiring lot in this most capable multimedia piece.
March 20, 2019, 2019
9:55 am INT Radiation Station Santa Monica California RAIN SAMPLE: 46.7 CPM^^ OR 16.2% ABOVE NORMAL BACKGROUND RADIATION
9:40 am INT Radiation Station Santa Monica California BG: 40.2 CPM^^
March 5, 2019, 2019
10:50 pm INT Radiation Station Santa Monica California RAIN SAMPLE: 43.0 CPM^^ OR NORMAL BACKGROUND
10:35 pm INT Radiation Station Santa Monica California BG: 45.3 CPM^^
February 23, 2019
09:30 pm INT RSSMC PACIFIC OCEAN/SANTA MONICA BEACH SAMPLE: 41.2 CPM^^ OR NORMAL BACKGROUND
09:15 pm INT RSSMC BG: 40.0 CPM^^
February 14, 2019 walking gamma inspections of rain in Santa Monica yield no radiation over background.
February 13, 2019
01:15 pm INT RSSMC RAIN SAMPLE: 38.0 CPM^^ OR NORMAL BACKGROUND
01:00 pm INT RSSMC BG: 42.9 CPM^^
February 10, 2019
01:50 pm INT RSSMC RAIN SAMPLE: 47.5 CPM^^ OR NORMAL BACKGROUND
12:55 pm INT RSSMC BG: 50.0 CPM^^
Southern Hemisphere January 2019 Background Level Report
Station location
http://sccc.org.au/monitoring/Australian-Map.jpg
This short animation of Northern and Southern Hemisphere air circulation, shows why we can get detections so far south.
Note: As of 2019, day local background average will now be charted in Counts Per Minute (CPM), not uSv/hr. The new monitoring equipment now being used is a SBT-10 pancake probe, it generally averages 110 CPM. This is around ten times greater CPM sensitivity than the old GammaScout Geiger counter that was previously used for background monitoring here.
January 2019 Report.
It was a hot, dry, and sometimes humid January here. We generally get significant rain in January, and January is usually the start of our wet season. This January ended up being the driest on record, with an insignificant 0.4mm of rainfall. There are no radiation events to report, all calm and stable.
January 2019 day average background chart.
http://sccc.org.au/wp-content/uploads/2019/01/Caloundra-local-average-background-radiation-levels-January-2019.jpg
Disclaimer: This is an amateur volunteer run service. Human error can provide incorrect information, and equipment malfunction can produce false readings. Do not rely on, or take action upon information presented on this web site, without further research.
February 3, 2019
11:50 am INT RSSMC RAIN SAMPLE: 44.0 CPM^^ OR NORMAL BACKGROUND
11:35 am INT RSSMC BG: 42.1 CPM^^
February 2, 2019
12:35 am INT RSSMC RAIN SAMPLE: 40.4 CPM^^ OR NORMAL BACKGROUND
12:20 am INT RSSMC BG: 39.3 CPM^^
January 31, 2019
12:10 pm INT RSSMC RAIN SAMPLE: 54.7 CPM^^ OR 34.1% ABOVE BACKGROUND
11:50 am INT RSSMC BG: 40.8 CPM^^
15th January 2019 – “Nuclear: Dangerous, A Failed Technology” – Former Nuke Regulatory Chief Greg Jaczko Goes Rogue
Extracts:
Greg Jaczko, the former Chair of the Nuclear Regulatory Commission, has published an explosive new book: Confessions of a Rogue Nuclear Regulator. In it, he gets honest with the American people about the dangers of nuclear technology, which he labels “failed,” “dangerous,” “not reliable.” He particularly comes down against nuclear as having any part in mitigating the problems of climate change/global warming.
In this extended Nuclear Hotseat interview, Jaczko brings us inside the NRC’s response to Fukushima, the “precipice” on which nuclear safety balances, his own growing doubts about how safe nuclear reactors are in the United States, and how, ultimately, it was that concern with safety that probably brought him down.
Comment:
I can not see how anyone could call multiple nuclear meltdowns and explosions at Fukushima, a controlled cold shutdown of the nuclear reactors. Another fairy tale put forward by the nuclear industry to make it appear to the public that they have the situation under control at Fukushima.
http://nuclearhotseat.com/2019/01/16/rogue-nuclear-regulator-jaczko/
MEDIA WITHHOLDS VITAL INFORMATION!
The nuclear industry is spreading a fairy tale on the Internet and in main stream media, that no one has died from, or contracted cancer, as a result of Fukushima.
Below is a quote from a recently published Forbes article on the 22nd January 2019. (https://www.forbes.com/sites/michaelshellenberger/2019/01/22/former-u-s-nuclear-safety-regulator-withheld-vital-aid-during-fukushima-crisis-says-top-official/amp/)
Quote:
“There were 2,202 disaster-related deaths in Fukushima, according to the government’s Reconstruction Agency, from evacuation stress, interruption to medical care and suicide; so far, there has not been a single case of cancer linked to radiation from the plant.
That is prompting a shocking reassessment among some scholars: that the evacuation was an error. The human cost would have been far smaller had people stayed where they were, they argue.”
————————————————
FACT, a huge number of thyroid cancers, injuries and fatalities have resulted from the Fukushima nuclear catastrophe. Here we have a large list of reports from independent sources that do not have a financial interest in nuclear. These reports tell the true story, not an industry created fairy tale!
http://technologypals.com.au/fatalities-and-injuries-resulting-from-the-fukushima-nuclear-catastrophe
Please use the technologypals reports to educate your friends and relatives.
Defying explanation, EnviroReporter.com detected hot snow in Southwest Michigan at 5.7 times natural radiation background over the holidays that wasn’t from radon progeny, the likely ‘burps’ of periodic nuclear power plant gas releases or radioactive remnants from coal-fired plants on Lake Michigan. This extremely high reading, the highest taken in any media since EnviroReporter.com began measuring Midwest radiation in 2010, would seem to come from an extremely short-lived isotope we can’t identify with a half-life of about 84 minutes. This head-scratcher leaves us little to impart to our readers other than to say it is unlikely anyone made snow cones out of this hot frozen precip so there seems little to worry about from a public health perspective.
January 2, 2019
5:00 pm EST Southwest Michigan 1st floor room SNOW: 91.9 CPM^ or 143% OVER BACKGROUND
4:45 pm EST Southwest Michigan 1st floor room background: 37.9 CPM^
December 31, 2018

11:25 am EST Southwest Michigan 1st floor room RAIN: 61.7 CPM^ or 70.9% OVER BACKGROUND
11:10 am EST Southwest Michigan 1st floor room background: 36.1 CPM^
December 29, 2018
9:50 pm EST Southwest Michigan 1st floor room FRESH SNOW FROM SECOND SNOW OF DAY/NIGHT: 67.9 CPM^ or 76.8% ABOVE BACKGROUND
9:20 pm EST Southwest Michigan 1st floor room background: 38.4 CPM^
10:30 am EST Southwest Michigan 1st floor room NEW & OLD SNOW: 37.4 CPM^ or background
9:50 am EST Southwest Michigan 1st floor room NEW SNOW: 33.7 CPM^ or background
9:35 am EST Southwest Michigan 1st floor room background: 32.8 CPM^
December 28, 2018
7:40 pm EST Southwest Michigan 1st floor room SNOW: 211.4 CPM^ or 5.67 TIMES BACKGROUND, NEARLY DOUBLE THE CALIFORNIA HIGHWAY PATROL’S THRESH HOLD OF THREE TIMES BACKGROUND TO INITIATE HAZARDOUS MATERIALS PROTOCOLS.
7:25 pm EST Southwest Michigan 1st floor room background: 37.3 CPM^
5:35 pm EST Southwest Michigan 1st floor room SLEET: 70.9 CPM^ or 92.1% OVER BACKGROUND
5:30 pm EST Southwest Michigan 1st floor room background: 36.9 CPM^
12:30 pm EST Southwest Michigan 1st floor room background: 37.6 CPM^
December 27, 2018
6:15 pm EST Southwest Michigan 1st floor room RAIN: 40.6 CPM^ or background
6:00 pm EST Southwest Michigan 1st floor room background: 39.0 CPM^
December 26, 2018
4:20 pm EST St. Joseph Michigan 6th floor room background: 32,8 CPM^
11:05 am EST St. Joseph Michigan 6th floor room background: 34.1 CPM^
December 25, 2018
11:35 pm EST St. Joseph Michigan 6th floor room background: 31.6 CPM^
Southern Hemisphere December 2018 Background Level Report
Station location
http://sccc.org.au/monitoring/Australian-Map.jpg
This short animation of Northern and Southern Hemisphere air circulation, shows why we can get detections so far south.
December 2018 day average background chart.
http://sccc.org.au/wp-content/uploads/2018/12/Caloundra-local-average-background-radiation-levels-December-2018.jpg
More short duration background radiation spikes were detected here in December. The evidence below points to a couple of possible sources.
A. Cosmic ray burst?
At times during some of these detections the planetary Kp index levels were at near zero, or at zero levels. This means at these times there were very low solar wind levels and potentially high cosmic ray activity, pointing to a possible cosmic ray source.
http://sccc.org.au/wp-content/uploads/2018/12/Planetary-K-index-14th-to-16th-Decemebr-2018.png
B. Hot particle passing by the sensor or noble gases that were undergoing decay?
The wind maps below show that during each detection the surface wind was coming off the Pacific Ocean. In each instance, upper atmosphere high pressure system air was being draw down into the low pressure systems. This points to upper atmosphere radioactive contamination, possibly being drawn down to the surface.
2nd December
Originally suggested that this December 2nd spike was from a local fire event, the most recent evidence points to other possibilities.
http://sccc.org.au/wp-content/uploads/2018/12/Caloundra-1st-to-2nd-Dec-chart-011218.jpg
Wind direction at the time. (This location on these wind maps is marked by the green dot.)
https://earth.nullschool.net/#2018/12/02/0100Z/wind/surface/level/orthographic=-215.71,-23.47,1343/loc=153.174,-26.901
14th December
http://sccc.org.au/wp-content/uploads/2018/12/Caloundra-24-hour-chart-141218.jpg
Wind direction at the time.
https://earth.nullschool.net/#2018/12/14/2100Z/wind/surface/level/orthographic=-215.71,-23.47,1343/loc=153.174,-26.901
16th December
http://sccc.org.au/wp-content/uploads/2018/12/Caloundra-24-hour-chart-161218.jpg
Wind direction at the time.
https://earth.nullschool.net/#2018/12/16/1700Z/wind/surface/level/orthographic=-215.71,-23.47,1343/loc=153.174,-26.901
Disclaimer: This is an amateur volunteer run service. Human error can provide incorrect information, and equipment malfunction can produce false readings. Do not rely on, or take action upon information presented on this web site, without further research.
January 7, 2019
4:55 pm INT RSSMC HEPA FILTER DUST FROM 3 MACHINES FOR 18 DAYS: 165.4 CPM^^ OR 4.39 TIMES BACKGROUND. Over 6 times higher on per day average than previous HEPA dust measuring period.
4:20 pm INT RSSMC BG: 37.7 CPM^^
January 5, 2019
7:35 pm INT RSSMC RAIN SAMPLE: 46.1 CPM^^ OR BACKGROUND
7:15 pm INT RSSMC BG: 43.8 CPM^^
Southern Hemisphere November 2018 Background Level Report
Station location
http://sccc.org.au/monitoring/Australian-Map.jpg
This short animation of Northern and Southern Hemisphere air circulation, shows why we can get detections so far south.
November 2018 day average background chart. Caloundra November 2018 month average, 16% above pre-Fukushima average.
http://sccc.org.au/wp-content/uploads/2018/11/Caloundra-local-average-background-radiation-levels-November-2018.jpg
Until the unit here became unreliable in mid September 2018, the GammaScout Geiger make of Geiger counter was used for local background monitoring. It was replaced with a different make and model of detection equipment, with different tube sensitivities.
Spike in Background
The chart screen shot below is from the Caloundra Australia monitoring station, from the 1st December to the 2nd December 2018.
This significant spike in background radiation level occurred just after midnight on the 2nd December.
Note: The chart vertical axis is in nSv/hr, so divide by 1,000 to get uSv/hr. The peak is close to 0.375 uSv/hr, Which is around three times the average background for this location.
http://sccc.org.au/wp-content/uploads/2018/12/Caloundra-1st-to-2nd-Dec-chart-011218.jpg
There were major fires burning North of here at the time. This Nullschool wind map below shows the wind direction and particulate overlay at the time. The green dot on the map marks the approximate location of the detection.
Here are three possibilities that have been put forward for the source of this local spike in background.
A. Fire North of here.
B. Cosmic ray burst.
C. Hot particle passing by the sensor.
https://earth.nullschool.net/#2018/12/02/0000Z/particulates/surface/level/overlay=pm10/orthographic=-206.51,-26.01,1821/loc=153.152,-26.814
Monthly and yearly average charts from 2007 to 2018.
http://sccc.org.au/yearly-average-background-radiation-levels
Disclaimer: This is an amateur volunteer run service. Human error can provide incorrect information, and equipment malfunction can produce false readings. Do not rely on, or take action upon information presented on this web site, without further research.
Continued appreciation for the ongoing reporting.
I have exited the foothills of central California. Hopefully for cleaner air. I felt I had to exit as my friends all seemed to be getting ill from a lot of various stuff, like Valley Fever. Weakened immune systems is my guess.
The problem as I see it is that you can run but you can’t hide from the insidious spread of radioactive contamination and it’s potential damage to future generations of all living things.
December 5, 2018
6:55 pm INT RSSMC RAIN SAMPLE: 47.7 CPM^^ OR BACKGROUND
6:35 pm INT RSSMC HEPA FILTER DUST FROM 2 MACHINES FOR 26 DAYS: 75.5 CPM^^ OR 77.2% ABOVE BACKGROUND
6:05 pm INT RSSMC BG: 42.6 CPM^^
MORE RADIATION MULTI-MEDIA READINGS AT Radiation Station Stats & Special Radiation Station Tests. Comprehensive food and beverage testing at Eat Me!
The November 2018 Rocketdyne fire burned through Ahmanson Ranch as reported in Smoke Screen – Woolsey Fire Contamination Cover-up. SgtPepprz produced the video Upper Las Virgenes Canyon and Open Space Preserve showing Ahmanson Ranch before and after the fire. The ecosystem survived the fire and will thrive evermore, saved from rapacious development and 3,050 homes that were never built thanks to the investigative reporting of Michael Collins.
The living laboratory that is Death Valley has provided EnviroReporter.com a great place to test for radiation and this Thanksgiving holiday was no different. All air, water and food readings, documented here and in Eat Me! came in normal. That’s not always the case. Radioactive rains in the national park were staggeringly hot in 2013 as we exposed in Boreas Storm Packs Radioactive Punch:
The rare sustained precipitation tested over 31.5 times normal background radiation levels outside of the park’s visitor’s center in Furnace Creek November 23. Earlier in the day, rain radiation in Stovepipe Wells 24 miles northwest of Furnace Creek registered 29.7 times background. Boreas rain tested November 22 at the same Stovepipe Wells location in the morning came in at 4.6 times normal. Over 40 miles to the south that same day, the rain came in over 26.7 times the background of the area which is at 282 feet below sea level and called, appropriately enough, Badwater.
Luckily, the temperate 2018 radiation readings didn’t dampen the excitement of being in the hottest place on Earth.
November 25, 2018
10:05 am INT DEATH VALLEY STOVEPIPE WELLS [14′ above sea level] BG: 34.4 CPM^^
November 24, 2018
10:15 am INT DEATH VALLEY STOVEPIPE WELLS [14′ above sea level] BG: 36.6 CPM^^
November 23, 2018
11:30 am INT DEATH VALLEY STOVEPIPE WELLS [14′ above sea level] BG: 41.3 CPM^^
November 22, 2018
11:15 am INT DEATH VALLEY STOVEPIPE WELLS [14′ above sea level] BG: 39.8 CPM^^
November 21, 2018
11:40 am INT DEATH VALLEY STOVEPIPE WELLS [14′ above sea level] BG: 36.2 CPM^^
Southern Hemisphere October 2018 Background Level Report
Station location
http://sccc.org.au/monitoring/Australian-Map.jpg
This short animation of Northern and Southern Hemisphere air circulation, shows why we can get detections so far south.
October 2018 day average background chart,
http://sccc.org.au/wp-content/uploads/2018/10/Caloundra-local-average-background-radiation-levels-October-2018.jpg
Caloundra October month average, year comparisons.
2018 13% above pre-Fukushima average
2017 32% above pre-Fukushima average
2016 22% above pre-Fukushima average
2015 12% above pre-Fukushima average
2014 14% above pre-Fukushima average
2013 25% above pre-Fukushima average
2012 19% above pre-Fukushima average
Monthly and yearly average charts from 2007 to 2018.
Disclaimer: This is an amateur volunteer run service. Human error can provide incorrect information, and equipment malfunction can produce false readings. Do not rely on, or take action upon information presented on this web site, without further research.
“The state agency says it will check out the air monitoring equipment around the defunct lab as soon as fire department officials allow access.”
I was there at 3:30PM Friday. The Fire department was not blocking access to anyone.
Then the claim we updated to state that over the weekend that the samples came back clean.
Let me get this right with you all. If the samples came up bad it was already too late. The fire had already burned to the coast and exposed everyone. Yet, many people returned to clean up the ash and mess shortly after.
So, if there was an issue, it would not of been prevented and if it was hidden exposure risk was actually increased.
Perhaps all those people with the money that were affected will care now?
1. Are you suggesting that if you can no longer smell it, then the possible toxic particles are no longer in the air?
2. If I hose down everything outside my house, that water still goes somewhere. So if I hose off the swingset for the kids, all of the water and possible toxic particles ends up in the dirt. What do you do about that? OR if I hose off a side of the house, all of those potentially toxic particles ends up in my driveway, etc. etc.
3. Are you suggesting that if I grow fruits/vegetables outside then I can simply wash it with warm warm to be safe? I was planning to never eat another lemon, orange, etc. from my trees. Am I being too cautious?
4. Who would I even contact to do testing on my property to check for all of the possible toxic contaminants that might be there?
Thanks!
@Noel Wauchope: Pure hooey. How can one discern no level of radiation unless sealed in a lead box? There is always background radiation, something the creators of this ‘all’s safe’ don’t seem to know. Do not trust statements like this.
There is an ongoing Woolsey Fire Contamination Coverup that EnviroReporter.com is in the process of exposing. Stay tuned.
Who to believe? https://losangeles.cbslocal.com/2018/11/13/santa-susana-field-laboratory-woolsey-fire/ SIMI VALLEY (CBSLA) — Local, state and federal agencies have inspected the Santa Susana Field Laboratory and found that the nuclear Superfund site was not impacted by the Woolsey Fire.
The U.S. Department of Energy, its contractors and the California Department of Toxic Substances Control inspected the site on Sunday, Nov. 11 and determined that Area IV and the Northern Buffer Zone was untouched by the fire.
santa susana Officials: Santa Susana Nuclear Site Safe From Woolsey Fire
View of Area IV and DOE buildings which remain undamaged from fire. (DOE)
The Los Angeles County Department of Public Health also performed an assessment of the site and found “no discernible level of radiation in the tested area.”
@kat: Working backwards, we’ll address safety then length of threat. While we’re in the process of building a post-Rocketdyne Fire decontamination resource, a few quick ideas. If you can smell it outside still – and you probably can if within several miles of the burn – then wear an N95 mask outside (kids too). Avoid outside activity and kids stay inside. Clean up around house exterior and yards by hosing down everything from the top down to remove soot ONLY IF THERE IS PLENTIFUL WATER and there probably isn’t yet. Careful when sweeping to keep soot from cleanup clothes out of home/office. Drive with recirculation air ON and get car ionizer for air cleaning. Wash all fruit and vegetables grown and harvested outside in warm water and do it well. More on this to come so stay tuned but that will get you started.
“How long do all the toxic elements stay in the air?” is a good question. About 6-7 weeks tops HOWEVER this same dust get recirculated up into the air again and again. We wrote about the science of this in No Place to Hide – Fukushima Fallout Findings Widespread:
According to a 2007 University of Tennessee Department of Nuclear Engineering health physics report, “radioactive particulate matter is carried in air within dust particles.” Once a particle or aerosol is suspended in the air at any elevation it can be removed, altered or destroyed but can’t remain in the atmosphere indefinitely, according to Dr. James Dorsey of the University of Manchester where Dorsey earned a PhD in Atmospheric Physics in 2002. “Clearly the lifetime of any particular particle depends on its size and location,” Dorsey wrote. “Larger aerosol settle out of the atmosphere very quickly under gravity, and some surfaces are more efficient at capturing aerosol than others.”
&
In dry environments, where very small radioactive particles have no effective path to deposition over land or water bodies, nanoparticles join together in a process known as coagulation. These tiny particles, smaller than 100 nanometers, collide into each other due to forces that include electrostatic attraction, phoretic effects like that of heavier particles on lighter ones and transport of a particle due to temperature gradients where the particle moves from a high temperature to a low one. There is also Brownian diffusion which is the effect of thermal random motion on these particles.
Though complicated, these methods are how particles combine and fall to earth. Indeed, the drier the environment, the easier it is for particles to stick together because they don’t have to ‘squeeze’ the water molecules out first to join together. “In the kinetic regime, coagulation is always enhanced due to the absence of viscous forces,” according to Dorsey. That means Fukushima fallout would better bind with spewing aerosol trails better in drier climes like the desert than wet ones.
How long do all the toxic elements stay in the air? Does it eventually get blown all over the valley and somehow dissipate? Does it remain on everything it lands on,, the plants, streets, dirt, etc.? Trying to figure out how long a mask may be necessary and if everything getting hosed off around my house may help or if there is anything that can be done to make my house and yard safer for kids? Thanks.
@Crystal lane: Yes, for the region. Check out Los Angeles, CA RadNet readings. Note that the gamma graph reflects a significant bump during the fire days though that isn’t proof it was caused by the fire.
There will be a collection of potentially radioactive soot from downwinders for testing – keep an eye on EnviroReporter.com for further details.
Does anyone have any radiation readings downwind from the fire so we have some kind of definitive numbers to give to people for preparing them to do what they can do for protection ?
There is no one you can force to test the air. You can deduce that if we say it contains toxic fumes, it does, as do most wildfires especially one that just roared through Rocketdyne.
Who can we contact to force an analysis of the Air for contamination to confirm if the air contains toxic fumes?
It has burned before – SSFL in 2005
KTLA’s coverage shows the fire above Brandeis-Bardin burning through Area III with Area IV catching fire. Wind is blowing strong to the southwest carrying toxic smoke towards Ahmanson Ranch, the 101 Freeway, Liberty Canyon, Conejo Valley, Santa Monica Mountains and Malibu, potentially. This is a very dangerous event. All people who can smell the smoke from this fire should get themselves, their children, and pets inside and immediately close windows and use filtered air conditioning if possible. Masks should be worn and extreme care dealing with ash and embers. This is not a drill – ACT NOW
Television coverage showed the fire sweep through Areas II, III and nuclear Area IV. Since it is called the “Woolsey Fire,” it suggests it started there and probably burned Area I too in its march to the Pacific Ocean. If you are fortunate enough not to have lost property in this disaster, and live anywhere near this area of the fire and can still smell smoke and/or char over the next few days, MASK UP with at least an N95 mask and be very careful cleaning up the soot and ash once the fire is over. Do NOT let kids do the dirty work considering the potential pollutants in this fire soot, ash and debris. YOU do it AFTER the fires are fully out.
THIS FIRE IS STILL ACTIVE IN THE SSFL AREA AND SIMI HILLS. Mask up, keep kids and pets inside, use HEPA filters in air conditioners or stand alones and OFFER HELP TO YOUR NEIGHBORS. N95 MASKS FOR EVERYONE ON YOU!
ACTIVE FIRE ATTACKING AREA I OF SSFL – Christina Walsh’s video from about an hour ago shows the fire going up “IEL fault canyons” which is at the Area I entrance to SSFL. This area has had massive contamination and, on fire, is especially dangerous. Area residents must AVOID SMOKE, FIRE, EMBERS AND ASH and use N95 masks.
Unsubstantiated reports say Sage Ranch is on fire. Television helicopters shots seemed to indicate that Wayne Fishback’s former Ventura County dump property was burned.
Physicians for Social Responsibility-Los Angeles (PSR-LA), longtime advocates for the complete cleanup of the Santa Susana Field Laboratory, issued a Nov. 9, 2018 PSR-LA press release called Woolsey Fire Burns Nuclear Meltdown Site that State Toxics Agency Failed to Clean Up. The two-time Nobel Peace Prize winning group minced no words.
Dr. Robert Dodge, President of Physicians for Social Responsibility-Los Angeles, shares the community’s concerns. “We know what substances are on the site and how hazardous they are. We’re talking about incredibly dangerous radionuclides and toxic chemicals such a trichloroethylene, perchlorate, dioxins and heavy metals. These toxic materials are in SSFL’s soil and vegetation, and when it burns and becomes airborne in smoke and ash, there is real possibility of heightened exposure for area residents.”
Dodge said protective measures recommended during any fire, such as staying indoors and wearing protective face masks, are even more important given the risks associated with SSFL’s contamination. Community members are organizing a campaign on social media to demand that DTSC release a public statement revealing the potential risks of exposure to SSFL contamination related to the fire.
Minutes ago, a fire flare up along Alpha Road in Area II was spotted by us on excellent KABC Eyewitness News coverage. We captured it via a screen shot save, below. What it shows is that a new flare-up is near the middle of SSFL which cannot be good. Also not good was what wasn’t in any of the video of briefly flying over part of the lab – fire engines.
EnviroReporter.com‘s Denise Duffield joined 2017 Nobel Peace Prize winner Beatrice Fihn of the International Campaign to Abolish Nuclear Weapons (ICAN) in thanking LA City Councilmember Paul Koretz for his leadership in introducing a resolution in support of the U.N. Treaty on the Prohibition of Nuclear Weapons which passed unanimously in August. And she brought her Nobel Peace Prize medal with her!
This auspicious event came after the Los Angeles City Council voted to support the U.N. Nuclear Weapon Ban Treaty which led to California voting for it as well, and to restrict Presidential authority for a nuclear strike. Duffield has been at the forefront of these initiatives and EnviroReporter.com salutes her.
Los Angeles City Councilmember Paul Kortez, who has proven to be a remarkable and courageous leader, noted the historic occasion on Facebook:
“Beatrice Fihn, 2017 Nobel Laureate, brought her medal to City Hall this week to thank me for introducing a resolution this August that called upon our federal leaders to spearhead a global effort to prevent nuclear war by renouncing the option of using nuclear weapons first and ending the President’s sole, unchecked authority to launch a nuclear attack. In addition, it asks for a verifiable agreement among nuclear-armed states to eliminate their nuclear arsenals. I introduced the resolution that was also signed by Mayor Eric Garcetti on the same day that he honored Hiroshima A-bomb survivors. My Director of Environmental Affairs Andy Shrader and I were joined at City Hall by Denise Duffield of Physicians for Social Responsibility – Los Angeles and Rick Wayman, Deputy Director of the Nuclear Age Peace Foundation. — with Denise Duffield, Paul Koretz, Andy Shrader, Rick Wayman and Beatrice Fihn in Los Angeles City Hall.”
For more Radiation Station Santa Monica California radiation test results:
Special Radiation Station Tests and Radiation Station Stats
Southern Hemisphere September 2018 Background Level Report
Station location
http://sccc.org.au/monitoring/Australian-Map.jpg
This short animation of Northern and Southern Hemisphere air circulation, shows why we can get detections so far south.
The reference monitoring station’s GammaScout Geiger counter died on the 12th September 2018, RIP. The last full day average it recorded was on the 11th September 2018. The GammaScout was used as a reference up until now, because all the data recorded here prior to Fukushima was using a GammaScout.
Will be trialling different equipment for the local monitoring station, a SBT-10 pancake, using Theremino Geiger counter software. I worked out how to transfer the logged data for this new setup into the charts I created for the GammaScout logged data. Because this is completely different monitoring equipment, the long term data reference will not be as accurate.
September’s 2018 month average is based on the 29 days of collected data.
September average background here tends to vary a lot from year to year. September marks the seasonal change from winter to spring and wind direction at this location during this seasonal change can swing wildly between tropical to southerlies. The more tropical wind we get for September, the higher the background, the more Southerly, the lower the background.
September 2018 day average background chart,
http://sccc.org.au/wp-content/uploads/2018/09/Caloundra-local-average-background-radiation-levels-September-2018.jpg
Caloundra September month average, year comparisons.
2018 14% above pre-Fukushima average
2017 27% above pre-Fukushima average
2016 12% above pre-Fukushima average
2015 5% above pre-Fukushima average
2014 6% above pre-Fukushima average
2013 15% above pre-Fukushima average
2012 13% above pre-Fukushima average
Cairns September Report – A slight increase around the middle of the month, but otherwise close to average. The Cairns monitoring station has two GammaScout Geiger counters.
http://sccc.org.au/wp-content/uploads/2018/10/Cairns-September-2018.jpg
Monthly and yearly average charts from 2007 to 2018.
http://sccc.org.au/yearly-average-background-radiation-levels
Disclaimer: This is an amateur volunteer run service. Human error can provide incorrect information, and equipment malfunction can produce false readings. Do not rely on, or take action upon information presented on this web site, without further research.
Default Pacific USA time zone unless otherwise indicated
September 16, 2018
 Sept 2018 Midwest rad testing – harbor
4:45 pm INT TERMINAL 4 BAGGAGE CLAIM LOS ANGELES INTERNATIONAL AIRPORT: 47.8 CPM^
11:50 am CDST INT OHARE AIRPORT CHICAGO: 37.5 CPM^
6:10 am EDST Southwest Michigan 1st floor room: 35.3 CPM^
September 15, 2018
8:45 pm EDST Southwest Michigan 1st floor room: 32.8 CPM^
8:00 am EDST Southwest Michigan 1st floor room: 30.0 CPM^
September 14, 2018
11:15 pm EDST Southwest Michigan 1st floor room: 39.0 CPM^
7:35 am EDST Southwest Michigan 1st floor room: 34.7 CPM^
September 13, 2018
 Sept 2018 Midwest rad testing – dunes
10:30 pm EDST Southwest Michigan 1st floor room: 34.3 CPM^
7:15 am EDST Southwest Michigan 1st floor room: 32.2 CPM^
September 11, 2018
10:00 pm EDST Southwest Michigan 1st floor room: 37.1 CPM^
10:30 am EDST St. Joseph, Michigan 2nd story room ST JOSEPH RIVER MOUTH AT LAKE MICHIGAN WATER SAMPLE: 24.5 CPM^ OR BACKGROUND BETWEEN PALISADES NUCLEAR PLANT 20 MILES TO THE NORTHWEST ALONG THE LAKE SHORE AND D.C. COOK NUCLEAR POWER PLANT 10 MILES TO THE SOUTHWEST
8:05 am EDST St. Joseph, Michigan 2nd story room: 30.3 CPM^
September 10, 2018
11:40 pm EDST St. Joseph, Michigan 2nd story room: 36.9 CPM^
9:10 am EDST St. Joseph, Michigan 2nd story room LAKE MICHIGAN WATER SAMPLE: 28.7 CPM^ OR BACKGROUND UP CURRENT OF PALISADES NUCLEAR PLANT 20 MILES TO THE NORTHWEST ALONG THE LAKE SHORE. AND DOWN CURRENT OF THE D.C. COOK NUCLEAR POWER PLANT 10 MILES TO THE SOUTHWEST
7:25 am EDST St. Joseph, Michigan 2nd story room: 31.2 CPM^
September 9, 2018
 Sept 2018 Midwest rad testing – pier
10:35 pm EDST St. Joseph, Michigan 2nd story room: 35.6 CPM^
8:10 pm EDST St. Joseph, Michigan 2nd story room: 32.9 CPM^
7:45 am EDST Southwest Michigan 1st floor room: 34.0 CPM^
September 8, 2018
9:35 pm EDST Southwest Michigan 1st floor room RAIN SAMPLE: 30.3 CPM^ OR BACKGROUND WITH NO SIGN OF RADON PROGENY PER USUAL IN THIS AREA
9:15 pm EDST Southwest Michigan 1st floor room: 32.8 CPM^
11:20 am EDST Southwest Michigan 1st floor room: 31.8 CPM^
6:00 am CDST INT OHARE AIRPORT CHICAGO: 33.1 CPM^
September 7, 2018
11:45 pm INT TERMINAL 4 LOS ANGELES INTERNATIONAL AIRPORT: 45.7 CPM^
The historic flooding now occurring after hurricane Florence poses the most serious threat to the local nuclear plants. Brunswick is just one of a number of nuclear power plants in the area that could be affected.
Here is a list of International Radiation Monitoring Stations for those who want to monitor, and keep an eye on the situation. This list includes private as well as government run monitoring stations.
http://sccc.org.au/international-radiation-monitoring-stations
Notification Date: 09/15/2018 Power Reactor Event Number: 53609
Facility: BRUNSWICK
Region: 2 State: NC
Unit: [1] [2]
Extract:
UNUSUAL EVENT DUE TO SITE CONDITIONS PREVENTING PLANT ACCESS
“A hazardous event has resulted in on site conditions sufficient to prohibit the plant staff from accessing the site via personal vehicles due to flooding of local roads by Tropical Storm Florence.”
https://www.nrc.gov/reading-rm/doc-collections/event-status/event/2018/20180917en.html#en53609
Sent earlier today to EnviroReporter.com from the Nuclear Regulatory Commission:
Nuclear Regulatory Commission – Press Release
No: II-18-033 September 13, 2018
NRC Expands Nuclear Power Plant Monitoring During Hurricane Florence
The Nuclear Regulatory Commission will staff its incident response center in Atlanta around the clock beginning this evening as it expands its monitoring of Hurricane Florence and its effects on nuclear power plants and other NRC-licensed facilities.
The NRC will continue 24-hour staffing as conditions require. NRC staff members will continue to monitor the path of Hurricane Florence while remaining in contact with plant operators, NRC on-site inspectors, the NRC’s headquarters operations center and state emergency officials.
Duke Energy notified the NRC that the company is shutting down both units at the Brunswick nuclear plant south of Wilmington, N.C., as that site is facing hurricane-force winds, major storm surges and heavy rain. This week, NRC inspectors have reviewed storm preparations, including protection against the amount of rain and flooding that might be expected. NRC inspectors are on site at the Brunswick plant and will remain there through the storm.
Officials at the Global Nuclear Fuels plant near Wilmington have also notified the NRC that they have shut down operations and secured equipment in advance of the storm.
Other nuclear plants in the projected storm path have prepared for high winds and heavy rainfall. NRC inspectors also will remain at those sites as conditions require.
Sent earlier today to EnviroReporter.com from the Nuclear Regulatory Commission:
Nuclear Regulatory Commission – Press Release
No: II-18-032 September 12, 2018
NRC Preparing for Hurricane Florence
The Nuclear Regulatory Commission resident inspectors at nuclear plants in the Carolinas and Virginia are reviewing the plant operators’ preparations in advance of Hurricane Florence, currently projected to make landfall in the Southeast later this week.
The NRC is also sending additional inspectors to those plants and will activate its regional incident response center in Atlanta, to provide around-the-clock staff support during the storm.
Duke Energy’s Brunswick nuclear plant south of Wilmington, N.C., could face hurricane-force winds, major storm surges and heavy rain. Other plants near the storm’s projected path are also taking precautions.
Nuclear plant operators would declare an emergency if conditions are expected that would require that declaration.
Plant procedures require operators to shut down the reactor well before hurricane-force winds arrive on site. In preparing for Hurricane Florence, the staffs at Brunswick, Surry in southeastern Virginia, Harris near Raleigh, N.C., Robinson near Hartsville, S.C., and some other plants are working through their severe weather procedures, including ensuring that all loose debris and equipment have been removed or secured, and conducting walk-down inspections of important systems and equipment.
NRC inspectors are verifying that all preparations have been completed, and the plants’ emergency diesel generators are available with ample fuel if the storm affects off-site power.
The NRC has also been in touch with officials at the Global Nuclear Fuels-America facility near Wilmington, N.C., the research reactor at North Carolina State University in Raleigh and other NRC licensees in the area to verify their preparations for the storm.
From the NRC Region II incident response center in Atlanta, NRC staff members will monitor Hurricane Florence while remaining in contact with plant operators, NRC on-site inspectors, the NRC’s headquarters operations center, and state emergency officials in the Carolinas, Virginia and all potentially affected states.
The additional NRC inspectors will remain at the nuclear plant sites and the incident response center will remain staffed as long as conditions require.
Southern Hemisphere August 2018 Background Level Report
Station location
http://sccc.org.au/monitoring/Australian-Map.jpg
This short animation of Northern and Southern Hemisphere air circulation, shows why we can get detections so far south.
Since the Fukushima Nuclear Catastrophe, the long term August month averages are showing a gradual increase background levels.
August 2018 day average background chart,
http://sccc.org.au/wp-content/uploads/2018/08/Caloundra-local-average-background-radiation-levels-August-2018.jpg
Caloundra August month average, year comparisons.
2018 12% above pre-Fukushima average
2017 17% above pre-Fukushima average
2016 8% above pre-Fukushima average
2015 5% above pre-Fukushima average
2014 4% above pre-Fukushima average
2013 8% above pre-Fukushima average
2012 9% above pre-Fukushima average
Cairns August Report – “All pretty level, no significant peaks.” The Cairns monitoring station has two GammaScout Geiger counters.
http://sccc.org.au/wp-content/uploads/2018/09/Cairns-August-2018.jpg
Monthly and yearly average charts from 2007 to 2018.
http://sccc.org.au/yearly-average-background-radiation-levels
Disclaimer: This is an amateur volunteer run service. Human error can provide incorrect information, and equipment malfunction can produce false readings. Do not rely on, or take action upon information presented on this web site, without further research.
JAPAN
6th September 2018 – Japan nuclear plant’s power restored after quake triggers Hokkaido blackout
Extracts:
Power was restored to a nuclear energy plant in Hokkaido, northern Japan on Thursday after a strong earthquake left it relying on emergency generators for 10 nervous hours, but it may be a week before lights are back on all over the major island.
In another echo of the 2011 disaster, Hokkaido’s situation was compounded by difficulties in receiving supplies from neighboring regions that remain dominated by separate utilities with their own grids.
https://www.reuters.com/article/us-japan-quake-nuclear/japanese-nuclear-station-on-emergency-power-after-quake-revives-fukushima-memories-idUSKCN1LM031
Quantum Pendant Scalar Technology
Someone provided a Quantum Pendent to test, it uses Quantum Scalar Technology.
What is a Quantum Pendant you ask?
It is a wearable pendant around 5cm in diameter, made from specialized Japanese lava based compound and plant extracts like Hemp protein. Claims are that it protects the wearer from EMF radiation emitted by Wifi devices, cell phones, power lines etc., and has positive benefits for your health.
The Youtube video below, indicates there are fake versions of Quantum Pendants being sold.
There are a large number of different styles of Quantum Pendants being sold on the Internet, much more than referenced in this video. There is a lot of debate on the Internet over which versions are actually the fake version of the Quantum Pendant. We have no idea which product is the official version. Ebay prices varied wildly from hundreds of dollars to a couple dollars.
https://www.ebay.com/sch/i.html?_nkw=quantum+pendant
Below are the Pancake Geiger counter and Scintillator test results of the pendant that was provided for testing. Yes, you are supposed to wear this pendant to get the energy benefits! It turns out for some strange reason, that the person who provided it for testing doesn’t want it back, and said I could have it!
The Pancake Geiger result minus background was 2170 Counts Per Minute (CPM), or around eighteen times the local background here.
(Note: This test is a log chart.)
http://sccc.org.au/wp-content/uploads/2018/08/ThereminoGeiger_2018_07_31_12_23_39-1024×770.jpg
The scintillator Gamma radiation test result minus test chamber background was 230 CPM. The test chart shows the decay daughters of Thorium-232. This pendant does make an excellent peak calibration test source for the scintillator test equipment here.
http://sccc.org.au/wp-content/uploads/2018/08/Quantum-Pendant-Japanese-Technology-TV7.2-18c-5100.png
In my opinion the one provided for testing was significantly radioactive! I can only say that the one provided for testing had radioactive material in it. Are other Quantum Pendants this radioactive? I have no idea, you would need to have them tested to find out.
Here is what the Australian Radiation Protection and Nuclear Safety Agency (ARPANSA), has to say about these pendants.
https://www.arpansa.gov.au/understanding-radiation/radiation-sources/more-radiation-sources/pendants
Anti-Proton tested one in 13 January 2013 and detected Uranium and Thorium decay daughters.
By the way, I definitely will not be wearing this pendant!
It has been put to good use. It is stored in a lead lined container and used for radioactive peak calibration of scintillator test equipment here.
Disclaimer: This is an amateur volunteer run service. Human error can provide incorrect information, and equipment malfunction can produce false readings. Do not rely on, or take action upon information presented on here without further research.
Southern Hemisphere Spike Detections Update, & July 2018 Southern Hemisphere Report
Station location
http://sccc.org.au/monitoring/Australian-Map.jpg
This short animation of Northern and Southern Hemisphere air circulation, shows why we can get detections so far south.
Spike in Background Levels in Tasmania 4th and 6th July, and Caloundra on the 7th July 2018
Very surprised to find this significant detection showing up on the Caloundra 24 hour chart for the 7th of July. There had been an up tick in background at the beginning of July compared to June 2018, but the 52% above day average detection was a shock. Wind direction at the time was from inland Australia, which was also very surprising. We had a very light short shower in the morning. The live Radon monitor here showed nothing significant, levels were relatively low, around 0.2 pCi/l.
We have looked around the World wind maps to try and determine the source of these significant background spikes, but have been unable to pinpoint a definitive source. One suggestion put forward is the possible venting of volatile radioactive gases from the Lucas Heights nuclear reactor in Sydney that were blown around in the local atmosphere.
I went to the Australian Nuclear Science and Technology Organization (ANSTO), monitoring station web site. Their monitoring station is located near Lucas Heights nuclear reactor in Sydney Australia. This was to see if their monitoring station had picked up any spikes in July background radiation levels. What I found was the notice below. A strange coincidence ????
Radiation monitoring
“The environmental radiation station will not be operational in July due to repairs and maintenance of the system.”
http://www.ansto.gov.au/Resources/Localenvironment/Atmosphericmonitoring/Radiationmonitoring/index.htm
Interestingly there were reports of a breakdown at the Lucas Height nuclear reactor in late June 2018.
28th June 2018 – Breakdown at Lucas Heights nuclear reactor in Sydney sparks fears of medical supplies shortage
Extract:
The facility’s production of 10,000 doses of technetium-99m per week for Australian patients has come to a halt. The products are used in nuclear imaging and are a vital diagnostic tool used in scans for heart, lung and musculoskeletal conditions, cancer and many other medical conditions.
Engineers were not yet able to “physically attend to the conveyor” an ANSTO spokesman said, although they had been working on fixing the mechanical fault over the weekend.
http://www.abc.net.au/news/2018-06-27/lucas-heights-nuclear-reactor-breakdown-medical-supply-shortage/9915242
Nullschool 7th July wind chart for Caloundra
https://earth.nullschool.net/#2018/07/07/1400Z/wind/surface/level/orthographic=-217.66,-32.79,1247
Caloundra 24 hour 60 second sampling chart for the 7th July.
http://sccc.org.au/wp-content/uploads/2018/07/Caloundra-24-hour-chart-070718.jpg
A few days before the Caloundra detection, a contact in Tasmania informed me of spikes in their local background. Spikes in background in Tasmania were detected on two separate detectors. On the 4th July the Tasmanian wind direction source was also off the Australian mainland.
Nullschool 4th July wind chart for Tasmania
https://earth.nullschool.net/#2018/07/04/0600Z/wind/surface/level/orthographic=-209.76,-28.21,815/loc=146.465,4.276
Tasmania, 4th July Background chart
http://sccc.org.au/wp-content/uploads/2018/07/Tasmania-4th-July-2018.png
Tasmania, 6th July Background chart
http://sccc.org.au/wp-content/uploads/2018/07/Tasmania-6th-July-2018.png
The Tasmanian monitoring station happened to have an air filter which was sent to me for testing and arrived a few day later.
Below is the Tasmania filter test chart minus background tested using new Theremino PMT adapter equipment. If there was anything present it is below the resolution of the equipment here.
http://sccc.org.au/wp-content/uploads/2018/08/Tasmania-filter-test-110718-TV7.2-16c-161387.png
Caloundra Water Tank Filter test
Here is the latest Caloundra local water tank filter test of 45 grams of fine organic material minus background. The two prominent isotope peaks are for the isotopes of Lead-210, from Radon-222 decay, and Berryllium-7, from upper atmosphere spallation.
http://sccc.org.au/wp-content/uploads/2018/08/Tank-filter-of-organic-mater-45-grams-210718-TV-7.2-103180-text.png
Conclusion
The Caloundra and Tasmanian filter tests did not show anything significant, which points to radioactive short life volatile gases passing through. The most likely source of short life volatile radioactive gases in Australia would be the Lucas Heights nuclear reactor in Sydney Australia. The circumstantial evidence points to venting occurring at the Lucas Heights facility, to fix the broken conveyor used in the production of Technetium-99m.
Other possibilities are,
Another source on the Australia mainland.
An event somewhere else in the World or at Fukushima.
A secret device test in Australia.
Were the Caloundra and Tasmanian detections just coincidental?
Any suggestions or relevant information regarding these detections are welcome.
————————————————————
July is winter here in the Southern Hemisphere. Since the Fukushima Nuclear Catastrophe in 2011, long term local data collection is showing an increase in winter local background levels.
Caloundra 24 hour day average chart for July 2018
http://sccc.org.au/wp-content/uploads/2018/07/Caloundra-local-average-background-radiation-levels-July-2018.jpg
Caloundra July month average, year comparisons.
2018 14% above pre-Fukushima average
2017 17% above pre-Fukushima average
2016 8% above pre-Fukushima average
2015 5% above pre-Fukushima average
2014 5% above pre-Fukushima average
2013 6% above pre-Fukushima average
2012 9% above pre-Fukushima average
————————————————————-
International Radiation Monitoring Station Updated
Sites that were no longer operating have been removed, and new monitoring stations added.
http://sccc.org.au/international-radiation-monitoring-stations
Disclaimer: This is an amateur volunteer run service. Human error can provide incorrect information, and equipment malfunction can produce false readings. Do not rely on, or take action upon information presented on this web site, without further research.
August 1, 2018
6:45 pm INT RSSMC CHECKING FOR BETA TESTING DUST AGGREGATE FROM 3 HEPA FILTER IONIZING AIR CLEANERS: 55.1 CPM^^ OR ONLY 27.3% ABOVE BACKGROUND in six weeks aggregate.
6:30 pm INT RSSMC BG: 43.3 CPM^^
“Government officials originally estimated it would take about 40 years and $50 billion to clean up the plant, decontaminate the surrounding area, and compensate the disaster’s victims. In December 2016, they more than TRIPLED that estimate to $188 billion. “We have never experienced a disaster as big as Fukushima,” Hiroshige Seko, the head of Japan’s Ministry of Economy…”
“Human beings couldn’t go into the heart of Fukushima’s reactors to find the missing fuel, though—at least not without absorbing a lethal dose of radiation.”
First documentation of melted fuel – July 2017
“Then, something startling appeared on the monitors.”
“What is that?” said Matsuzaki.
“Everyone began talking at once and pointing to what they saw on the screens: murky glimpses of what appeared to be stalactites of something dripping like candle wax from the bottom of the reactor pressure vessel. They’d found the first signs of the missing fuel.”
No job for humans –
https://www.wired.com/story/fukushima-robot-cleanup/
Videos here –
The Little Sunfish Robot
https://www.theverge.com/2017/7/26/16030222/fukushima-nuclear-power-plant-robot-radioactive-fuel-tepco-little-sunfish
😐 What a mess!
Spikes detected on Australian monitoring stations located in Tasmania and Caloundra.
Very surprised to find this significant detection showing up on the Caloundra 24 hour chart for the 7th of July. There had been an up tick in background at the beginning of July compared to June 2018, but the 52% above day average detection was a shock. Wind direct at the time was from inland Australia which was also very surprising.
See Nullschool 7th July wind chart for Caloundra.
https://earth.nullschool.net/#2018/07/07/1400Z/wind/surface/level/orthographic=-217.66,-32.79,1247
Caloundra Station location:
http://sccc.org.au/monitoring/Australian-Map.jpg
Caloundra 24 hour 60 second sampling chart for the 7th July.
http://sccc.org.au/wp-content/uploads/2018/07/Caloundra-24-hour-chart-070718.jpg
A few days before the Caloundra detection, a contact in Tasmania informed me of spikes in his local background. These spikes in background in Tasmania were detected on two separate detectors. On the 4th July the Tasmanian wind direction source was also off the Australian mainland.
https://earth.nullschool.net/#2018/07/04/0600Z/wind/surface/level/orthographic=-209.76,-28.21,815/loc=146.465,4.276
Tasmania, 4th July chart
http://sccc.org.au/wp-content/uploads/2018/07/Tasmania-4th-July-2018.png
Tasmania, 6th July chart
http://sccc.org.au/wp-content/uploads/2018/07/Tasmania-6th-July-2018.png
Caloundra day average chart
http://sccc.org.au/wp-content/uploads/2018/07/Caloundra-local-average-background-radiation-levels-July-2018.jpg
What the chart colour codes mean.
http://sccc.org.au/what-does-each-step-in-the-alert-level-colour-code-mean
Questions:
What is the source of these significant Australian winter detections?
Was there an event or release on the Australia mainland?
Has a significant unreported nuclear event occurred somewhere in the world?
Were these detections unrelated and just coincidental?
Suggestions and information related to these detections are welcome.
Disclaimer: This is an amateur volunteer run service. Human error can provide incorrect information, and equipment malfunction can produce false readings. Do not rely on, or take action upon information presented on this web site, without further research.
Southern Hemisphere June 2018 Background Level Report
Station location
http://sccc.org.au/monitoring/Australian-Map.jpg
This short animation of Northern and Southern Hemisphere air circulation, shows why we can get detections so far south.
June is winter here in the Southern Hemisphere. The long term June data is showing a gradual increase in winter local background levels, since the Fukushima Nuclear Catastrophe.
June 2018 day average background chart,
http://sccc.org.au/wp-content/uploads/2018/06/Caloundra-local-average-background-radiation-levels-June-2018.jpg
Caloundra June month average, year comparisons.
2018 11% above pre-Fukushima average
2017 12% above pre-Fukushima average
2016 7% above pre-Fukushima average
2015 3% above pre-Fukushima average
2014 7% above pre-Fukushima average
2013 7% above pre-Fukushima average
2012 3% above pre-Fukushima average
Disclaimer: This is an amateur volunteer run service. Human error can provide incorrect information, and equipment malfunction can produce false readings. Do not rely on, or take action upon information presented on this web site, without further research.
@Peter March
Here are four significant factors that are now contributing to higher radiation detections during plane flights.
1. There was a significant amount of radioactive contamination blown into the upper atmosphere by the Fukushima nuclear catastrophe. When planes fly through this, some of the radioactive fallout cloud is sucked into the cabin of the aircraft.
Depending on wind pattens at the time of the catastrophe, flying in the Northern hemisphere between Japan and the USA was particularly hazardous. The radioactive particulate material getting into the aircraft was a significant risk to human health. It is still a risk, but just after Fukushima the risk was much greater. The Southern Hemisphere was not as severely affected by this new hazard.
This article by Michael Collins, EnviroReporter.com, documents a flight across America on December 23rd 2011.
2. Yes, it is normal to be exposed to greater amounts of radiation during flights at high altitudes, more so if the flight is closer to the poles. This is because at higher altitudes the earth’s atmosphere is much thinner and offers less protection from incoming solar and cosmic radiation. Look at this chart, Radiation verses Altitude, from Spaceweather.com. The radioactive particulate from Fukushima increases the risk.
http://spaceweather.com/cosmicrays/2015/22oct15/pfotzer_22oct15.png?PHPSESSID=3q7uq3akrjtubspjrfh1jbov40
3. A weaker Sun is now a third factor. The Sun is becoming far less radiant and is going into one of its quiet periods. Less Sun radiance means it’s heliosphere becomes much weaker. The heliosphere is a bubble-like region of space dominated by the Sun’s solar wind and magnetic field. It normally extends far beyond the orbit of Pluto. Plasma blown out from the Sun’s heliosphere acts as a shield, protecting the solar system and Earth from incoming intergalactic and galactic cosmic rays.
A much weaker heliosphere means more cosmic rays strike Earth’s upper atmosphere. Spaceweather.com have been conducting high altitude cosmic ray detection tests since 2015.
https://static1.squarespace.com/static/56530521e4b0c307d59bbe97/t/59512da6c534a573ac254b21/1498493389471/
4. The Earth’s magnet field is weakening. The Earth’s magnetic field also acts as a protective shield against solar wind and storms, and cosmic rays.
The Earth’s magnetic field has weakened by 20% already, and appears to be weakening by around 10% per decade, plus this weakening may accelerate in the coming years.
Read the “Earth Changes” report on EnviroReporter.com, to gain a better understanding of the dynamic changes that are occurring to our planet’s environment.
Hi, recently I flew from Cairns, Australia to Brisbane and on to Auckland New Zealand and my geiger counter went from 12cpm at ground level up to 2,500cpm at cruising altitude on both legs of the flight. I turned on the counter a number of times during both flights and the reading continued to stay at 2,400 – 2,400 cpm. Once a lower altitude was reached coming in to land, the level dropped back to normal. Is this normal for radiation levels at 30,000 feet, or are there elevated atmospheric levels in the upper atmosphere because of Fukushima?
EnviroReporter.com friend and international nuclear relations expert Dr. Bennett Ramberg has a timely piece on the North Korea/USA summit in Singapore that should be required reading for those in the Trump Administration that can.
The following NBC News OpEd provides the most comprehensive published examination of how layered security assurances can promote a durable North Korea nuclear deal:
Trump and North Korea: Kim Jong Un will need clear security assurances to agree to a nuclear deal
Trump has spoken about his willingness to guarantee Kim Jong Un’s survival. How he proposes doing that will be critical to any agreement.
Southern Hemisphere May 2018 Background Level Report
Station location
http://sccc.org.au/monitoring/Australian-Map.jpg
This short animation of Northern and Southern Hemisphere air circulation, shows why we can get detections so far south.
A nice quiet month without any significant background events. As most of the air flows here during this season come from a southerly direction, May local background levels were much lower than the summer months
May 2018 day average background chart
http://sccc.org.au/wp-content/uploads/2018/05/Caloundra-local-average-background-radiation-levels-May-2018.jpg
Caloundra May month average, year comparisons.
2018 12% above pre-Fukushima average
2017 7% above pre-Fukushima average
2016 12% above pre-Fukushima average
2015 4% above pre-Fukushima average
2014 13% above pre-Fukushima average
2013 7% above pre-Fukushima average
2012 7% above pre-Fukushima average
Disclaimer: This is an amateur volunteer run service. Human error can provide incorrect information, and equipment malfunction can produce false readings. Do not rely on, or take action upon information presented on this web site, without further research.
May 30, 2018
8:15 am INT Radiation Station Santa Monica California SANTA MONICA CA RAIN SAMPLE: 36.6 CPM^^ or normal background.
8:00 am INT RSSMC BG: 42.9 CPM^^
May 29, 2018
6:00 pm INT Radiation Station Santa Monica California (RSSMC) CHECKING FOR BETA TESTING DUST AGGREGATE FROM 3 HEPA FILTER IONIZING AIR CLEANERS: 93.0 CPM^^ OR 2.4 TIMES BACKGROUND in seven weeks aggregate.
5:45 pm INT RSSMC BG: 38.9 CPM^^
From our friends at Fight for the Future who are behind the “RED ALERT FOR NET NEUTRALITY” campaign you’ve seen, and hopefully signed, on the pages of EnviroReporter.com:
“We won! The U.S. Senate just voted to overturn the FCC’s repeal of net neutrality!
Even better, your work helped win the votes of TWO undecided senators who swung our way at the last minute, giving us a 52-47 margin and huge momentum. That’s game-changing.
Now the fight moves to the House of Representatives—and with the FCC scheduled to end net neutrality on June 11th unless Congress stops them, the stakes are higher than ever…
Comcast, Verizon, and the rest of Big Cable thought sure they could beat us with all the millions they spent on lobbyists and campaign contributions.
But for months, the Internet has been on fire. You called. You rallied. You protested. You did whatever it took. You didn’t give up. And today, the Senate passed the resolution overruling Ajit Pai and restoring net neutrality in a historic upset!
The key to winning in the Senate was mobilizing so much grassroots pressure that it was impossible for undecided senators to ignore us. And that will be even more true in the House of Representatives, where every member is already looking ahead to November and trying to figure out how to keep their seats in what is predicted to be an incredibly close election…
No one thought we’d get this far, but this is just the first step. Now we need to pass the same resolution in the House of Representatives.”
Southern Hemisphere April 2018 Background Level Report
Station location
http://sccc.org.au/monitoring/Australian-Map.jpg
This short animation of Northern and Southern Hemisphere air circulation, shows why we can get detections so far south.
This month the GammaScout Geiger Counter used for data logging local background, developed a fault. I managed to get it working again, but in the process lost some day average logging data, hence the gap in the chart.
April month averages tend to vary from year to year by a significant amount. As the Southern Hemisphere winter approaches, air flows here swing a lot between Northern Tropic air to Southern Ocean air flows. If we get more tropical air in April the background goes up. If there are more Southern Ocean air flows, the month average goes down. Since Fukushima, this has become a dynamic of the local background monitoring. If you look at the charts on the yearly average background page, link below, you can clearly see an annual winter background dip showing up in the year and month background charts.
http://sccc.org.au/yearly-average-background-radiation-levels
April 2018 day average background chart,
http://sccc.org.au/wp-content/uploads/2018/04/Caloundra-local-average-background-radiation-levels-April-2018.jpg
Caloundra April month average, year comparisons.
2018 24% above pre-Fukushima average
2017 11% above pre-Fukushima average
2016 33% above pre-Fukushima average
2015 6% above pre-Fukushima average
2014 22% above pre-Fukushima average
2013 9% above pre-Fukushima average
2012 12% above pre-Fukushima average
Cairns April Report – Fairly level, without any spikes. (Cairns has two monitoring Geiger counters.)
http://sccc.org.au/wp-content/uploads/2018/05/Cairns-April-2018.jpg
Disclaimer: This is an amateur volunteer run service. Human error can provide incorrect information, and equipment malfunction can produce false readings. Do not rely on, or take action upon information presented on this web site, without further research.
May 5, 2018
10:20 pm INT RSSMC SANTA MONICA CA PACIFIC OCEAN SAMPLE FROM SANTA MONICA BAY IN PACIFIC PALISADES: 44.6 CPM^^ or normal background.
10:00 pm INT RSSMC BG: 39.3 CPM^^
May 1, 2018
4:35 pm INT RSSMC SANTA MONICA CA RAIN SAMPLE: 40.1 CPM^^ or normal background.
4:20 pm INT RSSMC BG: 37.1 CPM^^
It’s been a while since I looked at the TEPCO Fukushima NPP live web cams.
Over the last year or so,
– A sarcophagus has been built over Reactor 3. Shaped somewhat like the one at Chernobyl.
– A room has been built on stilts and is attached to the west wall at Reactor 2.
– Some new wall pieces have been placed on the open hole of what was Reactor 1.
Unit 4 view:
http://www.tepco.co.jp/en/nu/f1-np/camera/index-e.html
Unit 1 view:
http://www.tepco.co.jp/en/nu/f1-np/camera/index2-e.html
When I see the sunrise at Fukushima I can’t help but see the beauty. Thanks to the Nuclear Power Industry that spectacular spot on our planet has been forever changed. No dollar value can be placed on that. 🙁
AUSTRALIA
16th April 2018 – Out-of-control Sydney bush fire spreads towards nuclear reactor and army ammunition warehouse as residents in surrounding suburbs are told ‘it’s too late to leave
Extracts:
Out-of-control Sydney bush fire spreads towards nuclear reactor and army ammunition warehouse as residents in surrounding suburbs are told ‘it’s too late to leave.
A spokesman for the Australian Nuclear Science and Technology Organisation in Lucas Heights said there is no current threat to the reactor, but safety measures had been taken.
‘ANSTO always works with local emergency services, and the Rural Fire Service has advised no risk to ANSTO as a result of the fires in the vicinity of our Lucas Heights campus,’ said the spokesperson.
Article:
http://www.dailymail.co.uk/news/article-5617263/Sydney-bushfire-spreads-nuclear-reactor-army-base-residents-nearby-evacuated.html
Comment:
Below is a screen shot from the Australian Nuclear Science and Technology Organisation’s (ANSTO) local live radiation monitoring station at Endagine. Endagine is located East of the Lucas Heights nuclear reactor.
https://www.whereis.com/nsw/engadine-2233
The live ANSTO radiation monitor shows a significant spike in radiation.
http://sccc.org.au/wp-content/uploads/2018/04/Australia-Sydney-ANSTO-Monitoring-site-15th-to-16th-April-2018.png
What caused this spike in local radiation?
Did the fire release local radioactive contamination?
Reactor venting?
Fault in equipment?
Their rainfall monitor shows it definitely was not raining at the time, so it was not a Radon washout event.
ANSTO live monitoring station,
http://www.ansto.gov.au/Resources/Localenvironment/Atmosphericmonitoring/Radiationmonitoring/index.htm
Here are notes from the ANSTO monitoring site page.
Gamma radiation is a penetrating form of short wavelength electromagnetic radiation, similar to X-rays.
The environmental radiation graph (above) shows measurements in nanoGrays (nGy) which are units of absorbed radiation dose commonly used in environmental monitoring. A nanoGray is one billionth (one thousand millionth) of a Gray.
A temporary rise in environmental gamma radiation is often detected when it rains. This occurs because rain affects the behaviour of naturally occurring radionuclides, such as the gas radon. These radionuclides can be absorbed by rain drops and temporarily concentrated near the ground. Also, radon naturally builds up in air spaces in the soil and can be released when rain soaks into the ground.
“Spikes” in the environmental radiation graph (above) may occur during the regular calibration checks (see below) of the instrument that are needed to ensure accurate data. Gaps appearing in either graph are usually associated with delayed radio transmission of data from Engadine.
April 9, 2018
4:05 pm INT RSSMC CHECKING FOR BETA TESTING DUST AGGREGATE FROM 3 HEPA FILTER IONIZING AIR CLEANERS: 87.0 CPM^^ OR 2.1 TIMES BACKGROUND in five weeks aggregate.
3:40 pm INT RSSMC BG: 41.9 CPM^^
Southern Hemisphere March 2018 Background Level Report
Station location
http://sccc.org.au/monitoring/Australian-Map.jpg
This short animation of Northern and Southern Hemisphere air circulation, shows why we can get detections so far south.
The stats are in, and March 2018 had the highest recorded March background ever recorded here, at 46% above average. What is creating these Southern Hemisphere increases? Fukushima atmospheric contamination? Increases cosmic rays? Radon releases, or combination of all off these?
Alert Caloundra 27th March 2018 – In the morning the GammaScout Geiger counter started to alarm on and off very quickly. One visual observation showed a spike of 0.625 uSv/hr. Looking at all the very short duration high detections I have been seeing recently, it suggests to me that I am detecting lots of hot particles in the atmosphere. If I didn’t have 60 second sampling and a 0.30 uSv/hr alarm setting in place, I would probably have missed these detections. They would have been hidden in the averages, because they are of such a short duration.
The 24hr 60 second logging chart shows numerous short duration peaks between 8.30 am and 11.30 am.
http://sccc.org.au/wp-content/uploads/2018/03/Caloundra-24-hour-chart-270318.jpg
At the time we had one low pressure system sitting off the East coast plus another in North Queensland, look at the wind map link below. The wind map shows the local air mass at the time was coming off the Pacific Ocean. The main source appeared to be a high pressure system situated East of New Zealand. The air from it was being drawn into these two lows. This air flow was passing over this location at the time. My present theory is that contaminated air was drawn down from the upper atmosphere to the surface, by this high pressure system.
The wind direction at the time was South Easterly, off the Pacific Ocean! It was an overcast, but a fine day.
https://earth.nullschool.net/#2018/03/27/0600Z/wind/surface/level/orthographic=-192.66,-35.51,1343/loc=146.465,4.276
On the 27th March Radon levels where relatively low.
http://sccc.org.au/wp-content/uploads/2018/03/ThereminoGeiger_2018_03_27_21_16_00.png
March 2018 day average background chart, (What the bar chart colour codes mean.)
http://sccc.org.au/wp-content/uploads/2018/03/Caloundra-local-average-background-radiation-levels-March-2018.jpg
Caloundra March month average, year comparisons.
2018 46% above pre-Fukushima average
2017 38% above pre-Fukushima average
2016 39% above pre-Fukushima average
2015 33% above pre-Fukushima average
2014 31% above pre-Fukushima average
2013 32% above pre-Fukushima average
2012 24% above pre-Fukushima average
Year and month average local background radiation levels from 2007 to 2018.
http://sccc.org.au/yearly-average-background-radiation-levels
Disclaimer: This is an amateur volunteer run service. Human error can provide incorrect information, and equipment malfunction can produce false readings. Do not rely on, or take action upon information presented on this web site, without further research.
Default Pacific USA time zone unless otherwise indicated
March 22, 2018
4:10 pm INT RSSMC SANTA MONICA CA RAIN SAMPLE FROM SECOND MAJOR BAND OF “PINEAPPLE EXPRESS” STORM: 42.1 CPM^^ or normal background with no radon progeny per usual.
3:00 pm INT RSSMC BG: 44.4 CPM^^
March 21, 2018
4:10 pm INT RSSMC SANTA MONICA CA RAIN SAMPLE FROM “PINEAPPLE EXPRESS” STORM: 38.5 CPM^^ or normal background with no radon progeny per usual.
3:50 pm INT RSSMC BG: 43.0 CPM^^
March 21, 2018
4:10 pm INT RSSMC SANTA MONICA CA RAIN SAMPLE FROM “PINEAPPLE EXPRESS” STORM: 38.5 CPM^^ or normal background with no radon progeny per usual.
3:50 pm INT RSSMC BG: 43.0 CPM^^
Well, it appears that my suspicions about this not being Californium were well founded.
21st March 2018 – “Nuclear” mystery solved in Ankara”
Extracts:
The mystery behind the seizure by Turkish police of a substance that had been believed to be the extremely rare nuclear chemical Californium in a poor area of Ankara has been solved after Turkey’s nuclear authority identified it instead as an organic resin, economy-focussed newspaper Dünya said .
Analysts were baffled when pro-government broadcaster NTV announced that 1.4 kg of Californium had been found in the Ankara suburb of Pursaklar, with some pointing out that that amount would represent around 4,000 years of global production of the element at present rates.
https://ahvalnews.com/californium/nuclear-mystery-solved-ankara
Information on Californium.
This would make quite an interesting espionage documentary & film.
Quotes from: https://www.quora.com/Why-does-the-element-californium-cost-27-millions-dollars-a-gram
“Californium is known to be one of the most expensive materials on the earth due to its cost of transportation, limited availability, and expensive production process.”
“Only a handful of facilities are capable of producing Californium including the US Oak Ridge National Laboratory and the Research Institute of Atomic Reactors in Russia. As little as 0.25g of the element might be produced in a single year. This means that it is extremely scarce and has limited availability.”
If as little as 0.25g of the element might be produced in a single year, then 441 grams would take 1764 years to produce!
Another Quote:
“Thirdly it is an element that is not easily transported. Despite its microscopic size, Californium must travel in specialized heavy duty containers that prevent the release of radioactive material. You may think that a single gram of Californium could be carried in a small container? In reality, that single gram would require a huge shipping cask that is specifically designed and built to transport the element.”
In this article, they are showing multiple glass vials and a plastic bag of highly radioactive Californium, out in the open.
There is far more to this story than a first read would indicate!!!
Is it Californium in these vials?
If not, what is it?
Maybe this story has another agenda!!!
Quote from: https://www.gizmodo.com.au/2015/10/californium-the-element-that-kickstarts-nuclear-reactors/
“Usefulness came later, when bombarding plutonium-239 with single neutrons produced microgram-sized samples. More important than the increase in size was the change in isotopes. Early experiments produced californium-245, which has a seven minute half life. Californium-252, produced during the later experiments, has a half life of around two and a half years. During much of that time, a microgram-sized sample is giving off 170,000,000 neutrons per minute.
This makes it a very useful substance. Nuclear reactors work by getting neutrons shot into them, which causes some of the atoms to split, giving off more neutrons and perpetuating the reaction. The famous inanimate carbon rod can be used to soak up those extra neutrons, slowing the reaction down. When the reaction gets too slow, though, you need a neutron source to start it up. This is where californium-252 comes in. It’s a tiny, effective neutron emitter that can jump-start a nuclear reactor.”
TURKEY
I used Google translate to get the extracts from the Turkish article.
19th March 2018 – US $ 70 million nuclear material operation in Ankara
Extracts:
In an automobile search in Ankara, one kilogram of 441 grams of nuclear “californium”, worth 70 million dollars in market value, was seized.
Turkey Atomic Energy Agency (TAEK) to the authorities, security officials, “californium” substance is generated only in the United States and Russia.
Comment:
International smuggling and theft of nuclear material is a huge problem. Weight for weight some nuclear isotopes can be worth way more than gold. Who was going to purchase this californium, and what was it going to be used for?
https://aa.com.tr/tr/turkiye/ankarada-70-milyon-dolarlik-nukleer-madde-operasyonu/1093216
EnviroReporter.com‘s prescient exposés over the years showing how vulnerable our aged and dangerous nuclear power plant should have been a wake-up call to toughen up standards and security. Now it may be too late with Russia having penetrated America’s critical and nuclear infrastructure according to today’s Ides of March U.S. U.S. Department of Homeland Security Computer Emergency Readiness Team (US-CERT) ALERT.
Original release date: March 15, 2018
Systems Affected
Domain Controllers
File Servers
Email Servers
Overview
This joint Technical Alert (TA) is the result of analytic efforts between the Department of Homeland Security (DHS) and the Federal Bureau of Investigation (FBI). This alert provides information on Russian government actions targeting U.S. Government entities as well as organizations in the energy, nuclear, commercial facilities, water, aviation, and critical manufacturing sectors. It also contains indicators of compromise (IOCs) and technical details on the tactics, techniques, and procedures (TTPs) used by Russian government cyber actors on compromised victim networks. DHS and FBI produced this alert to educate network defenders to enhance their ability to identify and reduce exposure to malicious activity.
DHS and FBI characterize this activity as a multi-stage intrusion campaign by Russian government cyber actors who targeted small commercial facilities’ networks where they staged malware, conducted spear phishing, and gained remote access into energy sector networks. After obtaining access, the Russian government cyber actors conducted network reconnaissance, moved laterally, and collected information pertaining to Industrial Control Systems (ICS)…[MORE]
EnviroReporter.com‘s work exposing these nuclear power plant vulnerabilities is more pertinent than ever. It is never too late to at least try to defend these ‘in-place nuclear weapons’ from Russia and other bad actors.
Southern Hemisphere February 2018 Background Level Report
Station location
http://sccc.org.au/monitoring/Australian-Map.jpg
This short animation of Northern and Southern Hemisphere air circulation, shows why we can get detections so far south.
A contributing factor to the day average increases near the end of February would have been the 10 pCi/l + Radon spikes that were detected on the 23rd, 24th and 25th. The Radon spike detections were possibly a precursor to an up tick in earthquake and volcanic activity on the Pacific rim, as the surface wind was coming off the Pacific Ocean at the time.
Even so, the elevated Radon levels would not account for all the month day average background increases.
Chart of Radon Spike on the 25th
http://sccc.org.au/wp-content/uploads/2018/03/Radon-spike-25th-February-2018.png
February 2018 day average background chart,
What the bar chart colour codes mean. http://sccc.org.au/what-does-each-step-in-the-alert-level-colour-code-mean
http://sccc.org.au/wp-content/uploads/2018/02/Caloundra-local-average-background-radiation-levels-February-2018.jpg
Caloundra February month average, year comparisons.
2018 49% above pre-Fukushima average
2017 42% above pre-Fukushima average
2016 41% above pre-Fukushima average
2015 30% above pre-Fukushima average
2014 40% above pre-Fukushima average
2013 39% above pre-Fukushima average
2012 37% above pre-Fukushima average
Year and month average local background radiation levels from 2007 to 2018.
http://sccc.org.au/yearly-average-background-radiation-levels
Disclaimer: This is an amateur volunteer run service. Human error can provide incorrect information, and equipment malfunction can produce false readings. Do not rely on, or take action upon information presented on this web site, without further research.
[caption id="attachment_25592" align="aligncenter" width="770"] Santa Monica rain at background 3-14-18[/caption]
March 14, 2018
12:20 am INT RSSMC SANTA MONICA CA RAIN SAMPLE: 44.3 CPM^^ or normal background.
12:05 am INT RSSMC BG: 42.5 CPM^^
🙁 3/11 March 11, 2011
I was watching CBS news tonight and they mentioned the 2011 Japanese Tsunami and gave about 20 seconds at the end to mention Fukushima’s Nuclear issues, except to say there were 3 ‘partial’ meltdowns and that the plants were still in cleanup that could take 30 to 40 years. [paraphrased]
CBS video
https://www.cbsnews.com/live/video/20180312021228-japan-remembered-the-more-than-18000-lives-lost-in-the-2011-tsunami/
Some may say “No news is good news”, but I have to wonder about that when it comes to Fukushima and other radioactive contamination disasters/debacles. (Being ‘fed’ misleading or inaccurate bias’ might also be included.)
IMO: I guess ‘No News’ is not ‘Fake News’, but it is ‘Negligent News’ regardless.
I remember the first day I found this site. I was searching for someone with a Geiger counter several days after the Fukushima meltdowns and I found the Ustream of EnviroReporter’s Inspector Detector. I quickly became fascinated by the implications of Fukushima. Not only understanding of radiation, but how the understanding/misunderstanding came about. I also found it odd that the mainstream media seemed to present a different picture of Fukushima and would ‘seem’ to control the broadcast feed making sure not to alarm the public.
The amount of IMPORTANT knowledge I have found here over the last seven years is immense when I think about it. There were a lot of page views during the first year and then it dropped off to what it is now. But what I know is this, it’s highly likely that another meltdown or radioactive disaster will occur sooner or later and people will again do research and come to this site. If they take the time to read through the historical archives here, at least a quick scan, they will learn quickly and be amazed.
Here’s just a few of things I’ve learned in 7 years.
1. Radiation in ANY amount is not good for you.
2. The Nuclear Industry has been a scam since it’s inception.
3. News and data/information regarding all things Nuclear are lopsided.
4. That governments have failed us and lied to us regarding Nuclear. (ongoing)
5. The planet is at grave risk and not enough people know about it, yet.
6. ‘Acceptable Risk’ is is a misnomer.
Thanks again to EnviroReporter.com for keeping the information coming.
“Capture a Dream, your life’s being run by modern MACHINES”
(press CC for Closed Caption to view the lyrics)
[ My latest original song. Feel free to share or comment. Thanks.]
March 10, 2018
6:30 pm INT RSSMC SANTA MONICA CA RAIN SAMPLE: 41.1 CPM^^ or normal background.
6:10 pm INT RSSMC BG: 39.4 CPM^^
Slighty elevated readings in rare rain on the border of the Sonoran Desert and the Coastal Ranges of Southern California:
March 4, 2017, 2018
9:00 am INT Building in Sonoran Desert: 44.2 CPM^^
12:25 am INT Building: 50.0 CPM^^ or 18.8% more than immediate prior background. This exceeds the Inspector’s +/- margin of error of 15%. While possible, it is unlikely that radon gas had much to do with the elevated reading as it was very windy and this part of California has low potential for significant radiation.
12:05 am INT Building in Sonoran Desert 40 miles north of Mexico BG: 42.1 CPM^^
February 27, 2017, 2018
12:25 am INT RSSMC RAIN SAMPLE: 38.1 CPM^^ or 16% less than normal background which can happen when radon-free rain water is tested.
12:05 am INT RSSMC BG: 45.3 CPM^^
Ever since Fukushima’s triple meltdown began March 11, 2011, EnviroReporter.com has recommended robust air filters. Here’s more evidence of why that’s a good recommendation:
February 26, 2017, 2018
6:25 pm INT Radiation Station Santa Monica California CHECKING FOR BETA TESTING DUST AGGREGATE FROM 3 HEPA FILTER IONIZING AIR CLEANERS: 143.3 CPM^^ OR 3.2 TIMES BACKGROUND in seven weeks aggregate. California Highway Patrol considers three times background for a toxic substance to be the threshold for initiating Hazardous Materials Protocols.
6:00 pm INT Radiation Station Santa Monica California BG: 44.4 CPM^^
MEXICO
10th February 2018 – Massive alert in Mexico after radioactive device stolen
Extracts:
Mexico’s interior ministry has issued an alert across seven states following the theft of a radioactive device.
The item in question is a nuclear densometer which is used in geotechnical engineering to measure density. It contains radioactive material and there are fears such material could be used to make a “dirty bomb.”
https://www.rt.com/news/418408-radioactive-device-stolen-mexico/
Southern Hemisphere January 2018 Background Report
Station location
http://sccc.org.au/monitoring/Australian-Map.jpg
This short animation of Northern and Southern Hemisphere air circulation, shows why we can get detections so far south.
Caloundra 2nd January 2018 – Another massive Radon spike was detected and reached up to 10 pCi/L.
http://sccc.org.au/wp-content/uploads/2014/10/Radon_Info_ENG.pdf
At the peak of this spike it was very humid, but not raining, and the local Radon monitor was in a wooden building with the door and some windows open. Under these environmental monitoring conditions, this is a very large spike in local Radon levels. The wind direction during the event was from the tropics.
Radon Event Chart:
http://sccc.org.au/wp-content/uploads/2018/01/ThereminoGeiger_2018_01_02_21_29_19.jpg
Caloundra January month average, year comparisons.
2018 45% above pre-Fukushima average
2017 42% above pre-Fukushima average
2016 41% above pre-Fukushima average
2015 40% above pre-Fukushima average
2014 41% above pre-Fukushima average
2013 52% above pre-Fukushima average
2012 43% above pre-Fukushima average
On the 15th January there was a marked drop in background levels, as the wind direction changed to a Southerly from the Southern Ocean. This dynamic has been constant since Fukushima. Whenever Southern Ocean air flows reach here, we get a significant drop in background levels.
https://earth.nullschool.net/#2018/01/15/0600Z/wind/surface/level/orthographic=-204.25,-20.02,1344/loc=146.465,4.276
January 2018 day average chart,
http://sccc.org.au/wp-content/uploads/2018/01/Caloundra-local-average-background-radiation-levels-January-2018.jpg
What the bar chart colour codes mean.
http://sccc.org.au/what-does-each-step-in-the-alert-level-colour-code-mean
Cairns North Queensland January background Report – Fairly flat, the little spikes were coincidental with some thunderstorms and good rainfalls.
The Cairns monitoring station has two GammaScout Geiger counters.
http://sccc.org.au/wp-content/uploads/2018/02/Cairns-January-2018.jpg
Year and month average local background radiation levels from 2007 to 2018.
http://sccc.org.au/yearly-average-background-radiation-levels
Disclaimer: This is an amateur volunteer run service. Human error can provide incorrect information, and equipment malfunction can produce false readings. Do not rely on, or take action upon information presented on this web site, without further research.
NORMAL RADIATION IN GREATER LOS ANGELES BASIN LIGHT RAIN OFF THE PACIFIC:
January 25, 2017, 2018
11:00 am INT RSSMC BG: 46.0 CPM^^
10:45 am INT RSSMC LIGHT RAIN SAMPLE: 53.3 CPM^^ or normal background
LOS ANGELES AREA RAINS REGISTER NORMAL BACKGROUND
January 9, 2017, 2018
7:00 pm INT RSSMC RAIN SAMPLE: 41.9 CPM^^ or normal background
6:45 pm INT RSSMC BG: 40.8 CPM^^
January 8, 2017, 2018
4:35 pm INT RSSMC RAIN SAMPLE: 42.3 CPM^^ or normal background
6:25 pm INT RSSMC BG: 44.7 CPM^^
Yearly Report, Multiple Records Broken! Some of these background increases were not Fukushima related.
Station location
http://sccc.org.au/monitoring/Australian-Map.jpg
This short animation of Northern and Southern Hemisphere air circulation, shows why we can get detections so far south.
2017 was a record breaking year. Contributing factors to this year’s background increases were, Radon from earthquake activity in the Pacific, the Sun going into a quiet period, and from Northern to Southern equatorial air flow break through. These were in addition to the recorded Fukushima increases since 2011. Detailed 2017 monthly reports can be found here, http://sccc.org.au/daily-local-background-radiation-levels-and-advisories-for-2017
1. March 30th saw the highest day average background ever recorded here, at 0.215 uSv/hr.
On March 29th, the day average was 51% above average. On the 30th, the low pressure system left over from cyclone Debbie came through, and the local background 24 hour day average spiked even more. Background peaked at 0.215 uSv/hr which is ~115% above average for this location. Yes, there was a spike in Radon levels on that day,but it wasn’t significant enough to account for this amount of increase in local background.
http://sccc.org.au/wp-content/uploads/2018/01/ThereminoGeiger_2017_03_30_21_51_41.jpg
At the time Cyclone Debbie had turned into a low pressure system but was drawing in tropical air.
https://earth.nullschool.net/#2017/03/30/0600Z/wind/surface/level/orthographic=-201.37,-12.32,495/loc=146.465,4.276
March 30th day average chart.
http://sccc.org.au/wp-content/uploads/2017/03/Caloundra-local-average-background-radiation-levels-March-2017.jpg
March 30th 24 hour 60 chart.
http://sccc.org.au/wp-content/uploads/2017/03/Caloundra-24-hour-chart-300317.jpg
2. February, June, July, August, September and December had the highest recorded background month averages since Fukushima. June water tank filter testing detected mainly Lead-210, the a decay daughter of Radon, and Beryllium-7. Beryllium-7 is created by cosmic ray spallation in the upper atmosphere. Although Pb-210 and Be-7 may have contributed to the background increases the amounts detected where not significant enough to account for this significant increase in local background.
Water tank filter test.
http://sccc.org.au/wp-content/uploads/2017/07/Tank-filter-organic-mater-34-grams-240617-TV-7.2-89849-text.png
3. On the 3rd December 2017 a massive radon spike was detected that reached up to 8 pCi/L. At the time of the event it was very humid but not raining. The local live Radon monitor was in a wooden building with the door, and some windows open. Under these environmental monitoring conditions, this is a very large spike in local Radon levels. The wind direction during the Radon spike was easterly off the Pacific Ocean.
http://sccc.org.au/wp-content/uploads/2018/01/ThereminoGeiger_2017_12_03_21_10_11.png
4. 2017 had the highest year average background level ever recorded here at 27% above the 4 year pre-Fukushima average. Some of the local background increases in October, November, and early December occurred during Easterly air flows. These Easterly air flows brought Radon gas releases to this location from a massive earthquake swarm and volcanic activity that appeared in the New Caledonia, Vanuatu, Soloman Islands and Fiji regions of the Pacific Ocean, at that time.
http://sccc.org.au/wp-content/uploads/2017/12/November-2017-Eastern-Pacific-Earthquake-Swam.png
2007 to 2017 year average background level comparison.
http://sccc.org.au/wp-content/uploads/2015/05/Caloundra-yearly-average-background-radiation-levels.jpg
5. The Monitoring GammaScout Geiger counter alarmed numerous times on the mornings of the 30th and the 31st December. These alarms were for short duration spikes in background, as wind direction changed to a Northern tropical direction. The last time we saw spikes like this was after Fukushima. These where very short duration events, less than 60 seconds, which suggest hot particles were passing through the monitoring Geiger counter environment.
Background spike detected on the 31st December 2017. (Visual observation at the time saw the GammaScout Geiger counter spike at 0.725 uSv/hr.
http://sccc.org.au/wp-content/uploads/2018/01/Caloundra-24-hour-chart-311217.jpg
Background spike detected on the 30th December 2017. (Visual observation at the time saw the GammaScout Geiger counter spike at 0.650 uSv/hr.)
http://sccc.org.au/wp-content/uploads/2018/01/Caloundra-24-hour-chart-301217.jpg
Caloundra December month average, year comparisons.
2017 45% above pre-Fukushima average
2016 36% above pre-Fukushima average
2015 35% above pre-Fukushima average
2014 32% above pre-Fukushima average
2013 36% above pre-Fukushima average
2012 43% above pre-Fukushima average
December day average chart,
http://sccc.org.au/wp-content/uploads/2017/12/Caloundra-local-average-background-radiation-levels-December-2017.jpg
What the bar chart colour codes mean.
http://sccc.org.au/what-does-each-step-in-the-alert-level-colour-code-meanYear and month average local background radiation levels from 2007 to 2017.
http://sccc.org.au/yearly-average-background-radiation-levels
Disclaimer: This is an amateur volunteer run service. Human error can provide incorrect information, and equipment malfunction can produce false readings. Do not rely on, or take action upon information presented on this web site, without further research.
Update… Plant Vogtle Georgia will continue
Dec 21, 2107 12:35 p.m.
“Georgia Power is praising the decision to allow construction of a multibillion-dollar nuclear plant to continue in east Georgia.”
“The PSC agreed Thursday to let construction continue on the two new nuclear reactors, despite massive cost overruns for the multibillion-dollar project.”
“The project has been plagued by delays and spiraling costs, compounded when the main contractor filed for bankruptcy. Westinghouse Electric Co., the U.S. nuclear unit of Japan’s Toshiba Corp., filed for bankruptcy in March.”
article:
https://www.washingtonpost.com/business/the-latest-sierra-club-slams-georgia-nuclear-plant-vote/2017/12/21/bbfe3710-e674-11e7-927a-e72eac1e73b6_story.html
IMO: The cost overruns to humanity cannot be measured.
How many solar panels, windmills, etc… could be built with ‘mutibillions’ of dollars?
Side note: I’m trying to do my part. I bought an all Electric Vehicle, zero emissions. Loving it. (Fiat 500e, used but like new) My old fossil fuel car got about 20 miles to a gallon. At an average cost of $3/gal (currently). I was paying a minimum of $200 in fuel on a monthly basis for a regular commute. Now, my EV charging cost is slightly less than $20 for the entire month. No more smog check, no more oil change, no more radiator/water pump issues, etc… There are less than 10 moving parts to an electric motor compared to over 300 on a gas engine. Maintenance costs are no brainer, no comparison. btw – The term ‘range anxiety’ must have been made up by the oil industry. I wake up every morning with a full tank, so to speak, my house is my gas/charge station. If I really need to drive a couple of hundred miles in a day, I’ll just rent a car with the money I saved commuting with my EV. Driving is fun again, it’s like sailing in the wind. 😉
😐
The fate of America’s only nuclear plant under construction will be decided this coming Thursday.
Plant Vogtle in Georgia.
“This cost estimate is nearly double the company’s original projection, and the timeline is five years behind schedule. The cost of the project for Georgia Power and its co-owners exceeds $20 billion.”
“…a commission made of five elected officials, all Republicans, will vote on whether to permit Georgia Power’s new plan for the project,…”
“In July, South Carolina utilities announced it would cancel a separate plan for two nuclear reactors in the state because of cost overruns after Westinghouse, also the reactor’s designer for that project, went bankrupt.”
The above article says ‘carbon free emissions’ at least 5 times, but not once does it mention the risk to all living things or the deadly costly waste that nobody really knows what to do with.
In my opinion the following word best sums up the Nuclear Industry since day one.
➡ boondoggle
noun
1. work or activity that is wasteful or pointless but gives the appearance of having value.
“writing off the cold fusion phenomenon as a boondoggle best buried in literature”
“a public project of questionable merit that typically involves political patronage and graft.”
“they each drew $600,000 in the final months of the great boondoggle”
verb
1. waste money or time on unnecessary or questionable projects.
Southern Hemisphere November 2017 Background Report. (32% above Average)
Station locations
http://sccc.org.au/monitoring/Australian-Map.jpg
This short animation of Northern and Southern Hemisphere air circulation, shows why we can get detections so far south.
Report
Caloundra November 2017 – The elevated background level increases at the end of November 2017 chart have also coincided with a significant increase in Radon detection in the local atmosphere.
The elevated Radon detections over the last couple of months seems to have been a precursor to the outbreak of a very large earthquake swarm in the Eastern Pacific.
http://sccc.org.au/wp-content/uploads/2017/12/November-2017-Eastern-Pacific-Earthquake-Swam.png
A magnitude 7.0 earthquake at 86km ENE of Tadine, New Caledonia occurred on the 19th November.
The recent Radon increases would have been a contributing factor to the November elevated background levels, but not the only factor.
The third chart down on this page is the local live Radon monitoring chart.
http://sccc.org.au/monitoring/sunshinecoast-monitoring-station.html
Caloundra November month average, year comparisons.
2017 32% above pre-Fukushima average
2016 32% above pre-Fukushima average
2015 37% above pre-Fukushima average
2014 29% above pre-Fukushima average
2013 30% above pre-Fukushima average
2012 31% above pre-Fukushima average
November day average chart,
http://sccc.org.au/wp-content/uploads/2017/11/Caloundra-local-average-background-radiation-levels-November-2017.jpg
What the bar chart colour codes mean.
http://sccc.org.au/what-does-each-step-in-the-alert-level-colour-code-mean
Year and month average local background radiation levels from 2007 to 2017.
http://sccc.org.au/yearly-average-background-radiation-levels
Disclaimer: This is an amateur volunteer run service. Human error can provide incorrect information, and equipment malfunction can produce false readings. Do not rely on, or take action upon information presented here, without further research.
21 November 2017 – Russia confirms ‘extremely high’ radiation levels in toxic cloud
Extracts:
Russian authorities have confirmed reports of a spike in radioactivity in the air over the Ural Mountains.
The Russian Meteorological Service said it recorded the release of Ruthenium-106 in the southern Urals in late September and classified it as “extremely high contamination”.
France’s nuclear safety agency earlier this month said that it recorded radioactivity in the area between the Volga River and the Ural Mountains from a suspected accident involving nuclear fuel or the production of radioactive material.
https://www.newscientist.com/article/2153998-russia-confirms-extremely-high-radiation-levels-in-toxic-cloud/
27th October 2017 – Video shows illegal dumping of toxic liquids at Hanford
Extracts:
Workers at the Hanford Site violated multiple state laws and regulations in August when they dumped thousands of gallons of contaminated water straight into the soil.
Videos and internal records obtained by the KING 5 Investigators document three separate incidents where liquid was dumped from large metal boxes that were marked as containing radioactive materials.
Decades of plutonium production at Hanford left behind significant amounts of radioactive and chemical waste, making it the most contaminated spot in the Western Hemisphere and prompting a decades-long, multi-billion-dollar clean-up effort.
http://www.king5.com/news/local/hanford/video-shows-illegal-dumping-of-toxic-liquids-at-hanford/486466640
Southern Hemisphere October 2017 Background Report. (32% above Average)
Station locations
http://sccc.org.au/monitoring/Australian-Map.jpg
This short animation of Northern and Southern Hemisphere air circulation, shows why we can get detections so far south.
Report
Caloundra October 2017 – The elevated background level increases we are seeing in the October 2017 chart have also coincided with a significant increase in Radon detection in the local atmosphere.
http://sccc.org.au/wp-content/uploads/2014/10/Radon_Info_ENG.pdf
The amount of Radon detected locally has increased significantly since September 2017. In September Radon levels stayed below 0.1 pCi/l for the majority of the month.
http://sccc.org.au/wp-content/uploads/2017/10/ThereminoGeiger_2017_09_16_21_57_37.jpg
At times in October it has reached up into 3 pCi/l.
http://sccc.org.au/wp-content/uploads/2017/11/ThereminoGeiger_2017_10_04_21_39_06.jpg
During this period there was a high pressure system sitting between Australia and New Zealand. It was bringing air flows from the West coast of New Zealand and the Eastern Pacific Ocean, to this location. This suggests the Radon source is from the recent volcanic activity in Northern New Zealand, and earthquake releases in the Eastern Pacific.
http://sccc.org.au/wp-content/uploads/2017/10/Surface-wind-direction-20-10-2017.png
The recent Radon increases would have been a contributing factor to the October elevated background levels, but not the only factor.
Caloundra October month average, year comparisons.
2017 32% above pre-Fukushima average
2016 22% above pre-Fukushima average
2015 12% above pre-Fukushima average
2014 14% above pre-Fukushima average
2013 25% above pre-Fukushima average
2012 19% above pre-Fukushima average
October day average chart,
http://sccc.org.au/wp-content/uploads/2017/10/Caloundra-local-average-background-radiation-levels-October-2017.jpg
Year and month average local background radiation levels from 2007 to 2017.
http://sccc.org.au/yearly-average-background-radiation-levels
Disclaimer: This is an amateur volunteer run service. Human error can provide incorrect information, and equipment malfunction can produce false readings. Do not rely on, or take action upon information presented here, without further research.
There are lots of unanswered questions about the Americium-241 contamination of these banknotes that need answering!
Were the banknotes intentionally contaminated?
They detected a high level of radioactivity on the banknotes.
This suggests the Americium-241 is in a dust form!
“a highly toxic radioactive substance.”
So how did Americium-241 end up on these banknotes?
“This was the first time that banknotes severely contaminated by radioactivity were found at a Shanghai port, the bureau said.”
Important keywords, “banknotes severely contaminated by radioactivity.”
You certainly would want to avoid handling these contaminated banknotes!
Everything that a person touched after handling these banknotes smartphones, clothing, etc., would need to be carefully decontaminated.
CHINA
17th October 2017 – Contaminated Banknotes
Extracts:
The cash triggered an alarm when passing through the radioactivity monitoring system inspection process at Pudong International Airport on October 10. The notes contained a high level of radioactivity. They were being carried in the bag of a male passenger. They were found to contain Americium-241 – a highly toxic radioactive substance, according to the Shanghai Airport Entry-Exit Inspection and Quarantine Bureau. Americium-241 has a half-life of 433 years.
Furthermore, it promotes the formation of cancer cells because of its radioactivity. If cash is contaminated by radioactivity, it poses a serious threat because banknotes are circulated quickly, bureau officials said. It is also difficult to track the source of contamination during circulation and users are usually unaware of the risks, the officials added.
Comment:
Americium-241 is mainly an alpha radiation emitter, and is a significant health risk if ingested or inhaled. Americium-241 is the decay daughter of Plutonium-241. Detecting it on bank notes should be raising alarm bells!
http://hisz.rsoe.hu/alertmap/database/index.php?pageid=event_desc&edis_id=HZ-20171017-60249-CHN
There has been a spike of airborne radioactivity in Europe. Ruthenium-106. The highest amount was found in Austria, at 42 millibequerel per cubic meter. Its comming from the direction of the Ukraine, Lithuania, Belarus area.
EUROPE (Multi country radiation detections)
6th October 2017 – Environment Pollution in MultiCountries
Extract:
German officials say that a spike in radioactivity has been detected in the air in Western and Central Europe but there’s no threat to human health. The Federal Office for Radiation Protection said Thursday that elevated levels of the isotope Ruthenium-106 have been reported in Germany, Italy, Austria, Switzerland and France since Sept. 29.
Spokesman Jan Henrik Lauer told The Associated Press the source of the Ruthenium-106 isn’t known but calculations indicate it may have been released in eastern Europe. Ruthenium-106 is used for radiation therapy to treat eye tumors, and sometimes as a source of energy to power satellites.
http://hisz.rsoe.hu/alertmap/database/index.php?pageid=event_desc&edis_id=ED-20171006-60088-MLC
Southern Hemisphere September 2017 Background Report. (27% above Average)
Station locations
http://sccc.org.au/monitoring/Australian-Map.jpg
This short animation of Northern and Southern Hemisphere air circulation, shows why we can get detections so far south.
Report
Caloundra September 2017 – In the last few months there has been a steady increase in month averages at this location in the Southern Hemisphere. The months have been very dry. The September rainfall total was 15mm and the wettest day was the 23rd, with 13mm. Radon levels have been low, so it did not contribute significantly to the day average increases we have seen through September.
I have been trying to work out why there has been an unseasonal increase in background here in winter, on top of the normal Fukushima increase.
So what created these recent increases?
Here are some theories.
1. There has been more mixing of Northern and Southern hemisphere tropical air flows, allowing more radiation from the Northern hemisphere to enter the Southern Hemisphere.
2. Research is showing that more cosmic rays are now reaching the Earth because the Sun’s heliosphere is decreasing in intensity.
(2017 chart of Cosmic Ray increases.)
https://static1.squarespace.com/static/56530521e4b0c307d59bbe97/t/59512da6c534a573ac254b21/1498493389471/
This is part of a normal Sun cycle that occurs approximately every 420 years.
https://www.vencoreweather.com/blog/2017/6/26/1200-pm-cosmic-rays-continue-to-rise-as-solar-cycle-approaches-next-minimum
Could a significant part of the Winter background uptick here be from increased cosmic radiation and
by-products reaching the earth’s surface?
Cosmic ray muon creation in the upper atmosphere could also be a significant part of this increase.
http://cosmic.lbl.gov/SKliewer/Cosmic_Rays/Muons.htm
If this is the case, we would expect there to be an uptick in background radiation detection by Geiger counters, even at the surface of the Earth.
Most people don’t go to the trouble of collecting day average and month average radiation background levels, using 60 second sampling. My system of data collection will show changes that would be missed by others.
3. The Monitoring Geiger Counter is malfunctioning.
I haven’t been able to find any evidence that this is the case. Ruled out the possibility of dust contamination as the area around monitoring counter was cleaned of dust, plus the Geiger counter was also inspected and cleaned of any dust build up. The background levels have continued to climb, even after the clean.
The GammaScout Geiger counter battery level is still at the normal operating 3.6 volts.
——————
My conclusion at this point is that the increased cosmic ray activity, plus the Fukushima increase, are both contributing to the local background levels we are now seeing.
Caloundra September month average, year comparisons.
2017 27% above pre-Fukushima average
2016 12% above pre-Fukushima average
2015 5% above pre-Fukushima average
2014 5% above pre-Fukushima average
2013 15% above pre-Fukushima average
2012 13% above pre-Fukushima average
September day average chart,
http://sccc.org.au/wp-content/uploads/2017/09/Caloundra-local-average-background-radiation-levels-September-2017.jpg
Year and month average local background radiation levels from 2007 to 2017.
http://sccc.org.au/yearly-average-background-radiation-levels
Disclaimer: This is an amateur volunteer run service. Human error can provide incorrect information, and equipment malfunction can produce false readings. Do not rely on, or take action upon information presented here, without further research.
We’re on the way to Albuquerque, so I looked in on their newspaper this evening to see if anything interesting was happening. The Albuquerque Journal just let everyone know that there was another serious “human error” at Los Alamos National Laboratory:
http://www.abqjournal.com/1067835/report-criticality-event-occurred-at-lanl-plutonium-facility-html
When I think about the founding of Los Alamos National Laboratory in 1942, I shake my head at the arrogance of Robert Oppenheimer and his pals in deciding that the people of the Pueblo tribes in the valleys surrounding the lab simply didn’t matter. The Pueblo people had lived in the region since 1200 B.C. according to archaeologists, but the area’s original residents were deemed expendable in the event of an accident with widespread consequences.
This page should be one of the most visited on the internet. Fukushima is still cooking away, and will only get worse. Much worse? How much worse, we don’t know, since professional liars and poltroons (i.e., Tepco) are managing the cleanup.
Meanwhile, the “muh coal mining job” types are literally boiling the oceans. As the comment below points out, methane emissions are poised to surge. We’re going to need Categories VI, VII, VIII for the megahurricanes that are about to ensue.
But at least our leaders understand the magnitude of the issue. That’s why they take private jets for short trips, and that’s why our president spends his time fretting about whether he’ll get Steph Curry’s autograph. We’re fucked, folks, and I’d like to personally thank Trump voters for being so suicidally dumb.
This is the very definition of “climate change” which is a nice way of saying that humans have toasted the planet. There’s no going back from this as the methane released by not-so-permafrost worldwide will make CO2 emissions look like a mere nuisance in comparison.
Magnitude 6.1 earthquake strikes 200 miles east of Fukushima nuke plant. http://www.independent.co.uk/news/world/asia/japan-earthquake-today-latest-updates-fukushima-damage-tsunami-warning-news-a7958111.html Nevertheless I pray there is no further damage to the site. What an unimaginable disaster this is.
JAPAN
24th August 2017 – Japan’s Tepco gets slapped with new U.S. lawsuit over Fukushima
Extracts:
Tokyo Electric Power Co Holdings said on Thursday it has been hit with another lawsuit filed in a U.S. court seeking $5 billion for compensation over the 2011 Fukushima nuclear disaster, the second filed against the utility in a U.S. court.
The suit filed by 157 individuals is seeking that amount to set up a compensation fund for the costs of medical tests and treatment they say they need after efforts to support the recovery from the world’s worst nuclear disaster since Chernobyl in 1986.
https://www.reuters.com/article/us-tepco-fukushima-lawsuit-idUSKCN1B40TG
EUROPE
6th September 2017 – MEPs to raise alarm on Fukushima food imports
Extract:
The draft resolution, seen by EUobserver, said “there are sufficient reasons to believe that this proposal could lead to an increase in exposure to radioactive contaminated food with a corresponding impact on human health”.
In a briefing which Green MEP Rivasi gave to journalists last July, according to a summary provided by her office, the French politician implied that the proposal on Fukushima was a bargaining chip in the negotiations for the FTA, and called it a “scandal”.
https://euobserver.com/environment/138902
Update to above report,
14th September 2017 – EU parliament opposes bid to reduce testing of Fukushima food imports
Extract:
The European Commission, the EU’s executive arm, wants to reduce the list of foods subject to radiation tests before they can be imported into the bloc, which currently includes rice, mushrooms, fish and other seafood.
A resolution passed by a large majority of MEPs called on the commission to withdraw its proposal, saying it was “very difficult to verify whether the measures proposed are sufficient” to protect European consumers and there was reason to think it “could lead to an increase in exposure to radioactive contaminated food.
https://www.japantimes.co.jp/news/2017/09/14/national/politics-diplomacy/eu-parliament-opposes-bid-reduce-testing-fukushima-food-imports/
Southern Hemisphere August 2017 Background Report. (17% above Average)
Station locations
http://sccc.org.au/monitoring/Australian-Map.jpg
This short animation of Northern and Southern Hemisphere air circulation, shows why we can get detections so far south.
Report
Caloundra August 2017 – Radon levels have been low and would not account for the month average increase. There was only 24 mm of rain for August. Significant day average increases coincided with Eastern Pacific air flows.
Caloundra August month average, year comparisons.
2017 17% above pre-Fukushima average
2016 8% above pre-Fukushima average
2015 5% above pre-Fukushima average
2014 4% above pre-Fukushima average
2013 8% above pre-Fukushima average
2012 9% above pre-Fukushima average
August month day average chart,
http://sccc.org.au/wp-content/uploads/2017/08/Caloundra-local-average-background-radiation-levels-August-2017.jpg
Year and month average local background radiation levels from 2007 to 2017.
http://sccc.org.au/yearly-average-background-radiation-levels
Disclaimer: This is an amateur volunteer run service. Human error can provide incorrect information, and equipment malfunction can produce false readings. Do not rely on, or take action upon information presented here, without further research.
14th largest solar flare ever recorded released from the Sun. Reports suggest it has the potential to damage parts of the electrical grid. So we have this major solar flare occurring at the same time as an unprecedented hurricane.
Great Solar Flare | September 6, 2017
Current Solar Data (from NOAA). At preset there is an X-class flare event, an electron, and proton storm, plus a major disturbance showing on the Magnetometer.
http://www.n3kl.org/sun/noaa.html
International list of real time Radiation monitoring stations can be helpful in tracking radiation events worldwide.
http://sccc.org.au/international-radiation-monitoring-stations
Two nuclear power plants are in the probable path of Hurricane Irma “the largest hurricane ever recorded in the Atlantic Ocean”. Most coastal power plants are “Built to withstand a Category 5 hurricane.” Their owner FPL aka Florida Power & Light is not telling the press in Florida exactly when the plants will be shut down, but the owner’s P.R. man Peter Robbins says the reactors “will be shut down well in advance of the storm making landfall” in Florida.
There is no “Category 6” on the Saffir Simpson Scale to measure hurricanes, but that’s the number being thrown around on hurricane afficionodo chat-websites. We’ll likely get to see how much of a structural cushion for a really big Category 5 was built into these FPL plants.
The first plant the strongest hurricane winds, and perhaps the eye, will reach is the one south of Miami called Turkey Point Nuclear Generating Station. The plant is located in Homestead Florida. You’ll read that it’s on the south side of Biscayne Bay, but realistically the bay is simply a mild curve on the shoreline directly on the Atlantic. The tiny barrier island east of the plant provides no protection from storm surge.
The other nuclear plant in the path of the hurricane is St. Lucie Power Station which is much farther north, on a narrow barrier island right on the Atlantic called Hutchinson Island. Between the ocean and the actual structure containing the reactor is a very narrow beach, about 600′ of mangrove swamp and a normal sized parking lot. I’ve been on that beach and it’s incredibly narrow. If you want to see the plant on a satellite photo type in Port St. Lucie FL which is the nearest town.
From Federal public records available on the internet, dating to 2010 and 2011, it appears that spent fuel rods are stored in casks on site at both of the oceanside plants.
If you want to keep track of what’s going on at these nuclear plants in the storm I’ve found that Alex Harris reporting for the Miami Herald is keeping track of what is going on with them.
The uradmonitor private monitoring system has a number of active stations in Texas. On the opening page it is important to select radiation monitoring from the drop down “Sensor” box at the top left of the screen, or you will be seeing temperature readings instead.
Been keeping an eye on the Texas radiation monitors. As the flooding has increased the number of online local radiation monitoring stations has been decreasing significantly!
International list of real time Radiation monitoring stations can be helpful in tracking radiation events worldwide.
http://sccc.org.au/international-radiation-monitoring-stations
Hurricane Harvey hit the Texas Coast with 130 mile per hour winds, with the eye wall hitting Rockport Texas with winds measured by storm chasers at 150 mph. Rockport is called the “Texas Riviera”. Rockport is the city of many Texans’ fond youthful memories, because of its pristine Blue Wave beach, the most popular in Texas for children safely wading and swimming in Aransas Bay, which is protected from big waves which constantly hit Texas’ barrier islands.
Rockport had both extremely wealthy as well as poor and working class residents, 4 museums, 6 boat harbors, elegant restaurants and many private art galleries, antique stores, and chic boutiques. Unfortunately due to Hurricane Harvey, Rockport and its surrounding Aransas County lost 60% to 70% of its homes, which ranged from trailers and old houses inhabited by the poor to million dollar houses with boat docks for weathy retirees and weekenders from San Antonio and Austin. The State of Texas has bused off to San Antonio the poor people who relocated to a hurricane shelter in a Rockport school, but roughly 40% of the 10,000 person population, plus first responders from out-of-town, remain.
Once Hurricane Harvey left Rockport, it violently thrashed several other communities to the northeast along the Texas Gulf Coast, and caused severely damage to their housing supply: Port Lavaca, Palacios, Matagorda, Bay City, Freeport and Lake Jackson, actually on estuaries of the Gulf of Mexico and the City of Victoria which is inland.
Outside of these Texas Gulf communities are miles and miles of beautiful green farms, marshes and oak woodlands. Now the people remaining there after the hurricane may end up with additional stress caused by allegations that there is a risk of an accident at the 7,000 acre cooling pond/lake for 2 nuclear reactors at the South Texas Project (STP) 80 miles up the Coast from Rockport, north east of Palacios Texas.
On August 29, 2017 the nuclear/public safety group “Beyond Nuclear” sent out a press release [http://www.beyondnuclear.org/home/2017/8/29/groups-call-for-immediate-shutdown-of-south-texas-nuclear-po.html] describing the fact that the nuclear plant is still being operated at full capacity despite the following: The nuclear plant does not have “cooling towers”. Instead the plant is cooled by a 7,000 acre man made lake which sits between the nuclear plant and Matagorda Bay, an estuary of the Gulf of Mexico. Beyond Nuclear explains in their press release the threat of collapse of the earthen walls of that manmade lake because of intense flooding on Texas’ own Colorado River, which is 1.5 miles east of the nuclear plant. The owners and operators of the STP nuclear plant put out a counter-statement to Reuters: https://www.reuters.com/article/us-storm-harvey-arkema-idUSKCN1B92J9
The problem is that the 7,000 acre cooling lake for the nuclear plant is on “private property” behind fences, and no members of the public or the press can get inside to independently verify the stability of the “dirt walls” surrounding the lake.
You can find the South Texas Project nuclear project site by typing the following address into Google Maps: 12090 FM Road 521, Palacios, TX 77465. The reactors are due north of the round-shaped man made lake which is easily findable even when you adjust the scale of the map outwards to take in the surrounding communities.
Beyond Nuclear’s concerns expressed in their press release are based on the intense flooding which is occurring outside and beyond natural river banks on land to the north, almost all the way to Dallas. Most rain which falls on “Central Texas” drains southward through coastal communities and out into the Gulf of Mexico. Thus the worst flooding in a massive storm occurs in coastal areas.
During the 1986 Chernobyl nuclear accident the Soviet government initially evacuated people in an 80.5 kilometer (50 mile) area around the nuclear plant. During the 2011 Fukushima nuclear accident the Japanese government initially evacuated people in a 20 kilometer (12 miles) area around the nuclear plant. During the Three Mile Island nuclear accident (which was far less serious than Chernobyl or Fukushima) the State of Pennyslvania ultimately evacuated people in a 20 mile radius of the nuclear plant. Each government substantially reduced their evacuation zones several months after the accident.
Here’s a chart naming the small cities surrounding the STP nuclear reactors on that manmake lake north east of “Downtown Palacios” on Matagorda Bay of the Gulf of Mexico.
City Name/ Population #/ Distance to STP Reactors
Palacios 4,700 10 miles
Matagorda 36,800 10 miles
Bay City 18,000 15 miles
Port Lavaca 12,400 38 miles
Freeport/Lake Jackson 39,700 40 miles
Victoria 67,800 50 miles
Rockport 10,000 80 miles
Houston Metropolitan 5,628,000 80 miles from Inner Beltway 610
Port Lavaca and its environs and Freeport are the location of 10+ huge, isolated petrochemical plants whose operations are complex and which should not be abandoned during a nuclear emergency evacuation.
The South Texas Project nuclear power plant is owned by NRG Energy (44%), Austin Energy (16%) and CPS Energy (40%) and operated by STP Nuclear Operating Company. A few days ago, STP Nuclear Operating Company put out this hard to read news release, as Hurricane Harvey first entered Houston:
http://www.stpegs.com/storm-information/?view=mobile The news release said the nuclear power plant was still operating at full capacity.
Forbes magazine also published an online article lauding the continued full-tilt operation of the STP nuclear plant’s 2 reactors in the wake of the hurricane, failing to mention the physical condition of the earthen walls of the 7,000 acre man made lake/cooling pond as flood waters on Texas’ Colorado River overflowed their banks 1.5 miles to the east.
Say a prayer for the people of the Central Texas Coast, from Freeport to Rockport, that the earthen walls of that massive round-shaped cooling pond/lake stay intact despite the flood waters around it.
Hurricane Harvey, expected to be a very slow moving Category 3 hurricane, with winds at 120+ mph, is expected to hit the Texas Gulf Coast on 8/25/17 in the late evening. Currently the eye of the storm is expected to hit the coast in Matagorda County. The hurricane winds will be the strongest east of the eye. Wind driven storm surge flood water is expected to be 12 feet high along the coast and a few miles inland.
South Texas Nuclear Generating Station is located in Matagorda County, north east of the city of Palacios, Texas. The nuclear generating station relies on a 7,000 acre circular cooling pond south of the reactors which will be subject to those hurricane force winds. The reactor buildings and control room are said to be built to withstand a Category 5 hurricane. Press releases concerning past hurricanes say that the nuclear plant’s operators shut down 2 hours before a hurricane is scheduled to hit.
Hopefully those emergency plans will work.
40 years later and this NBC News documentary on Nuclear Waste could have been recorded yesterday.
Danger! Radioactive Waste — Full Program
NBC originally aired in 1977 and was produced by Joan Konner.
Nothing has changed!
IMHO: This piece of HISTORY documentary is COMPELLING and clearly spells out the future and shows some of the negligent waste dumping of the past. (I’m guessing currently too, if not the USA then there’s all the others.) The out of control waste issue is building by the minute. The only thing I could compare this issue to, is a snowball in Hell.
🙁 I wish everyone could see this NBC documentary.
It’s a solid piece of evidence that proves they knew the risks. Thank you Joan Konner.
Southern Hemisphere July 2017 Background Report. (17% above Average)
Station locations
http://sccc.org.au/monitoring/Australian-Map.jpg
This short animation of Northern and Southern Hemisphere air circulation, shows why we can get detections so far south.
Report
Caloundra July 2017 – The local background level increase on 7th July coincided with an increased detection of Radon gas in the air. This increase in Radon levels would not account for all of the day average increase. There were no significant rain washout events. The wettest day was the 6th, with 14mmm of rain. What created the significant background increases for June and July this year?
Caloundra July month average, year comparisons.
2017 17% above pre-Fukushima average
2016 8% above pre-Fukushima average
2015 5% above pre-Fukushima average
2014 5% above pre-Fukushima average
2013 5% above pre-Fukushima average
2012 9% above pre-Fukushima average
July month day average chart,
http://sccc.org.au/wp-content/uploads/2017/07/Caloundra-local-average-background-radiation-levels-July-2017.jpg
Year and month average local background radiation levels from 2007 to 2017.
http://sccc.org.au/yearly-average-background-radiation-levels
Disclaimer: This is an amateur volunteer run service. Human error can provide incorrect information, and equipment malfunction can produce false readings. Do not rely on, or take action upon information presented here, without further research.
From Radiation Station Stats
Midwest’s Upper and Lower Michigan peninsula’s and eastern Wisconsin, except for one elevated rain, test normal for radiation throughout July 2017 as does the food and drink as reported in Eat Me!
Default Pacific USA time zone unless otherwise indicated
July 27, 2017
8:30 pm EDST INT Southwest Michigan 1st floor room: 37.2 CPM^
July 24, 2017
8:20 pm EDST INT 4TH STORY ROOM PETOSKY MI: 30.0 CPM^
July 24, 2017
2:00 pm EDST EXT FORMER BIG ROCK NUCLEAR PLANT AREA WEST OF PETOSKY MI: ~24 CPM^
July 21, 2017
10:25 pm EDST INT MACKINAW CITY MI 2ND FLOOR ROOM LAKESIDE ABOVE LAKE HURON: 29.2 CPM^
July 20, 2017
8:00 pm EDST INT MUNISING MI 3RD FLOOR ROOM LAKESIDE ABOVE LAKE SUPERIOR: 33.4 CPM^
July 16, 2017
12:16 am EDST INT MANITOWOC WI 3RD FLOOR ROOM RAIN SAMPLE: 81.8 CPM^ OR 55% ABOVE BACKGROUND. WAS NOT RADON DECAY AS ENVIROREPORTER.COM “BETA WATCH” MAP OF U.S. RADON DISTRIBUTION SHOWS.
12:01 am EDST INT MANITOWOC WI 3RD FLOOR ROOM LAKESIDE: 52.9 CPM^
July 14, 2017
NOON EDST INT Southwest Michigan 1st floor room: 35.7 CPM^
July 10, 2017
7:30 pm EDST INT Southwest Michigan 1st floor room: 35.1 CPM^
July 8, 2017
8:00 pm EDST INT Southwest Michigan 1st floor room: 36.1 CPM^
7:55 am CDST INT O’HARE INT AIRPORT: 31.9 CPM^
Southern Hemisphere June 2017 Background Report. (20% above Average)
Station locations
http://sccc.org.au/monitoring/Australian-Map.jpg
This short animation of Northern and Southern Hemisphere air circulation, shows why we can get detections so far south.
Report
Alert Caloundra June 2017
There was a steady increase in background levels in early June, that increased to alert levels towards mid June.
What do the Alert levels here mean?
http://sccc.org.au/what-does-each-step-in-the-alert-level-colour-code-mean
As this event started in early June, the bench area around the monitoring GammaScout Geiger counter was cleaned, and the GammaScout was also cleaned to eliminate the possibility of dust contamination. This has made no difference, as background levels remained higher than usual. This is the Southern Hemisphere winter. Until now, no June pre or post Fukushima background has been higher than 7% above average. We have 10 years of local records to refer to.
It was mostly dry for the month, with only 20mm of rain for the whole month. The local live radon monitor did detect small increases in local Radon levels that coincided with recorded background radiation level increases. These Radon level increases would have been a contributing factor to the background level increase, but not significant enough to be the only factor.
Caloundra June month average, year comparisons.
2017 20% above pre-Fukushima average
2016 7% above pre-Fukushima average
2015 3% above pre-Fukushima average
2014 7% above pre-Fukushima average
2013 7% above pre-Fukushima average
2012 3% above pre-Fukushima average
June month day average chart,
http://sccc.org.au/wp-content/uploads/2017/06/Caloundra-local-average-background-radiation-levels-June-2017.jpg
The June 2017 Cairns Caloundra comparison chart, shows that Cairns did not experience the background swings that Caloundra did.
http://technologypals.com.au/wp-content/uploads/2017/07/Cairns-Caloundra-comparison-for-June-2017.jpg
2017 month day average chart so far,
http://sccc.org.au/wp-content/uploads/2017/02/Local-daily-background-radiation-monthly-averages-2017.jpg
Year and month average local background radiation levels from 2007 to 2017.
http://sccc.org.au/yearly-average-background-radiation-levels
Water Tank Filter Test
Here is a test of 34 grams of organic material caught in a local water tank inlet filter.
http://sccc.org.au/wp-content/uploads/2017/07/Tank-filter-organic-mater-34-grams-240617-TV-7.2-89849-text.png
The main isotopes detected were Beryllium Be-7 and Lead Pb-210. Beryllium Be-7 can be created naturally in trace amounts by spallation in the upper atmosphere by cosmic rays. Lead Pb-210 is the decay daughter of naturally occurring Radon-222 decay.
The scintillator device used for testing loses sensitivity with increasing isotope energy (keV). Taking the difference in sensitivity into account, the Be-7 peak is around 14 times higher than than the chart indicates. The Pb-210 would be around twice as high as show on the chart.
That is a lot of Be-7 in 34 grams of material. Would the levels of Pb-210 and Be-7 detected in the organic material collected from the water tank filter be sufficient to explain the significantly elevated local background levels here in June?
My Theory
There must have been a significant amount of cosmic ray spallation happening in the upper atmosphere recently, to produce this much Be-7.
The sun is becoming far less radiant. The sun is going into one of it’s quiet periods. These occur approximately every four hundred years. Less radiance means the sun’s heliosphere is much weaker. The sun’s heliosphere acts as a shield, protecting the Earth from in coming cosmic rays. A much weaker heliosphere means more cosmic rays strike the upper atmosphere, which results in more atmospheric spallation, hence more Be-7 is detected in the water tank filter test.
I notice that when the elevated detections occurred in June, the wind was mostly coming from an easterly direction, off the Pacific Ocean. This suggests that volcanic and earthquake releases of naturally occurring Radon-222 into the atmosphere, was also a contributing factor.
Disclaimer: This is an amateur volunteer run service. Human error can provide incorrect information, and equipment malfunction can produce false readings. Do not rely on, or take action upon information presented here, without further research.
The detection of cesium-137 from the primary Fukushima Pacific ocean plume has been measured and is increasing.
“The coastal average concentration of cesium-137 is now at 2.7 Bq per m3 according to data from samples collected in October through December 2016 which are now available. The highest concentrations were sampled from Winter Harbour in December which, at 4 Bq per m3 is our second highest measured activity to date, after the initial detection back in February 2015.”
➡ Cesium-137 will be hazardous to life for over 300 years!
I am sure, if there’s cesium, there’s a lot of OTHER kinds of radioactive contamination too. The media and the Nuclear Industry don’t seem to talk about that much, if ever.
Combine these tests/readings and the dust test readings consistently done by EnviroReporter.com along with other readings from user vital1 that also show increases or consistency over time. This tells me the contamination is indeed, obviously, global and continuing.
Long term projections or discussions for what the Fukushima TRIPLE MELTDOWN is ‘really’ going to do to us all, just don’t seem to happen and if they did, would people read them or believe them. (?)
Four workers exposed to high levels of plutonium powder inhalation at Ibaraki nuclear facility.
http://www.japantimes.co.jp/news/2017/06/07/national/five-workers-exposed-radioactive-materials-ibaraki-nuclear-facility/#.WTn8vmjyvcs
This accident shows the potential risk faced by nuclear workers everywhere. It appears at least two failures occurred to expose the workers to inhalation of long half-life alpha emitters. First, a torn plastic bag containing powdered plutonium, and second, the failure of filtration masks to stop the powdered plutonium from reaching the workers lungs. Whether due to faulty masks, or seepage around the seal of the masks on the face, the consequences for these workers are dire.
Long half-life emitters, once released into the environment are a long term risk for anyone coming in contact with them. If the medicines used to help expel the radioactive particles fail to substantially reduce the contaminate load in the workers lungs, they will be looking at a significantly elevated risk of cancers for the remainder of their. lives. Even people nearby them will experience elevated risk if exposed to radioactive particles shed from lungs. Hopefully, there will be a medical intervention that can clear the bulk of the contamination from their bodies. I wish these workers and their families well. It is a tragic accident and hopefully they will be able to receive treatment to save their lives.
Certainly, procedures to reduce the risk of future accidents of this type need to be developed.
JAPAN
6th June 2017 – Seven more Fukushima residents diagnosed with thyroid cancer
Extracts:
Seven more Fukushima Prefecture residents who were aged 18 or under at the time of the 2011 nuclear accident have been found to have thyroid cancer, the prefectural government said Monday.
The number of Fukushima residents suffering from thyroid cancer now totals 152, the prefectural government said in a meeting of an expert panel.
Comment:
In the light of all the overwhelming evidence, just deny the facts! The comment by the official is laughable.
http://www.japantimes.co.jp/news/2017/06/06/national/seven-fukushima-residents-diagnosed-thyroid-cancer/
Southern Hemisphere May 2017 Background Report. (7% above Average)
Station locations
http://sccc.org.au/monitoring/Australian-Map.jpg
This short animation of Northern and Southern Hemisphere air circulation, shows why we can get detections so far south.
Reports
Cairns May 2017 Report – “Glad to see, it was all pretty flat again.”
http://sccc.org.au/wp-content/uploads/2017/06/Cairns-Caloundra-comparison-for-May-2017.jpg
Caloundra May 2017 – May was another quiet month, with mainly Southern Ocean air flows reaching this location.
Month day average,
http://sccc.org.au/wp-content/uploads/2017/05/Caloundra-local-average-background-radiation-levels-May-2017.jpg
Caloundra May month average year comparisons.
2017 7% above pre-Fukushima average
2016 20% above pre-Fukushima average
2015 4% above pre-Fukushima average
2014 13% above pre-Fukushima average
2013 7% above pre-Fukushima average
2012 7% above pre-Fukushima average
Year and month average local background radiation levels from 2007 to 2017.
http://sccc.org.au/yearly-average-background-radiation-levels
Disclaimer: This is an amateur volunteer run service. Human error can provide incorrect information, and equipment malfunction can produce false readings. Do not rely on, or take action upon information presented here, without further research.
Nukpro’s Shelter-in-Place in a Radiation Emergency, or just any old Run of the Mill emergency.
If you print it out you can use the check list provided. It also has a notes section with links to free resources to enable you to do more research on the subject.
http://sccc.org.au/wp-content/uploads/2017/05/Nukepro-Shelter-In-Place.pdf
Southern Hemisphere April 2017 Background Report. (10% above Average)
Station location
http://sccc.org.au/monitoring/Australian-Map.jpg
This short animation of Northern and Southern Hemisphere air circulation, shows why we can get detections so far south.
Reports
Cairns April 2017 Report – “Fairly flat, no major events.”
http://sccc.org.au/wp-content/uploads/2017/05/Cairns-Caloundra-comparison-for-April-2017.jpg
Caloundra April 2017 – This April saw a lot more Southern Ocean air flows reach this location. As we have seen numerous times, Southern Ocean air flows cause a drop in local temperature, and radiation levels.
Month day average,
http://sccc.org.au/wp-content/uploads/2017/04/Caloundra-local-average-background-radiation-levels-April-2017.jpg
Caloundra April month average year comparisons.
2017 10% above pre-Fukushima average
2016 33% above pre-Fukushima average
2015 8% above pre-Fukushima average
2014 22% above pre-Fukushima average
2013 9% above pre-Fukushima average
2012 12% above pre-Fukushima average
Year and month average local background radiation levels
http://sccc.org.au/yearly-average-background-radiation-levels
Disclaimer: This is an amateur volunteer run service. Human error can provide incorrect information, and equipment malfunction can produce false readings. Do not rely on, or take action upon information presented here, without further research.
5/15/2017
East Los Angeles, CA external background at 9:26 pm
9 uR/h (microroengens)
USA
9th May 2017 – “Emergency Alert” Declared At Nuclear Facility In Washington; Evacuation Ordered, No-Fly Zone In Place
Extracts:
As Breaking911 reports, some workers were being evacuated while others were advised to shelter-in-place. The Hanford Fire Department is on scene and updates will be posted as they are available. Workers in the vicinity are still being sheltered as a precaution.
Actions taken to protect site employees include:
Facility personnel have been evacuated
As a precaution, workers in potentially affected areas of the Hanford Site have gone indoors
Access to the 200 East Area of the Hanford Site, which is located in the center of the Hanford Site, has been restricted to protect employees
http://www.zerohedge.com/news/2017-05-09/emergency-alert-declared-hanford-nuclear-facility-washington-evacuation-ordered
USA
3rd May 2017 – Nuclear Reactor Wastewater Will End Up In Your Drinking Water
Extracts:
The council voted four to two in favor of the decision to process 70,000 gallons of nuclear reactor wastewater in its public sewer system. La Tour voted against the measure.
“Apparently Beaver Lake is so big it doesn’t matter, but it just makes me uneasy to know we are putting our waste in our drinking water supply,” La Tour said.
Comment:
Tritium will be in the nuclear wastewater they intend to dump into the Fayetteville Arkansas community water supply. They have been told it will be safe. Here is a video that reveals independent research on the biological effects of radioactive Tritium. Tritium is something to be very concerned about!
04.12.2011 – Radioactive Berkeley: No Safe Dose
Extracts:
The video also expressed a public concern over children visiting the Lawrence Hall of Science to exposure to tritium emissions from the Lawrence Berkeley National Laboratory’s (LBNL) National Tritium Labeling Facility.
http://www.youtube.com/watch?v=wf4G0NRBfqY
Article:
http://www.nwahomepage.com/news/nuclear-reactor-wastewater-will-end-up-in-your-drinking-water/706080335
Are the source of these background increases from the Namie forest fires in Japan?
Japanese radiation monitoring stations indicating background increases in the last 24 hours.
There are small spikes in radiation levels showing up on the Japanese ATMC monitoring network. Start with the Kitaibaraki and Takahagi monitoring stations South of Fukushima, and work your way down the East coast of Japan. Some Eastern in land stations are also showing a spike in background levels.
http://new.atmc.jp/#p=083792bfd72c8a9071
The spikes are also showing up on the ATMC Tokyo monitors. When I looked last night, Australian time, the Nuclear Emergency Tracking Centre Tokyo monitors were also showing a background increase.
If you click the Animate button at the left bottom of the Nuclear Emergency Tracking Centre map, you will see the 24 hr background level increases reflected in the number of stations showing elevated levels over a 24 hour period.
Since yesterday, the wind direction has changed to a northerly direction, so in the animation you see the elevated levels moving from the southern stations to the northern stations on the NETC animation map.
Nuclear Emergency Tracking Centre
http://netc.com/
Present Wind Direction
https://www.windy.com/?2017-05-05-00,40.581,151.128,5
JAPAN
30th April 2017 – Fukushima authorities ask troops to help deal with forest fires near crippled nuclear power plant
Extracts:
Fukushima prefecture has asked the Japanese Self-Defense Forces for help in handling forest fires that have swept areas near the crippled Fukushima power plant, local media report. Strong winds are hindering the firefighting efforts, however.
The forest fires broke out near the town of Namie, some seven kilometers from the disabled Fukushima Daiichi Nuclear Power Plant, on Saturday evening, Japanese NHK broadcaster reported.
Comment:
There is no mention in this article of the potential for the re-dispersal of radioactive contamination downwind, by the fire and strong winds. Anyone downwind should be closely monitoring the situation!
The present wind direction indicates potential contamination could blow South East and then inland.
https://www.windy.com/?38.307,142.603,6
List of International Radiation Monitoring Stations
http://sccc.org.au/international-radiation-monitoring-stations
Article:
https://www.rt.com/news/386662-fukushima-forest-fires-soldiers/
Our gift to the Planet Saturn. Plutonium!
Cassini–Huygens is an unmanned spacecraft sent to the planet Saturn.
(with 73 lb – of plutonium-238 and some cameras)
➡
“Had there been any malfunction causing the Cassini space probe to collide with the Earth, NASA’s complete environmental impact study estimated that, in the worst case (with an acute angle of entry in which Cassini would gradually burn up), a significant fraction of the 33 kg[26] of plutonium-238 inside the RTGs would have been dispersed into the Earth’s atmosphere so that up to five billion people (i.e. almost the entire terrestrial population) could have been exposed, causing up to an estimated 5,000 additional cancer deaths[40] (0.0005 per cent, i.e. a fraction 0.000005, of a billion cancer deaths expected anyway from other causes; the product is incorrectly calculated elsewhere[41] as 500,000 deaths), but the chance of that happening were less than one in one million.”
https://en.wikipedia.org/wiki/Cassini%E2%80%93Huygens#Plutonium_power_source
I wonder who makes the final decision to GAMBLE with literally everything and on behalf of what?
I know I certainly didn’t get to vote on it. 😉
Plutonium-238 is a very powerful alpha emitter.
Plutonium-238 has a decay rate, half-life of 87.7 years.
“On December 22, 2015, the Oak Ridge National Laboratory reported that its researchers had successfully produced 50 grams (1.8 ounces) of Pu-238.”
“After an analysis of this sample, production of 300 to 400 grams (11 to 14 oz) of the material per year is planned to begin and then, through automation and scale-up processes, production will increase to an average of 1.5 kilograms (3.3 lb) per year.”
https://en.wikipedia.org/wiki/Plutonium-238#U.S._production_ceases_and_resumes
On the state of Civil Defense and the re-emerging threat of nuclear war.
Writing about the unthinkable. Most would choose to ignore, even ridicule the thoughts. It may help a few readers, so I offer the following.
The potential for a rogue state / North Korea confrontation is greater now than ever. Preparedness is thought of as unfashionable, and the general state of denial of actual danger creates even more danger.
Everyone will do precisely the wrong thing in reacting to an attack. There will be no warnings issued, most countermeasures will fail, people will leave safe locations for unsafe ones. That mushroom cloud in the distance? Their first thought will be… “What a great selfie this will make!” Don’t forget your SPF 1,000,000 sunblock kids.
No Civil Defense shelters (except for the elites). No stockpiles of food, water, or radiation detectors. No drills for where to go, what to do, and for how long. Answers: Stay inside, away from windows, preferably underground for at least two weeks, breathe filtered air, drink emergency stocks of water, eat canned goods, keep fallout out. If you must be briefly outdoors, don Tyvek outer clothing then rinse off, strip off, and crawl back underground. And, get used to the dark when the batteries run out.
That’s why I’ve been working on my bucket list. Everyday I savor the (mostly) blue skies, fresh air, and a walk in the woods. I’ve updated my emergency supplies, and water stores. Plenty of plastic tarps and duct tape for sealing windows and doors.
I know I’m an amateur, not a real Prepper. And no one thinks “it” will ever really happen. At times, I feel it is ridiculous to even try to be prepared. But, at least I’ve thought about it, and I won’t make the mistake of rushing towards the windows to see what is happening when the flash goes off.
I knew someone who survived a nuclear attack. She was just one kilometer from the hypocenter of the blast.. Sheltering underground, she, and others, waited only a few hours before leaving the shelter. They walked around in the fallout, helping survivors for several weeks. Amazingly, just 15 years old, she survived the ordeal and lived to be 80. No special preparation, special clothing, or access to personal emergency stocks of food and water. She survived because she was in the right location at the right time, avoiding the initial blast and radiation. Then she and others eventually moved out away from the immediate area of destruction, and lived to tell about it.
Should we just hope to be one of the fortunate ones, to be sheltered by chance at the right time? Or should we choose to be ready?
International Radiation Monitoring Networks
The world is very tense at present, all the reports are indicating a major war could break out, so it would be a good idea to be prepared. Hopefully common sense will prevail, and conflict will be avoided.
A large number of people were desperate to find radiation monitoring station locations after Fukushima. They found this to be difficult because there was no comprehensive International list, plus some monitoring systems were difficult to find.
This free community resource was created after the Fukushima nuclear catastrophe so people could quickly locate International radiation monitoring stations in the event of a major nuclear event. It is regularly updated.
In the event of a major nuclear disaster or war, this site may become overloaded, so it is suggested that you download the PDF version of this list onto your personal device, laptop, mobile phone etc from this site. This way you can access the International Radiation Monitoring Station list from your personal device. Check this site for future updates to the list and download the latest version. Let people know this free resource is available.
List of International Radiation Monitoring Stations
http://sccc.org.au/international-radiation-monitoring-stations
Wind direction
Wind direction is an important factor in determining where the radiation will go. Under the “Helpful Tools and Services” item at the top of the page, you will find a link to the Nullschool 3D Earth wind map service.
This service allows you to see location wind direction at different heights. You can rotate the map by holding down your mouse on the map, and dragging. If you use your mouse scroll wheel you can zoom the map in and out.
If you click on the “Earth” item at the lower left corner of the Nullschool map page, a menu will pop up, that allows you to select the wind height.
Free Guides
These free guides can also be downloaded from the top of the International list page.
Free Geiger Counter Use Guide
http://technologypals.com.au/wp-content/uploads/2012/03/Using-a-Geiger-Counter-to-test-food-for-Radioactive-Contamination.pdf
Free DIY food testing lab guide
http://sccc.org.au/wp-content/uploads/2012/06/How-to-set-up-a-home-or-community-food-testing-lab-for-radioactive-contamination.pdf
TEPCO’s Timeline ➡
http://www.tepco.co.jp/en/decommissiontraject/index-e.html
IMHO:
Fancy intro.
Still ‘claim’ cold shutdown. (?)
Nice clock.
The future part of the timeline does not extend nearly far enough!
TEPCO’s timeline does not show how many lives will be forever altered because of this insane nuclear debacle either.
Southern Hemisphere March 2017 Background Report.
Station location
http://sccc.org.au/monitoring/Australian-Map.jpg
This short animation of Northern and Southern Hemisphere air circulation, shows why we can get detections so far south.
Report
On Thursday the 30th March 2017, the Sunshine Coast Australia was bracing for a torrential downpour from remnants of ex-Cyclone Debbie. The South East was going into shut down, schools and businesses closed. As the rain fronts came down the east coast of Australia, we saw spikes in local background levels.
On the 29th, the day average was 51% above average. On the 30th when the main weather system, left over from Debbie, came through, the local background 24 hour day average spiked even more. The day average was 0.215 uSv/hr which is ~115% above average for this location!
Day average chart
http://sccc.org.au/wp-content/uploads/2017/03/Caloundra-local-average-background-radiation-levels-March-2017.jpg
What do the chart colour Alert codes mean?
http://sccc.org.au/what-does-each-step-in-the-alert-level-colour-code-mean
24 hour 60 second logging chart
http://sccc.org.au/wp-content/uploads/2017/03/Caloundra-24-hour-chart-300317.jpg
A part of this increase in background radiation level was probably caused by an increased amount of atmospheric Radon gas. More Radon gas is forced out of the ground during heavy rain events. The increase in Radon levels is seen in the live Radon monitoring chart, screen shot below. In my opinion not all this significant increase in background levels on the 30th, can be attributed to an increase in Radon levels.
http://sccc.org.au/wp-content/uploads/2017/03/ThereminoGeiger_2017_03_30_21_51_41.jpg
We had a similar rain event occur here in March 2012. These lows suck moisture in from the tropics and then bring it down the east coast of Australia.
http://www.abc.net.au/news/2017-03-29/cyclone-debbie-big-picture-view-from-space/8396684
The same advisory suggestions for March 2012 apply whenever one of these tropical rain events occur, as they did in 2012.
Report from March 5th 2012
Average background up to 8.30am 0.145uSv/Hr, 24 hr average 0.185 uS/Hr elevated – Advisory Issued
It may be wise to stay out of the rain. I am getting indoor peaks up to 0.63 uS/hr on the Geiger Counter, as this rain event moves through. It suggests it may be radioactively hotter outside. Maybe worth letting your local friends know. If you or a child gets wet in it, have a good shower when you can. I have no idea what isotopes are in the rain, only that my Geiger counter is registering 6x higher than our normal background radiation, in peaks. These peaks are only lasting for a very short period of time.
Month day average,
http://sccc.org.au/wp-content/uploads/2012/04/Caloundra-local-average-background-radiation-levels-March-2012.jpg
24 hour 60 second logging chart
http://sccc.org.au/wp-content/uploads/2012/03/24-hour-background-radiation-chart-05032012.jpg
Caloundra March month average year comparisons.
The March month average data indicates a steady in crease in Southern Hemisphere local background levels has occurred over the years, since Fukushima. If we are getting background increases here in the Southern Hemisphere, it suggests that areas in the Northern Hemisphere would be greater.
2017 38% above pre-Fukushima average
2016 39% above pre-Fukushima average
2015 33% above pre-Fukushima average
2014 31% above pre-Fukushima average
2013 32% above pre-Fukushima average
2012 24% above pre-Fukushima average
Year and month average local background radiation levels
http://sccc.org.au/yearly-average-background-radiation-levels
Disclaimer: This is an amateur volunteer run service. Human error can provide incorrect information, and equipment malfunction can produce false readings. Do not rely on, or take action upon information presented here, without further research.
17th March 2017 – In first, government and Tepco found liable for Fukushima disaster
Extracts:
A court in Japan has ruled for the first time that the government and the operator of the crippled Fukushima No. 1 nuclear power plant were responsible for failing to take preventive measures against the March 11, 2011, quake-triggered tsunami that killed scores and forced tens of thousands from their homes.
The district court ordered the two to pay damages totaling ¥38.55 million to 62 of 137 plaintiffs from 45 households located near the plant, which suffered a triple meltdown caused by the tsunami, awarding ¥70,000 to ¥3.5 million in compensation to each plaintiff.
http://www.japantimes.co.jp/news/2017/03/17/national/crime-legal/first-government-tepco-found-liable-fukushima-disaster/#.WMy4hJTiDtQ
Comment:
The case of the USS Reagan Sailors has draw on for years now. Most Americans are not aware of the injustice these servicemen and women have been subjected to! Some have already pasted away, and others as well as being sick themselves now have sick children. A large number of US military personnel have become seriously ill, after being exposed to Fukushima fallout during the 2011 earthquake relief effort in Japan.
These brave members of the US services should be supported, but there has been a news blackout! Their case has constantly been delayed. Look at how many views the video below has had since July 2015.
21st July 2015 – USS Reagan Sailors Sue for Nuclear Justice
Extract:
Attorney Charles Bonner gives an update on his class action litigation on behalf of military personnel harmed by exposure to Fukushima fallout during an aid mission. The suit targets the plant operator and its manufacturers.
Be aware I’m not an American citizen. I’m Australian.
Six years of ongoing nonstop Nuclear Meltdowns.
When immune systems fail, heart muscles weaken and a doctor informs you that you have two types of rare cancer, then, not a lot else matters. A close relative of mine gave me this news not too long ago. She cried and said she should have listened to me when I advised her not to drink the milk after Fukushima. What do you say to that? I tried to console her with well, maybe it’s from when you lived in Simi Valley in the early 80’s or perhaps the fact you have lived within 2 miles of the Landfill in St. Louis for 20 years. I don’t think that helped much. 🙁
From my personal observation this scenario IS playing out more and more. To a faster and a far greater extent than we may all realize. Perhaps exponentially, but we’ll never know it.
IMHO – The Fukushima’s MELTDOWNS should be treated as an act of war. A war against our planet and the existence of every living thing as we know it. Japan, along with all countries and academics in the world really need to come together and be transparent. Organizing our knowledge base toward survival of this insane nightmare should be priority one.
My simple prediction is that, avoiding radiation, (mitigation), should/will become the rule of the day. Anything less will just be haphazard or foolish.
https://en.wikipedia.org/wiki/Nuclear_fallout#The_Seven_Ten_Rule
What if the FALLOUT is ongoing and accumulating?
… 6 YEARS, with no real plan and no end in site!
Southern Hemisphere February 2017 Background Report.
Station location
http://sccc.org.au/monitoring/Australian-Map.jpg
This short animation of Northern and Southern Hemisphere air circulation, shows why we can get detections so far south.
Report for February 2017. (42% above average)
The Caloundra monthly average charts for February 2012 and 2013 showed wild fluctuations (Charts Below). Now the charts show less volatility, but the average background is higher. This suggests to me that everything is now more evenly mixed in the atmosphere. Even so, background levels have still increased. Interestingly, we had very little rain in February this year, compared to previous years.
Caloundra February month average year comparisons.
2017 42% above pre-Fukushima average
2016 41% above pre-Fukushima average
2015 30% above pre-Fukushima average
2014 40% above pre-Fukushima average
2013 39% above pre-Fukushima average
2012 37% above pre-Fukushima average
February 2017 had the highest recorded February month average background since Fukushima!
Month average chart for February 2017
http://sccc.org.au/wp-content/uploads/2017/02/Caloundra-local-average-background-radiation-levels-February-2017.jpg
Month average chart for February 2013
http://sccc.org.au/wp-content/uploads/2013/02/Caloundra-local-average-background-radiation-levels-February-2013.jpg
Month average chart for February 2012
http://sccc.org.au/wp-content/uploads/2012/04/Caloundra-local-average-background-radiation-levels-February-2012.jpg
Year and month average local background radiation levels
http://sccc.org.au/yearly-average-background-radiation-levels
Disclaimer: This is an amateur volunteer run service. Human error can provide incorrect information, and equipment malfunction can produce false readings. Do not rely on, or take action upon information presented here, without further research.
ALERT. Iodine 131 found in wide areas across Europe. No one knows why or the source of the contamination.
http://www.naturalnews.com/2017-02-22-nuclear-accident-cover-up-radioactive-iodine-131-detected-across-europe-no-one-knows-why.html
EUROPE
13th February 2017 – Iodine 131 just reported by European Agency. Incident happened in January 2017!
Extracts:
As usual, we are warned after the fact.
And of course, the IRSN will carefully avoid telling us who is responsible for this pollution. Iodine-131, a radionuclide of artificial origin, was detected in January 2017 as traces in air at ground level in Europe.
Comment:
The largest detection seems to have been in Poland, from the 9th to the 16th of January 2017.
MALAYSIA
14th February 2016 – Stolen radioactive material found in Malaysian apartment building
Extracts:
Iridium-192, a substance which can potentially be used in a dirty bomb, has been found at a Malaysian apartment complex prompting fears that residents there may have been exposed to the hazardous material.
South Klang district police said residents needed urgent health checks after two stolen radioactive canisters were found with their seals broken, exposing people to the dangerous substance.
Humans are capable of receiving 20 millisieverts of gamma rays a year, however, these canisters had the gamma ray capacity of up to 300 millisieverts per hour, according to the ALEB.
Comment:
Worldwide, the theft of highly radioactive material happens much more frequently than the general public are aware off.
https://www.rt.com/news/377355-stolen-radioactive-material-malaysia/
JAPAN
3rd February 2017 – Record radiation level detected inside damaged Fukushima reactor
Extracts:
TOKYO —
A record radiation level has been detected inside the No. 2 reactor at the damaged Fukushima Daiichi nuclear complex, with the estimated reading of up to 530 sieverts per hour, the plant operator said Thursday.
The new radiation level, described by some experts as “unimaginable,” far exceeds 73 sieverts per hour, the previously highest radiation reading monitored in the interior of the reactor.
An official of the National Institute of Radiological Sciences said medical professionals have never considered dealing with this level of radiation in their work.
Comment:
We don’t have the technology available to deal with these extremely high radiation levels! Neither man nor machine can withstand these levels of radiation. It has been nearly six years now, and the buildings are structurally deteriorating, and are located in an earthquake zone, another disaster waiting to happen!
https://www.japantoday.com/category/national/view/record-radiation-level-detected-inside-damaged-fukushima-reactor
Southern Hemisphere January 2017 Background Report.
Station location
http://sccc.org.au/monitoring/Australian-Map.jpg
This short animation of Northern and Southern Hemisphere air circulation, shows why we can get detections so far south.
Caloundra day average chart for January 2017. (42% above average)
http://sccc.org.au/wp-content/uploads/2017/01/Caloundra-local-average-background-radiation-levels-January-2017.jpg
Caloundra January month average year comparisons.
2017 42% above pre-Fukushima average
2016 41% above pre-Fukushima average
2015 40% above pre-Fukushima average
2014 41% above pre-Fukushima average
2013 52% above pre-Fukushima average
2012 43% above pre-Fukushima average
Report:
January 2017 saw the usual post Fukushima, seasonal increase in background level, as warmer air flows from the tropics reach this location.
Year and month average local background radiation levels
http://sccc.org.au/yearly-average-background-radiation-levels
Disclaimer: This is an amateur volunteer run service. Human error can provide incorrect information, and equipment malfunction can produce false readings. Do not rely on, or take action upon information presented here, without further research.
From our friend and environmental activist Gene Stone of Residents Organized For a Safe Environment (ROSE) which was instrumental in the shuttering of the San Onofre Nuclear Generating Station (SONGS):
My dear Environmental and politically concerned friends,
An action alert for your consideration. As a member of the resistance to trump’s fascist and racist coup of our government I would like to suggest we make a concerted effort to let corporations and their CEOs know that we will not tolerate their support of trump’s attack on our environment or women’s rights/human rights, civil rights or our freedom of religion and that means any religion. We also stand with our native brothers and sisters at Standing Rock and in solidarity of native Sovereign lands. If they expect us to buy their products we expect them to support these rights.
Everytime I see a senator or representative (state or federal) make a tweet, I Tweet back to them and suggest strongly if they want my support in 2018 they will stand strong with the people against the trump agenda. I am also doing this whenever I see a tweet from any Corporation and let them know that if they expect me to spend my shopping dollars with them that I will not do business with companies or corporations that support his fascist agenda. My wife and I started by calling L.L.Bean and letting them know that we would never buy from them again. They had gotten quite a number of calls and tried desperately to let us know they wanted our business. We told them we wanted their support for freedom. We have been using all types of social media, emails and the telephone. After seeing on the news how many of the large corporations acquiesced immediately when they thought their bottom line would be affected, I believe this to be a sound and important strategy and defense of Human Rights and the rights of the people to demand the government work for us and not the corporations.
“Once or twice in every generation a line is crossed so egregiously that where you stood on the issue will forever define you.” Kara Vallow
If you agree with this action please share it with your list and Friends, thank you for your time.
Sincerely,
Gene Stone
Residents Organized For a Safe Environment (ROSE)
949-XXX-XXXX, On twitter @gene_stone
http://residentsorganizedforasafeenvironment.wordpress.com/
http://partofthearth.blogspot.com/
Southern Hemisphere Year Background Report For 2016.
Station location
http://sccc.org.au/monitoring/Australian-Map.jpg
This short animation of Northern and Southern Hemisphere air circulation, shows why we can get detections so far south.
Caloundra day average chart for December 2016. (36% above average)
http://sccc.org.au/wp-content/uploads/2016/12/Caloundra-local-average-background-radiation-levels-December-2016.jpg
Caloundra December month average year comparisons.
2016 36% above pre-Fukushima average
2015 35% above pre-Fukushima average
2014 32% above pre-Fukushima average
2013 36% above pre-Fukushima average
2012 43% above pre-Fukushima average
Report:
Even thought December 2016 had a lower December month average background compared to December 2012, the 2016 year average background level was the highest recorded here since Fukushima. The 2016 year average was 25% above pre-Fukushima recorded year average. At this Southern Hemisphere location, the local year average background has seen an increase in local background levels since Fukushima (see chart below). If we are seeing a steady increase in year averages here in the Southern Hemisphere, it suggests that locations in the Northern Hemisphere are seeing much greater yearly increases.
http://sccc.org.au/wp-content/uploads/2015/05/Caloundra-yearly-average-background-radiation-levels.jpg
Year and month average local background radiation levels
http://sccc.org.au/yearly-average-background-radiation-levels
Disclaimer: This is an amateur volunteer run service. Human error can provide incorrect information, and equipment malfunction can produce false readings. Do not rely on, or take action upon information presented here, without further research.
JAPAN
23rd December 2016 – Fuel removal at Fukushima reactor again faces delay
Extracts:
But the clearing work took longer than expected due to contamination being more widespread than previously thought, forcing TEPCO and the government to again put off the retrieval.
Radiation levels have now dropped as almost all of wreckage at the site has been cleared, TEPCO said. The government and TEPCO have said fuel retrieval at the No. 1 and No. 2 reactor buildings will start in fiscal 2020 or later.
http://www.asahi.com/ajw/articles/AJ201612230043.html
Southern Hemisphere Background Report For November 2016. (32% above average)
Station location
http://sccc.org.au/monitoring/Australian-Map.jpg
This short animation of Northern and Southern Hemisphere air circulation shows why we can get detections so far south.
Caloundra day average chart for November 2016
http://sccc.org.au/wp-content/uploads/2016/11/Caloundra-local-average-background-radiation-levels-November-2016.jpg
Caloundra November month average year comparisons.
2016 32% above pre-Fukushima average
2015 37% above pre-Fukushima average
2014 29% above pre-Fukushima average
2013 30% above pre-Fukushima average
2012 31% above pre-Fukushima average
Report:
November 2016 had the the second highest month average local background since Fukushima. At the beginning of the month warm tropical air flows reached this location, this created the initial spike in local background levels. Background levels dropped for the rest of the month, as more Southern air flows reached this location, from the Southern Ocean.
Yearly average background radiation levels
http://sccc.org.au/yearly-average-background-radiation-levels
Disclaimer: This is an amateur volunteer run service. Human error can provide incorrect information, and equipment malfunction can produce false readings. Do not rely on, or take action upon information presented here, without further research.
JAPAN
11th December 2016 – Mutated Blood Found In Humans In Japan — From Fukushima Radiation
Extract:
New blood types called Langereis and Junior, to distinguish them from traditional classifications. According to scientists, this phenomenon is associated with the leakage of radioactive substances resulting from the nuclear accident in Fukushima.
According to doctors, is to be expected in the near future to see additional changes. What scientists are saying in the future there will be at least another 15 new blood groups.
https://nukeprofessional.blogspot.com.au/2016/12/mutated-blood-found-in-humans-in-japan.html
[Editor: We sourced this back to CCTV which gives no sources of its own other than “scientists” therefore this is not confirmed by EnviroReporter.com and is speculative.]
@ Another Simi Mom
“If you believe this news story I’ve got a bridge to sell you:”
Correct, just posted this report into “Radiation Food Lab.”
8th December 2016 – Tokyo increases Fukushima operator’s interest-free loan limit to $123bn
Extracts:
The extra 5 trillion yen ($44 billion) loan on top of the original 9 trillion yen ($79 billion) is destined to cover the costs of compensation and decontaminating areas around the plant, a source familiar with the matter told Reuters.
The government plans to have TEPCO and other utilities pay back the loans, Japan’s NHK World reported, as part of the cost will pass to consumers through higher electricity rates.
Last month the Ministry of Economy, Trade and Industry said that the combined costs of paying compensation for the Fukushima nuclear disaster and the decommissioning of the plant will almost double the initial estimate and will cost over 20 trillion yen ($176 billion).
Comment:
The Fukushima Nuclear Catastrophe cleanup costs just keep skyrocketing, with no end in sight!
https://www.rt.com/news/369574-japan-tepco-loan-ceiling/
If you believe this news story I’ve got a bridge to sell you:
http://www.asahi.com/ajw/articles/AJ201612060039.html
24 November 2016 – Missing Bushehr Radioactive Device Raises Concerns
Extracts:
Tamimi told Asharq Al-Awsat newspaper that, along with the International Atomic Energy Agency (IAEA), there are concerns of negative impact of the Iranian nuclear program that could pollute the waters of the Arabian Gulf.
The chairman said most Gulf countries depend on the desalination of sea water and the matter is very critical especially if the contamination reaches desalination stations.
Comment:
The device went missing after the vehicle transporting it was stolen. How many times have I heard this same story over the years? So much for the nuclear industry’s radioactive material safety claim.
http://english.aawsat.com/2016/11/article55362750/missing-bushehr-radioactive-device-raises-concerns
Here’s some live video in real time of the latest earthquake off the coast of Fukushima. The shaking lasted for at least 90 seconds.
EQ vids:
http://caferadlab.com/thread-1549-post-3053.html#pid3053
Screenshot of Unit 3 belching heavy pink emissions in the hours following the quakes.
http://caferadlab.com/attachment.php?aid=925
I’ve seen several news reports about the quake and it’s stated that all is okay and of no concern at the Nuclear Plants in Japan. I would disagree.
My question to ALL is where does the ‘fake’ news get separated from the so called real news and who gets to make that decision? Is leaving out important information just as improper?
(referring to Mark Zuckerberg talking about controlling fake news on Facebook.)
http://www.today.com/video/mark-zuckerberg-details-facebook-s-new-plans-amid-fake-news-concerns-813545027735
EPA proposing massive allowable increase in radiological contamination of our drinking water. Please oppose this now!
Click on Take Action tab. Thanks.
21st November 2016 – Fukushima reactor cooling system stops following quake & tsunami
Extract:
The cooling system of the third reactor at the Fukushima nuclear power plant has stopped circulating water following a powerful 7.3 offshore earthquake. TEPCO said it managed to restart the system some 90 minutes after the failure.
https://www.rt.com/news/367714-fukushima-reactor-cooling-earthquake/
Magnitude 7.3 earthquake off Fukushima Japan today. Tsunami warning issued.
http://www.telegraph.co.uk/news/2016/11/21/japan-earthquake-73-magnitude-earthquake-strikes-fukushima/
(Video) 16th November 2016 – Giant radiation shield built to cap Chernobyl’s damaged nuclear reactor
Extract:
A giant radiation shield is being manoevered over the site of the world’s worst nuclear accident in Chernobyl, Ukraine, in the final phase of a €1.5 billion (US$1.6bn) project to prevent the leaking of further radioactive material from the damaged reactor.
Comment:
Look at the size of this structure that they are moving into place, it is 350 feet tall and more than 530 feet long. This very expensive temporary cover will also need to be replaced in a 100 years!
Video of structure being moved
https://www.rt.com/in-motion/367148-giant-radiation-shield-chernobyl/
Wikipedia extract:
The total cost of the Shelter Implementation Plan, of which the New Safe Confinement is the most prominent element, is estimated to be around €2.15 billion (US$3.09 billion).
https://en.wikipedia.org/wiki/Chernobyl_New_Safe_Confinement
Southern Hemisphere Background Report For October 2016. (22% above average)
Station location
http://sccc.org.au/monitoring/Australian-Map.jpg
This short animation of Northern and Southern Hemisphere air circulation shows why we can get detections so far south.
Caloundra day average chart for October 2016
http://sccc.org.au/wp-content/uploads/2012/03/Caloundra-local-average-background-radiation-levels-October-2016.jpg
Caloundra October month average year comparisons.
2016 22% above pre-Fukushima average
2015 12% above pre-Fukushima average
2014 14% above pre-Fukushima average
2013 25% above pre-Fukushima average
2012 19% above pre-Fukushima average
Report:
There has been another up tick in background levels at this location for October 2016. This is the second highest October month average since the Fukushima nuclear catastrophe.
At this location in the winter months, air flows tend to come from the Southern Ocean, rather than from the tropical North. When this happens, local background levels tend to drop significantly, so compared to the summer months, winter local background levels approach pre-Fukushima levels. You can clearly see this seasonal variation in the yearly average background report, link below.
Yearly average background radiation levels
http://sccc.org.au/yearly-average-background-radiation-levels
Disclaimer: This is an amateur volunteer run service. Human error can provide incorrect information, and equipment malfunction can produce false readings. Do not rely on, or take action upon information presented here, without further research.
Mom Lung Cancer, Dad, BLADDER Cancer, Brother, Rectum, large Tumor, sister, female Cancer,
STEP Mother, Cancer, Aunt BLADDER Cancer! Next Door Neighbor Cancer! All these Cancers, people who lived in Simi Valley from 1962-1980’s
Parts of WIPP in New Mexico will never reopen:
https://www.abqjournal.com/868005/part-of-wipp-closing-over-employee-safety-concerns.html
Southern Hemisphere Background Report For September 2016. (12% above average)
Station location
http://sccc.org.au/monitoring/Australian-Map.jpg
This short animation of Northern and Southern Hemisphere air circulation shows why we can get detections so far south.
Caloundra day average chart for September 2016
http://sccc.org.au/wp-content/uploads/2016/09/Caloundra-local-average-background-radiation-levels-September-2016.jpg
Caloundra September month average year comparisons.
2016 12% above pre-Fukushima average
2015 5% above pre-Fukushima average
2014 6% above pre-Fukushima average
2013 15% above pre-Fukushima average
2012 13% above pre-Fukushima average
Report:
There has been a small up tick in background levels at this location for September. September 2013 and 2012 were the only years that had higher background levels here, since the Fukushima nuclear catastrophe.
At this location in the winter months, air flows tend to come from the Southern Ocean, rather than from the tropical North. When this happens, local background levels tend to drop significantly, so compared to the summer months, winter local background levels approach pre-Fukushima levels. You can clearly see this seasonal variation in the yearly average background report, link below.
Yearly average background radiation levels
http://sccc.org.au/yearly-average-background-radiation-levels
Disclaimer: This is an amateur volunteer run service. Human error can provide incorrect information, and equipment malfunction can produce false readings. Do not rely on, or take action upon information presented here, without further research.
@Another Simi Mom @all
Note:
Los Alamos county New Mexico is near the top of highest incomes of any county in the United States.
https://en.wikipedia.org/wiki/List_of_highest-income_counties_in_the_United_States#2010_Census
I guess the health and safety of the people who work and live around Los Alamos is more important than the health and safety of people who live around the Santa Susana Field Lab aka Rocketdyne:
https://www.abqjournal.com/846975/report-details-scope-of-los-alamos-nuclear-waste-cleanup.html
Southern Hemisphere Background Report For August 2016. (8% above average)
Station location
http://sccc.org.au/monitoring/Australian-Map.jpg
This short animation of Northern and Southern Hemisphere air circulation shows why we can get detections so far south.
Roof down pipe filter design for rainwater testing, http://sccc.org.au/down-pipe-filter-design
Caloundra day average chart for August 2016
http://sccc.org.au/wp-content/uploads/2016/08/Caloundra-local-average-background-radiation-levels-August-2016.jpg
Caloundra August month average year comparisons.
2016 8% above pre-Fukushima average
2015 5% above pre-Fukushima average
2014 4% above pre-Fukushima average
2013 8% above pre-Fukushima average
2012 9% above pre-Fukushima average
Report:
At this location in the winter months, air flows tend to come from the Southern Ocean, rather than from the tropical North. When this happens, local background levels tend to drop significantly, so compared to the summer months, winter local background levels approach pre-Fukushima levels. You can clearly see this seasonal variation in the yearly average background report, link below.
Yearly average background radiation levels
http://sccc.org.au/yearly-average-background-radiation-levels
Disclaimer: This is an amateur volunteer run service. Human error can provide incorrect information, and equipment malfunction can produce false readings. Do not rely on, or take action upon information presented here, without further research.
Evidence of HIGH RAD readings at Fukushima.
* 187 uSV microsieverts
https://www.wolframalpha.com/input/?i=187+microsieverts
Inside Fukushima’s Time Bomb (Aug 2016)
https://www.youtube.com/watch?v=LcLo51IZnos
This ‘tour’ of the Fukushima plant was cut short.
Time Distance = Dose
Four inch sheets of lead line the roads, didn’t seem to help.
This video does cover some touchy, usually not mentioned topics. However, it leaves out some important ones too. Such as, how badly the ocean is being contaminated.
Screen Shots: 155 & 187 uSv
http://caferadlab.com/thread-317-post-2233.html#pid2233
It will never be the same. What’s the cost of that? 🙁
JAPAN
28th August 2016 – Public cost of Fukushima nuclear accident cleanup topped ¥4.2 trillion as of end of March
Extracts:
The public cost of dealing with the aftermath of the March 2011 nuclear accident at Tokyo Electric Power Company Holdings Inc.’s stricken Fukushima No. 1 plant topped ¥4.2 trillion by the end of fiscal 2015, it was learned Sunday.
According to the study, a total of ¥2.34 trillion was disbursed for decontamination of affected areas, disposal of contaminated waste and an interim storage facility for tainted soil. The expense was shouldered by the government, mainly through affiliated Nuclear Damage Compensation and Decommissioning Facilitation Corp.
Tepco and six other power utilities charged their customers at least ¥327 billion in electricity rate hikes after Japan’s worst-ever nuclear accident.
Comment:
¥4.2 trillion (around $628 billion) is an astronomical amount of money. This was the clean up cost up to the end of the 2015 fiscal year! What is the total cost now?
A very important point not mentioned in this report is the staggering costs involved in cleaning up the other seriously damaged Japanese nuclear reactors, that have been conveniently forgotten about by the mainstream media!
The Japanese Government admitted in May 2011 that there were a lot more nuclear reactors seriously damaged, not just the 4 at the Fukushima Nuclear disaster site. We have no real information on what has been happening at those other nuclear disaster sites, because of the news blackout.
Quote:
“According to Japan’s Nuclear and Industrial Safety Agency (NISA), the earthquake and subsequent tsunami affected fourteen nuclear reactors at four sites along the eastern coast the Fukushima Daiichi site (six reactors), Fukushima Daini site (four reactors), the Ongawa site (three reactors) and the Tokai site (one reactor). The most serious damage occurred at the Fukushima Daiichi Nuclear Power Station.”
Article:
http://www.japantimes.co.jp/news/2016/08/28/national/public-cost-fukushima-nuclear-accident-cleanup-topped-%C2%A54-2-trillion-end-march/
Photo array from San Ononfre showing where storage units are soon to be built and installed: http://www.ocregister.com/articles/nuclear-727227-fuel-storage.html
I was the fourth child in my family and the only one born in Grand Junction, CO. I was diagnosed with CMT1A. It is a neuro muscular disease. I also have neuropathy. Is there anyone else who has been diagnosed with this disease? No one else in my family has this disease, including my parents. I did not inherit it and I am curious if uranium deposits etc. had anything to do with it.
Linda
Southern Hemisphere Background Report For July 2016. (8% above average)
Station location
http://sccc.org.au/monitoring/Australian-Map.jpg
This short animation of Northern and Southern Hemisphere air circulation, shows why we can get detections so far south.
Roof down pipe filter design for rainwater testing, http://sccc.org.au/down-pipe-filter-design
Caloundra day average chart for July 2016
http://sccc.org.au/wp-content/uploads/2016/07/Caloundra-local-average-background-radiation-levels-July-2016.jpg
Caloundra July month average year comparisons.
2016 8% above pre-Fukushima average
2015 5% above pre-Fukushima average
2014 5% above pre-Fukushima average
2013 6% above pre-Fukushima average
2012 9% above pre-Fukushima average
Report:
At this location in the winter months, air flows tend to come from the Southern Ocean, rather than from the tropical North. When this happens, local background levels tend to drop significantly, so compared to the summer months, winter local background levels approach pre-Fukushima levels. You can clearly see this seasonal variation in the yearly average background report, link below.
Yearly average background radiation levels
http://sccc.org.au/yearly-average-background-radiation-levels
Disclaimer: This is an amateur volunteer run service. Human error can provide incorrect information, and equipment malfunction can produce false readings. Do not rely on, or take action upon information presented here, without further research.
19th July 2016 – San Onofre Nuclear Leak Caused by Pushing Generator Limits, Watchdog Group Says
Extracts:
The cause of a leak in 2012 that led to the permanent shutdown of the San Onofre Nuclear Generating Station was steam generators being deliberately run too hot, too hard and too fast, according to a report released Tuesday by an independent watchdog organization.
“Edison knew they were pushing San Onofre’s steam generators past the original design limit, but did it anyway for the sake of short-term profits and to correct other design deficiencies as a result of SCE’s unverified analytical assumptions,” Arora alleged.
http://patch.com/california/oceanside-camppendleton/san-onofre-nuclear-leak-caused-pushing-generator-limits-watchdog
Alert level detection, with a peak of up to ~ 19 uSv/hr showing on a Romanian Carie private monitoring station on the,
http://www.uradmonitor.com private monitoring network.
Screen Shot:
http://sccc.org.au/wp-content/uploads/2016/07/Romania-Carie-on-uradmonitor-230716-19-uSv-hr.png
Quote from this report:
http://hisz.rsoe.hu/alertmap/database/index.php?pageid=event_desc&edis_id=UEV-20160721-54185-UKR
“MP Andriy Artemenko (Radical Party) has said that on July 16 a serious accident with leakage of nuclear fuel was recorded at Khmelnytsky nuclear power plant (NPP), while the press service of National Nuclear Generating Company Energoatom denied the information.”
The surface wind direction is coming from the Ukraine to this Romanian location at present.
https://earth.nullschool.net/#current/wind/surface/level/orthographic=-334.38,44.44,3000/loc=31.675,48.987
This maybe a coincidence, or a malfunctioning station. It is the only private monitoring station in Romania showing very high peak detections at present. No official Ukrainian background monitoring stations are showing any significant background increase.
Tools you need to keep an eye on this, can be found on the International Radiation Monitoring Station list page,
http://sccc.org.au/international-radiation-monitoring-stations
Non-categorized event in Ukraine on July 21 2016 10:29 AM (UTC).
Extract:
MP Andriy Artemenko (Radical Party) has said that on July 16 a serious accident with leakage of nuclear fuel was recorded at Khmelnytsky nuclear power plant (NPP), while the press service of National Nuclear Generating Company Energoatom denied the information. “I learnt from reliable sources that the government is hiding the seriousness of the accident occurred on July 16 at reactor one of Khmelnytsky NPP with the depressurization of the reactor primary circuit and leakage of radioactive coolant to the nuclear steam generator. In addition, nuclear fuel leaked, which is a critical situation,” he wrote on his Facebook page. He said that on Monday a meeting with participation of Deputy Prime Minister Volodymyr Kistion and Energy and Coal Industry Minister Ihor Nasalyk was held on Monday to discuss the issue and one more government meeting is scheduled for Thursday. The press service of Energoatom told Interfax-Ukraine that information of Artemenko is not true. He took it from unknown and unverified sources and misinformed citizens, they said. “On July 16, reactor one of Khmelnytsky NPP was disconnected from power grid as there was leakage at nuclear steam generator one, and Energoatom informed about it quickly on its website. This is not leakage of nuclear fuel… Radiation level on the industrial site and adjacent areas have not changed.
http://hisz.rsoe.hu/alertmap/database/index.php?pageid=event_desc&edis_id=UEV-20160721-54185-UKR
Fifty powerful nuclear bombs sitting under airbase in Turkey guarded by American soldiers in NATO uniforms. This scenario may not end well.
Southern Hemisphere June 2016 Local Background Level Report, (7% above average)
Stations Location Map,
http://sccc.org.au/monitoring/Australian-Map.jpg
What the chart colour codes indicate in the charts.
http://sccc.org.au/what-does-each-step-in-the-alert-level-colour-code-mean
Report:
At this location in the winter months air flows tend to come from the Southern Ocean, rather than from the tropical North. When this happens local background levels tend to drop significantly, so compared to the summer months, winter local background levels approach pre-Fukushima levels. There was a small background level spike on the 19th of June. This occurred as a significant rain event passed over the area.
Caloundra day average chart for June 2016
http://sccc.org.au/wp-content/uploads/2016/06/Caloundra-local-average-background-radiation-levels-June-2016.jpg
Caloundra June month average year comparisons.
2016 7% above pre-Fukushima average
2015 3% above pre-Fukushima average
2014 7% above pre-Fukushima average
2013 7% above pre-Fukushima average
2012 3% above pre-Fukushima average
Long term local background information can be found here,
http://sccc.org.au/archives/2630
Disclaimer: This is an amateur volunteer run service. Human error can provide incorrect information, and equipment malfunction can produce false readings. Do not rely on, or take action upon information presented on this web site, without further research.
New EPA proposal could make American’s drinking water THOUSANDS of times more radioactive.
http://www.naturalnews.com/054526_water_pollution_radiation_EPA.html
This is OUTRAGEOUS!!!
Southern Hemisphere May 2016 Rain Water Testing Results
Station location:
http://sccc.org.au/monitoring/Australian-Map.jpg
This short animation of Northern, and Southern Hemisphere air circulation, shows why we can get detections so far south.
Roof down pipe filter design for rainwater testing,
http://sccc.org.au/down-pipe-filter-design
May 2016 down pipe rain water filter test report
There was 123 mm of rainfall in May, at this location.
Small amounts of Pb-210 and Be-7 where detected, plus a very small detection of a possible 77 X-ray from Lead Pb-212, which is the decay daughter of Radon-220. Beryllium Be-7 can be created naturally in trace amounts by spallation in the upper atmosphere by cosmic rays. Lead Pb-210 is the decay daughter of naturally occurring Radon-222 decay. Both Be-7 and Pb-210 can also be released from nuclear power plants, and nuclear accidents. The detection of the Pb-212 77 keV X-ray probably indicates the presents of a small trace of volcanic ash in the air.
May 2016 rain water filter test chart
http://sccc.org.au/wp-content/uploads/2016/06/Down-pipe-May-paper-filter-020616-TV7-18c-84600-B-text.png
Entergy’s FitzPatrick Nuclear Power Plant on Lake Ontario near Syracuse, NY is scheduled to be permanently closed in early 2017. However, the U.S. Coast Guard noticed a problem today, with an unknown fluid seemingly coming from the power plant and leaving a sheen on the lake: https://www.dvidshub.net/image/2690081/sheen-lake-ontario
A brief story has been posted by AP and other news sources are picking it up: http://hosted.ap.org/dynamic/stories/U/US_LAKE_ONTARIO_SHEEN?SITE=AP&SECTION=HOME&TEMPLATE=DEFAULT&CTIME=2016-06-26-22-18-53
As EPA’s political appointee staff prepares to go out of office, they’re apparently positioning themselves to help their friends, including vastly increasing the allowable radioactivity in drinking water:
http://www.truth-out.org/buzzflash/commentary/watch-out-for-a-possible-increase-in-radioactivity-in-your-drinking-water#.V2N0XArviZA.email
The tweet from SafeCast on their twitter is not just lame, it’s frightening.
SAFECAST @safecast Jun 15
“Readings were 1 day 6 mos ago. Likely xray machine or person getting radiation”
A pregnant woman walking down the street that day in New York did not have a clue. A major RADIOACTIVE EVENT may have occurred according to Safecast’s data. Those Safecast numbers were very high.
IMO – Could be doing more damage than terrorists with guns or explosives and nobody will know… therefore, nobody will care.
What sort of evil exists within governments that wish to keep this sort of information from becoming publicly known. It is the government’s #1 responsibility to PROTECT it’s people. Any so called government that is not doing so, or is actively removing technology that can protect us, must be held to account. This is evil and it is madness! Raising levels of acceptable exposures to radioactivity internally or externally is an abomination, not rooted in any science whatsoever. It makes one think our own government is trying to kill us. What other conclusion can you come too???
@Michael, This whole exercise shows there is no system in place to investigate this type of detection, by private or government organizations.
“We are down to 9 (NINE) working beta stations out of 130 sites. Beyond outrageous.”
The USA government monitoring system is being dismantled, at the same time they are raising the acceptable amounts of radiation exposure to ridiculous levels. They are still using the outdated dose model. Anyone who has done any research understands this antiquated model has no baring on the serious health effects that are caused by the internal ingestion of artificial isotopes.
Mind you, this is also happening in other countries. There seems to be a concerted worldwide effort through regulatory capture, to increase the acceptable toxic load populations will accept. These sick bastards don’t care about human populations, your children or grand children, their only objective is profit margins.
Look at the latest EPA Draft Protective Action Guide (PAG) for Drinking Water after a Radiological Incident,
https://www.epa.gov/sites/production/files/2016-06/documents/epa_drinking_water_pag_fr_notice_6-1-16r_pre-pub.pdf
The deadlines for comment submission is the 25th of July, and people can submit comments here.
https://www.federalregister.gov/articles/2016/06/10/2016-13786/notice-of-availability-draft-protective-action-guide-pag-for-drinking-water-after-a-radiological
@vital1: That really is pathetic. Do individual operators on these systems keep records? Six month lag is not acceptable. Out of the New York sites Buffalo‘s beta and gamma graphs work. Inspecting both reveals that the beta and gamma increases don’t correspond very closely meaning all these RadNet gamma graphs are very helpful, if at all. Thank you vital1 for being our One Man International Radiation Station!
Update on the New York detection.
I requested permission to publish the Safecast’s representative’s email reply. They pointed me to the Safecast Twitter account, as Safecast does not publicly comment or advocate, it simply collects and publishes data.
Here is Safecast’s Twitter reply to my query on the New York detection.
A couple of quotes,
“Normal, not error, not a concern.”
“Reading were for 1 day 6 mos ago”
Full details here.
Personally I feel that Twitter is a very poor way to communicate.
@Chase: We are down to 9 (NINE) working beta stations out of 130 sites. Beyond outrageous.
EPA Radnet contract renewal.
“Total estimated cost: $2,478,647 (per year), includes $2,338,804 annualized capital or operation & maintenance costs.”
(Only 9 out of 130 rad detectors working… where’s that maintenance money going?)
https://www.federalregister.gov/articles/2016/06/15/2016-14177/proposed-information-collection-request-comment-request-radnet-renewal
Proposed Information Collection Request; Comment Request; RadNet (Renewal)
AGENCY: Environmental Protection (EPA).
DATES: Comments must be submitted on or before August 15, 2016.
ADDRESSES: Submit your comments, referencing Docket ID No. EPA–HQ–OAR–2003–0041, online using http://www.regulations.gov (our preferred method), by email to a-and-r-Docket@epa.gov, or by mail to: EPA Docket Center, Environmental Protection Agency, Mail Code 28221T, 1200 Pennsylvania Ave. NW., Washington, DC 20460.
“EPA’s policy is that all comments received will be included in the public docket without change including any personal information provided, unless the comment includes PROFANITY, threats, information claimed to be Confidential Business Information (CBI) or other information whose disclosure is restricted by statute. ”
https://www.gpo.gov/fdsys/pkg/FR-2016-06-15/pdf/2016-14177.pdf
@Michael, I have contacted Safecast through their web site contact form.
This was sent to Safecast.
Very elevated background New York detection on the Safecast monitoring network. In some locations it is above 3.99 uSv/hr. Not sure how often Safecast refreshes the maps, so there is some uncertainty how recent this detection is.
Is this a genuine detection that would need investigation by local authorities?
I don’t live in the USA, so someone needs to contact the relevant local authority if it is.
Hopefully you can quickly establish if this detection is a result of equipment malfunction, or something to be concerned about.
http://safecast.org/tilemap/?y=40.7448&x=-73.9798&z=15
@vital1: There is no relevant local authority in a country now down to just 9 out of 130 working beta monitors. Safecast could be contacted by you should you want to investigate. One beta machine works in New York state and shows moderate increase. Gamma is active in NYC.
I don’t live in the USA, so someone needs to contact the relevant local authority.
Hopefully they will quickly establish if this detection is a result of equipment malfunction, or something to be concerned about.
A very elevated background New York detection is showing on the Safecast monitoring network. The map shows detections above 3.99 uSv/hr in some locations. Not sure how often Safecast refreshes their maps, so there is some uncertainty how recent this detection is.
Is it a genuine detection? That would need investigation by local authorities.
http://safecast.org/tilemap/?y=40.7448&x=-73.9798&z=15
If I’m not mistaken the entire town of Grand Junction, Colorado was built using nuclear waste. The sidewalks and streets are made of it.
@Chase
“One of the main things I learned here is that we ARE disposing of radioactive waste from Nuke plants. The ways we are disposing and using this stuff will amaze you. It’s in products and building materials etc”
Yes, they turn the waste into a product, that way you can make a profit out of it, and you don’t have expensive disposal costs. It doesn’t matter about the suffering, pain, and environmental damage you cause, when money is your God!
@vital1
I think they got the crazy road building idea from the USA.
(see Note 2 below)
from the EnvoroReporter Comments Archive:
_________
Chase says:
July 9, 2011 at 9:35 pm
Regarding Fukushima:
“We are at an exposure level that should not be there!”
“No way to contain it, no way to clean it up… they do NOT realize the extent of the problem.”
“Do we have a world wide problem? YES!”
“Are we prepared? NO!”
– Dr. Doug Rokke (pronounced rocky)
DR Rokke is a Depleted Uranium Expert: (specializing in clean ups)
bio: http://www.thepowerhour.com/news3/doug_rokke_bio.htm
Radio interview at the University of Illinois by Roger Cooper located at this link –
47 minutes: http://www.podomatic.com/profile/rogercooper99
(note: link no longer working, I am glad I wrote down at least a couple of these things.)
I learned a tremendous amount from this interview. One of the main things I learned here is that we ARE disposing of radioactive waste from Nuke plants. The ways we are disposing and using this stuff will amaze you. It’s in products and building materials etc… Such as airplane ballasts, golf clubs and more… if these things burn in a crash or fire… then uh oh.
Note 1: DU – Depleted Uranium – DEPLETED does not mean depleted is this case. It’s a word that is used specifically to deceive.
Note 2: Interstate 40 near St. Louis, MO has concrete made with DU. The workers who built that freeway are very sick.
__________
I can also remember seeing Safecast readings of a very ‘hot’ Santa Monica freeway. If you get stuck on the freeway there it’s ‘sort of like’ getting an unnecessary free x-ray. I am pretty sure this ‘stuff’ has been ‘dumped’ and ‘mixed’ into all kinds of stuff that most are unaware of. 🙁
7th June 2016 – Radioactive soil to be used in base layer for new roads
Extract:
The Environment Ministry on Tuesday drew up a basic plan to use soil contaminated with radioactive substances from the Fukushima No. 1 nuclear plant to build roads.
Under the basic plan, tainted soil with relatively low radioactive cesium concentrations of up to 5,000 to 8,000 becquerels per kilogram will be used to form the base layer of roads.
Comment:
Madness!!!
http://www.japantimes.co.jp/news/2016/06/07/national/radioactive-soil-to-be-used-in-base-layer-for-new-roads/#.V1jswvnAPtS
Southern Hemisphere May 2016 Local Background Level Report, (20% above average)
Stations Location Map,
http://sccc.org.au/monitoring/Australian-Map.jpg
What the chart colour codes indicate in the charts.
http://sccc.org.au/what-does-each-step-in-the-alert-level-colour-code-mean
Day average chart for May 2016
There were a couple of significant day average spikes a the beginning of May 2016. From then to the end of May, day average background levels dropped significantly, from a high of 47% above average to 6%, a near pre-Fukushima normal background.
This significant drop in background over the month occurred as less tropical air, and more Southern Ocean air flows reach this location. May, April, March and February this year have seen the highest May, April, March and February month averages since Fukushima.
Caloundra May month average year comparisons.
2016 20% above pre-Fukushima average
2015 4% above pre-Fukushima average
2014 13% above pre-Fukushima average
2013 7% above pre-Fukushima average
2012 7% above pre-Fukushima average
May day average chart
http://sccc.org.au/wp-content/uploads/2016/05/Caloundra-local-average-background-radiation-levels-May-2016.jpg
Cairns May 2016 Report – “My readings taken with my old Gamma Scout have been surprisingly flat. I have recorded the readings of the newly received second Gamma Scout as well, which appear on the left side of the graph, not on the right, as they should be.”
May background comparison chart, Cairns (red) compared to Caloundra (orange).
http://sccc.org.au/wp-content/uploads/2016/06/Cairns-Caloundra-comparison-for-May-2016.jpg
For comparison, long term average background level yearly and monthly charts from 2007 to 2016, can be found here.
http://sccc.org.au/yearly-average-background-radiation-levels
Long term local background information can be found here,
Disclaimer: This is an amateur volunteer run service. Human error can provide incorrect information, and equipment malfunction can produce false readings. Do not rely on, or take action upon information presented here, without further research.
There is a high detection showing at Boston’s Logan International airport terminal B building, on the Safecast community monitoring network. It is ~ 3.99 uSv/hr!
http://safecast.org/tilemap/?y=42.36062&x=-71.02174&z=16
Possibilities:
a. Someone may have taken their Safecast Geiger counter through a TSA scanner?
b. Some sort of food or goods irradiating quarantine facility?
c. Malfunctioning detector?
Is it something to be concerned about?
I have looked around at a number of International airports on Safecast. At present Bostons Logan International airport is the only one showing a large radiation detection at a terminal building.
I suggest someone in the US makes inquiries to eliminate if it is something to be concerned about, or not.
Also, another high detection is showing up on what would have to be a ship, ferry, or boat off the coast of Boston, on the Safecast community monitoring network. From the colour of the detection marker, it looks like around ~ 0.87 uSv/hr.
Ship, ferry, or boat?
http://safecast.org/tilemap/?y=42.292&x=-71.354&z=9
Thanks vital 1 for the information. FYI there is a website dedicated to shielding products and sensors relating to EMF exposure. There are ways of lessening the exposure to microwaves in our homes and on our persons. Here is a link to the site; http://www.lessemf.com/
In a world of increasing toxic load, it is important to reduce anything that may cause biological stress to the body. There is ample research showing that Mobile phone and WiFi technologies that are based on microwave radiation, can potentially be harmful.
Page two of this free Wifi Safety Guide provides a list of practical things people can do to reduce their family’s exposer to WiFi radiation.
http://sccc.org.au/wifi/microwave-safety-chart.pdf
A local newspaper has also based this article on these practical ideas.
Top tips on how to reduce radiation exposure.
http://www.sunshinecoastdaily.com.au/news/top-tips-on-how-to-reduce-radiation-exposure/3033107/
RT is reporting today, 5/24/16, that the decomissioning chief at Fukushima, a Mr. Naohiro Masuda, has reported that 600 tons of melted fuel is “missing”. RT also says in sum and substance that following the tsunami and explosions 3 reactors gained critical temperature and burnt through the respective reactor pressure vessels, concentrating fuel somewhere on the lower levels of the station currently filled with water.
Masuda supposedly said that while all the melted fuel from Reactor 1 poured out completely, an estimated 30% to 50% of the fuel from Reactors 2 and 3 remained in and around the reactors. Masuda supposedly estimated that approximately 200 tons of fuel debris lies within each unit, which makes in total about 600 tons of melted fuel mixed up with metal construction elements, concrete and whatever else was “down there”.
Matsuda supposedly said “It’s important to find it [the fuel] as soon as possible,” that Japan does not yet possess the technology to extract the melted fuel. “Once we can find out the condition of the melted fuel and identify its location, I believe we can develop the necessary tools to retrieve it.”
RT claims that TEPCO hopes to locate and start removing the missing fuel by 2021. RT said that TEPCO’s decommissioning plan implies a 30-40 year period before the consequences of the melt downs are “fully remediated”. Among the remediation projects are some 10 million plastic bags full of contaminated soil concentrated in gigantic waste dumps scattered around the nuclear facility.
So that’s what TEPCO will admit as this time. TEPCO had been planning on building a commercial power generating reactor on leased land near Palacios TX, a plan which TEPCO seemingly abandoned after the Fukushima accident…As they say in Texas “Thank the lord for that.”
19th May 2016 – Former Prime Minister Koizumi backs U.S. sailors suing over Fukushima radiation
Extracts:
“I learned that the number of sick people is still increasing, and their symptoms are worsening,” he told the news conference.
The group of about 400 former U.S. Navy sailors and Marines alleges the utility did not provide accurate information about the dangers of radioactive material being emitted from the disaster-struck plant.
According to lawyers for the group, seven of its members have died so far, including some from leukemia.
Comment:
Most Americans are not aware of the hell these former marines and sailors from the Ronald Reagan task force have been through since Fukushima. The numbers who have become ill has been continually increasing. Some of their children born after the event have also suffered serious health issues. It should have been front page news at the beginning, but there has been a considerable effort to hide their plight from public view!
http://www.japantimes.co.jp/news/2016/05/19/national/former-prime-minister-koizumi-backs-u-s-sailors-suing-over-fukushima-radiation/#.V0FwTJ7APtT
Southern Hemisphere April 2016 Local Background Level Report, (33% above average)
Stations Location Map,
http://sccc.org.au/monitoring/Australian-Map.jpg
What the chart colour codes indicate in the charts.
http://sccc.org.au/what-does-each-step-in-the-alert-level-colour-code-mean
Day average chart for April 2016
Well, April 2016 had the highest April month average since records have been kept here. April, March and February this year have seen the highest April, March and February month averages since Fukushima. The wind direction this time of the year usually comes down the East Coast of Australia from the Northern tropics. The last few months have seen a lot of Eastern equatorial winds drawn South from the Eastern Pacific, and then directed up the East Coast of Australia.
In 2015 the year average background level dropped, to the lowest post Fukushima level. So what is creating the present up tick in background?
Caloundra April month average year comparisons.
2016 33% above pre-Fukushima average
2015 8% above pre-Fukushima average
2014 22% above pre-Fukushima average
2013 9% above pre-Fukushima average
2012 12% above pre-Fukushima average
Caloundra April day average chart,
http://sccc.org.au/wp-content/uploads/2016/04/Caloundra-local-average-background-radiation-levels-April-2016.jpg
Cairns April 2016 Report – “The readings were fairly flat throughout April. My baseline has slightly diminished from former 0.125 to 0.120 uSv/hr or even less.”
Thanks to the Cairn’s station operator for providing this day average Cairns and Caloundra comparison chart.
http://sccc.org.au/wp-content/uploads/2016/05/Cairns-Caloundra-comparison-for-April-2016.jpg
For comparison, long term average background level yearly and monthly charts from 2007 to 2016, can be found here.
http://sccc.org.au/yearly-average-background-radiation-levels
Long term local background information can be found here,
http://sccc.org.au/archives/2630
Disclaimer: This is an amateur volunteer run service. Human error can provide incorrect information, and equipment malfunction can produce false readings. Do not rely on, or take action upon information presented here, without further research.
I was shocked recently when a gentleman walked into the radiation station monitoring room here, and set all the Geiger counter alarms off! At first I though a major nuclear event was occurring. 🙁
After the computer based Geiger counter also stated to alarm, I picked up the GammaScout Geiger counter, and noted it was reading 2.67 uSv/hr. I was standing ~ 2 meters away from him at this point. I had been a lot closer. 🙁
It turned out he had just come from a CT scan at a Sunshine Coast Medical Centre here in Australia.
He asked if he should leave? I politely said yes.
I spoke to him later outside on the footpath, mind you keeping my distance.
It turned out that the medical center hadn’t told him squat about what they had injected him with, or given him any warnings or post procedural advice!
I was shocked at the levels, and pointed out they should have warned him to stay clear of people, including his wife, and particularly children, for at least 24 hours, plus drink plenty of water for 24 hours to flush it out of his system.
So at one metre he was 5.34 uSv/hr, at half a meter 10.68 uSv/hr, and at quarter of a meter 21.36 uSv/hr! If he just happened to hold his grandchild or a baby in his arms, well you get the picture, it would be probably greater than 80 uSv/hr.
A medical chest X-ray is approximately an instantaneous 100 uSv, but at half a metre, you’re getting a full body X-ray every ten seconds, while in the presence of this gentleman!
This all happened rather quickly as you can see from the recorded chart below. The GammaScout Geiger counter is on 60 second data collection, so it didn’t pick up the full peak of my visual observation.
The medical profession has become far too complacent in its handling of these highly radioactive materials, and are placing their patients and the public at risk, in my opinion.
Detection Chart
http://sccc.org.au/wp-content/uploads/2012/03/Medical-Treatment-Spike.jpg
————————————————
Here is an article, that just came out in The Western Australian paper on this very subject.
11th May 2016 – Health experts want doctors to consider CT scan radiation risks
https://au.news.yahoo.com/thewest/wa/a/31566106/app-flags-risk-of-ct-radiation/
——————————————–
bionerd23 – Insane radioactivity in the nuclear medicine operating room
Uploaded on Feb 19, 2010
tiny, radioactive iridium 192 seeds. 10 Curie. 370.000.000.000 atoms decaying every second. and i left my gamma scout with that intense radiation… making an interesting documentary about the levels of ionizing radiation in brachytherapy (to be precise: prostate cancer afterloading).
Latest public detail on plans to move fuel rods from California’s decomissioned nuclear plants to the western-most part of the Texas Panhandle (not West, Texas which is near Waco):
http://www.thenewstribune.com/news/politics-government/article76532967.html
The direct road access to the site can be viewed by doing a map search for Andrews County Texas. It’s due north of Odessa TX which is on U.S. 20, which merges into U.S. 10 east of El Paso. The proposed disposal site also due east of WIPP in New Mexico.
As a result, to get the fuel rods out of California’s populated areas as quickly as possible I would expect them to travel on U.S. 10 to Phoenix, down to Tucson, and on to El Paso merging onto U.S. 20 before Odessa. The other feasible freeway route would be to head towards Kingman Arizona on U.S. 40 and then head due south in New Mexico on U.S. 285 to join up with U.S. 10 east of El Paso.
There appears to be no railroad access to Andrews, Texas.
Note, however, the article claims the fuel rods will not be moved until many years from now.
Fukushima artwork by Tomiyama Taeko. (95 years old)
I personally find paintings #3 and #4 to be very moving.
““JAPAN: Nuclear Power Plant” (Image #4) we see the artist’s interpretation of the wreckage that is Fukushima Daiichi power plant. This image of the bleak, crumbling frame of the plant, a skeleton against an equally bleak landscape, speaks more boldly of the fragility and hubris of this man-made accident than photos or words. “”
“”She describes the growing sense of anger with the folly of building so many power plants in this earthquake-ridden archipelago, as she drove with her friend around the abandoned villages and farmlands in the area. In later reflections on this experience, Tomiyama associates the devastation at Fukushima with Japan’s defeat in WorldWar II. “”
“Revelations from the Sea”: An Artist’s Response to the Disasters of March 11th, 2011
Article by Rebecca Jennison
http://apjjf.org/2012/10/32/Rebecca-Jennison/3806/article.html
7th May 2016 – Spike in radiation levels after toxic waste leak at Washington nuclear site
Extracts:
The recent readings from the Environmental Protection Agency (EPA) obtained by RT have revealed that a sharp spike in the radiation level had been registered in Richland on the morning of May 5.
The readings show the random jump when the toxic fume rates briefly reached around 410 CPM [counts per minute], nearly the highest possible level.
“When they move that waste, they have a lot more vapors coming out from the stacks. The wind was blowing toward me from that stack. That changed my life and hurt my lungs,” Seth Ellingsworth, who became seriously ill from the fumes, told RT. “It kept getting worse and worse.”
Detection Chart Screen Shoot:
http://twitter.com/Yaro_RT/status/728631832800014336/photo/1
Article:
https://www.rt.com/usa/342142-radiation-washington-nuclear-site/
@ Michael, we also had another day here with higher than normal day average background levels. These are the highest day averages for May recorder here. We have local background radiation levels going back to 2007.
Still, the detection here, is not as high as your Santa Monica detection indicates.
Are the Santa Monica and Caloundra background level increases from a new critically event at Fukushima, or from a another recent nuclear event that has been covered up???
Alert Caloundra 3rd May 2016 – On the 3rd May we had a series of storms come through just after midnight. They dropped torrential rain for about 45 minutes, the rest of the day was fine. Background average for the day was 45% above the pre-Fukushima average. The last few days logging data also suggests the GammaScout is functioning fine, as it showed lower background the day before on the 2nd May.
The wind direction plays a big part in detections here. The background monitoring station here is located on a headland, so East, North East and South East of its location is the Pacific Ocean. Maroochydore, the the closest wind detection station, is about ~20 Km away. By comparing the Maroochydore wind direction information against the background chart, it shows the higher detections on the 3rd, were mainly detected when the wind had an Easterly aspect, off the Pacific Ocean.
The question is, what has been creating the background increases over the last few months? In 2015 the year average background level dropped, to the lowest post Fukushima level. May statistically has traditionally been a quiet month, with lower background levels. We have never detected day averages for May at these high 45% + levels, pre or post Fukushima.
Maroochydore wind direction information,
http://www.bom.gov.au/products/IDQ60801/IDQ60801.94569.shtml
24 hour 60 second data logging chart,
http://sccc.org.au/wp-content/uploads/2016/05/Caloundra-24-hour-chart-030516.jpg
Day average chart for may so far,
http://sccc.org.au/wp-content/uploads/2016/05/Caloundra-local-average-background-radiation-levels-May-2016.jpg
May 4, 2016 Santa Monica mist/rain 3.1 times background HIGHER – California Highway Patrol HAZ-Mat level!
Alert Caloundra 1st May 2016 – Here is the day average and the 24hr charts, showing the spike in background coming through. This spike put the day average up to 47% above the pre-Fukushima average.
We had some heavy rain, the first in a long time. The wind direction was all over the place during the event. The next few days may indicate if there was some Geiger counter contamination present, as the monitoring GammaScout was given a clean out and inspection after this spike came through. Nothing obvious was found to indicate contamination was responsible for the spike in background.
Monitoring Site Location
http://sccc.org.au/monitoring/Australian-Map.jpg
Wind direction info,
http://www.bom.gov.au/products/IDQ60801/IDQ60801.94569.shtml
24 hour 60 second data logging chart,
http://sccc.org.au/wp-content/uploads/2016/05/Caloundra-24-hour-chart-010516.jpg
Long term local background can be found here,
H.R. 4979, the Advanced Nuclear Technology Development Act of 2016
…and H.R., Nuclear Utilization of Keynote Energy Policies Act.
Geoffrey H. Fettus Senior Attorney Natural Resources Defense Council, Inc.
This is how it happens. Our legislators in action.
NOTE: The video doesn’t actually start until about 30 minutes in.
(of course the youtube comments are turned off)
I cannot fathom what these legislators and their friends are doing even though I see it before my very eyes.
– They want to remove hearing requirements for Nuclear Plants.
– Ease all license renewals. etc… etc…
– Lessen payments from the energy companies so they can make more money.
(yes, they actually say that)
– Creating new product options. ie… portable Nuclear Plants
— …hundreds of millions, if not billions of dollars are on the line.
These Nuclear Proponents sound more like an infomercial for SAFE CLEAN RELIABLE Nuclear Power.
(Always said with a smile, or is that a smirk?) :rolleyes: Repeated over and over.
IMO – Legislators that don’t know squat are reading from scripts that they don’t really understand yet purport to be factual. It’s a scam! 😡
Southern Hemisphere March 2016 down pipe rain water filter test.
Station location
http://sccc.org.au/monitoring/Australian-Map.jpg
This short animation of Northern and Southern Hemisphere air circulation, shows why we can get detections so far south.
Roof down pipe filter design for rainwater testing,
http://sccc.org.au/down-pipe-filter-design
Report
There was a low 96mm of rainfall in March. The rain water testing has been consistent for months now, with the usual Pb-210 and Be-7 being detected, plus the detection of a possible 77 X-ray from Lead Pb-212, which is the decay daughter of Radon-220. Beryllium Be-7 can be created naturally in trace amounts by spallation in the upper atmosphere by cosmic rays. Lead Pb-210 is the decay daughter of naturally occurring Radon-222 decay. Both Be-7 and Pb-210 can also be released from nuclear power plants, and nuclear accidents.
The detection of the Pb-212 77 keV X-ray probably indicates the presence of a small trace of volcanic ash in the air.
March 2016 rain water filter test chart
http://sccc.org.au/wp-content/uploads/2016/04/Down-pipe-March-paper-filter-080416-TV7-26c-85760-B-text.png
Disclaimer: This is an amateur volunteer run service. Human error can provide incorrect information, and equipment malfunction can produce false readings. Do not rely on, or take action upon information presented here, without further research.
Sometimes it takes a look back to peer forward.
While researching California Grizzly Bears, (now extinct), I realized that the last one shot and killed was just several miles from where I now live.
Less than 100 years ago…
“The last hunted California grizzly was shot in Tulare County, California, in August 1922. Later, in 1924, a grizzly known to roam an area of the Sierra Madre Mountains (Santa Barbara County) was spotted for the last time, and thereafter, grizzlies were never seen again in California.”
https://en.wikipedia.org/wiki/California_grizzly_bear
That got me to pondering… What’s it going to be like 100 years from now? (maybe 10) What will our descendants look back upon and say “That sure was stupid, what were they thinking?” I am certain Nuclear Power and TRIPLE MELTDOWNS like Fukushima will be at the top of that list.
Once a species is gone, it’s gone and it don’t take long.
@Michael, A lot of people are not aware that the earth’s magnetic shield weakened by ~15% in the last 150 years. This is one of the earth’s primary defenses against solar flares and coronal mass ejections from the Sun. The other is the earth’s atmosphere.
I have been a sun watcher for many years, and know it was very unusual for such small solar events in 2011 to produce such Northern Light displays, so far south. These unusual Northern lights displays indicated to me that the electrical dynamics of the upper atmosphere had been changed by the large radioactive releases from the Fukushima Nuclear Catastrophe.
Reports from what would be considered relatively weak solar storms have recently been causing more electrical equipment failure and transformer fires around the world.
What does this mean?
The combined effect of a weaker magnetic field, and the atmospheric ionizing radiation damage from Fukushima, now means that a much much smaller solar event, one significantly smaller than a “Carrington Event”, could wipe out large parts of earth’s electrical infrastructure!
Here is a research paper below, and a report, to support my view that the Fukushima Nuclear Catastrophe has damaged the upper atmosphere. The research paper only covers the atmospheric damaging effects of Krypton-85. It doesn’t take into account the atmospheric damage caused by the thousands of other ionizing isotopes released into the atmosphere by the Fukushima Nuclear Catastrophe!
Article:
WORLD METEOROLOGICAL ORGANIZATION GLOBAL ATMOSPHERE WATCH
Extract: (The extract is from the bottom of page 56.)
“Importance Krypton-85 (85 Kr) is a radioactive noble gas which decays with a half-life of 10.76 years, emitting mainly β -particles of mean energy 251 keV. The main sources of Krypton-85 are the nuclear fuel reprocessing plants and various nuclear reactors.
The nuclear weapons tests in 1945-1963 contributed about 5% of the total Krypton-85 in the atmosphere, whereas its natural sources can be neglected. Radioactive decay is practically the only mechanism of Krypton-85 removal from the atmosphere.
The present background concentrations of Krypton-85 in the atmosphere are about 1 Bq/m 3 and are doubling every 20 years. At this level, Krypton-85 is not dangerous for human beings, but the air ionization caused by Krypton-85 decay will affect atmospheric electric properties.
If Krypton-85 continues to increase, changes in such atmospheric processes and properties as atmospheric electric conductivity, ion current, the Earth’s magnetic field, formation of cloud condensation nuclei and 57 aerosols, and frequency of lightning may result and thus disturb the Earth’s heat balance and precipitation patterns.”
These Krypton-85 induced consequences call for Krypton-85 monitoring.
http://www.empa.ch/plugin/template/empa/*/7530
Fukushima Diary – Update: 25th May 2015 – Still 960,000Bq Cs-134/137 and 2,336,000,000Bq noble gas discharged from reactors to the air every single hour
Extract:
Regarding noble gas (such as Kr-85), PCV (Primary Containment Vessel) gas control system detected 2,336,000,000 Bq of gas discharged from Reactor 1-3 every hour this April. Tepco states noble gas passes by as radioactive cloud to cause only external exposure so the exposure dose caused by the discharged noble gas should be significantly small.
http://fukushima-diary.com/2015/06/still-960000bq-of-cs-134137-and-2336000000bq-of-noble-gas-discharged-from-reactors-to-the-air-every-single-hour/
@vital1: This is absolutely fascinating information. Earthquake science is one of the ‘newest’ sciences so major theories buttressed by facts are very exciting. We’ve been keeping an eye on the Sun since Lights Out in 2014 and a CME space quake causing earthquakes does make sense theoretically. It doesn’t help predicting quakes as CMEs aren’t the only cause nor does it seem possible to pinpoint where they’d happen. The quartz theory seems right on target as well. Here in Southern California, quakes seem to be swarming and we are way overdue for a real mega-disaster. The Southern California Earthquake Center and Southern California Seismic Network are excellent sources of information reminding everyone here to be ready to be self sufficient for three months post said Quakecalypse assuming survival from resultant destruction and fires. Thank you vital1 for this terrific new knowledge.
Japanese Earthquake Swarm
A number of powerful earthquakes have rocked the southern Japanese city of Kumamoto and regions, located on the southern island of Kyushu. I and many others have been keeping an eye on all the Southern Japanese radiation monitoring systems, and at present we have nothing to report. There was a small general up tick reported on the island of Kyushu on the NETC Monitoring network, but we have also seen these small background up ticks like this on this monitoring network, before the earthquake.
Sendai nuclear power plant is the only one operating on the Island at present. Crazy that they even turned it back on after Fukushima!
https://en.wikipedia.org/wiki/Sendai_Nuclear_Power_Plant
Everything is still very unstable as an earthquakes swarm is going right through the centre of the island of Kyushu. So it is worth keeping an eye on those Japanese radiation monitors, and news reports.
You can find a list of the Japanese radiation monitoring stations here, so you can keep an eye on the situation yourself.
http://www.sccc.org.au/international-radiation-monitoring-stations
Technology Predicting Earthquakes.
One of the greatest things about the Internet is that as an individual you can have access to some of the latest research information. Years ago this type of information would only have been available to top scientists in their field.
NASA scientists have proposed a new theory on the cause of major Earthquakes. If the magnetosphere is hit by Solar flares and CME (Coronal Mass Ejections) from the Sun, of a great enough intensity, it can cause what they call a space quake. This is equivalent to a earth quake of 5 or 6 on the Richter scale.
The theory goes that the solar flare, or CME of sufficient magnitude strikes the Earth’s Magnetosphere, this places pressure on the Earth’s tectonic plates and can cause Earthquakes. The Magnetosphere is a naturally formed magnetic field around the Earth created by the Earth’s iron core, it protects the Earth against Solar flares and CME radiation.
Here is an analogy. Imagine that the Earth is like a a boiled egg that you have dropped. When you pick it up the egg shell is broken into many pieces. If you gently squeeze that egg, the shell, representing the Earth’s tectonic plates that make up the Earth’s crust, will move against each other. So when the solar flare or CME hits the Earth’s magnetosphere, it squeezes it, which in turn puts pressure on the Earth’s crust.
Both the recent New Zealand and Japanese Earth Quakes in 2011 occurred during an X chase solar flare activity which also caused a geomagnetic storms in the earth’s magnetosphere. During the Japanese quake it was reported that the Earth’s magnetosphere was also hit by a CME at the same time the X class flare hit.
Here is a site where you can monitor solar flare activity in real time.
http://www.swpc.noaa.gov/
This site will allow you to monitor Earthquake activity around the world in real time.
http://earthquake.usgs.gov/earthquakes/map/
If this theory is correct, this info is great because it will give an idea when something may happen, it just won’t indicate accurately where or when.
New discoveries suggest where and when may be able to be predicted. One study has found that satellites have been recording variations in ULF or VLF radio signals (Ultra/Very Low Frequency) signals from where Earthquakes were about to occur. Also slight increases in earth crust levels can be an indicator. So these two satellite projects are exploring these indicators to see if they can give an early warning of where an Earthquake may occur.
http://homelandsecuritynewswire.com/satellite-system-provide-earlier-earthquake-warnings
http://news.nationalgeographic.com/news/2004/07/0720_040720_earthquake.html
Another study has found that major earthquakes usually occur where there are large quartz deposits in the rock formations on fault lines. There appears to be more water in quartz deposits which allows more slippage in the crust at those points. This would also explain why electrical disturbances can appear before an Earthquake. Lights in the sky or animals who use magnetic field information to navigate becoming confused or dying, plus domestic pets acting strange. Think of the old crystal quartz radios. Quartz and mineral crystals in bed rocks under a lot of pressure would generate an electrical signal giving an indication of an impending quake.
So there appears to be significant advancements in in Earthquake predicting technologies. Putting it all together as an accurate predictor may be closer than we think.
A little truth leaks out from a TEPCO employee:
http://asia.nikkei.com/Business/Companies/Another-inconvenient-truth-emerges-over-Fukushima-disaster
I found this NHK, (Japan News Service), survey to be insightful.
The Great East Japan Earthquake 5 YEARS ON
http://www.nhk.or.jp/d-navi/link/shinsai5/en.html
A survey of 1000 survivors from 311. Voices and opinions too.
“…more than 80 % say either that no progress is being made or that reconstruction is going more slowly than expected.”
When asked, “Do you still feel mental and physical affects?”
“Even five years after the disasters, as many as 60 percent of sufferers say they still feel effects. The number of those who say they still feel depressed, unmotivated or affected in many other ways tends to INCREASE yearly in annual surveys. Ten percent of respondents say it’s painful to keep on living. ”
Comments such as…
“When my grandson who was in kindergarten was living in an emergency shelter, he lost all his hair. When he painted pictures, he used only black. I was worried. I think it was because our family separated after the nuclear accident.” (Anonymous, Minamisoma, Fukushima)
I wonder why we never saw photos of this kind of direct radiation sickness?
“Many survivors say they will not or cannot return to their hometown.”
When asked, “What do you think of the restarting of Nuclear Power Stations?”
72% said Unacceptable 😐
22 % said Inevitable
6% said necessary
What will things be like in another 5 years as the TRIPLE MELTDOWNS continue and the FALLOUT spreads and accumulates? They failed to ask the survivors that question.
Southern Hemisphere Background Report For March 2016, (39% above average)
Stations Location Map,
http://sccc.org.au/monitoring/Australian-Map.jpg
What the chart colour codes indicate in the charts.
http://sccc.org.au/what-does-each-step-in-the-alert-level-colour-code-mean
Day average chart for March 2016
http://sccc.org.au/wp-content/uploads/2016/03/Caloundra-local-average-background-radiation-levels-March-2016.jpg
Well, March 2016 had the highest March month average since records have been kept here. March and February this year have seen the highest March and February month averages since Fukushima. The wind direction this time of the year usually comes down the East Coast of Australia from the Northern tropics. The last two months have seen a lot of Eastern equatorial winds drawn South from the Eastern Pacific, and then directed up the East Coast of Australia.
Caloundra March month average year comparisons.
2016 39% above average
2015 33% above average
2014 31% above average
2013 32% above average
2012 24% above average
Cairns March 2016 Report – “Daily average radiation readings for last month March 2016 for Cairns (red) compared to your readings (orange). Readings were fairly steady, with a minor bump around the 20 – 24th of the month, which was associated with hot weather.”
Thanks to the Cairn’s station operator for providing this day average Cairns and Caloundra comparison chart.
http://sccc.org.au/wp-content/uploads/2016/04/Cairns-Caloundra-comparison-for-March-2016.jpg
For comparison, long term average background level yearly and monthly charts from 2007 to 2016, can be found here.
http://sccc.org.au/yearly-average-background-radiation-levels
Long term local background information can be found here,
Disclaimer: This is an amateur volunteer run service. Human error can provide incorrect information, and equipment malfunction can produce false readings. Do not rely on, or take action upon information presented here, without further research.
Given the emergency in India, I don’t want to post “cute” animal stories. However, given the fact that hunting and eating wild boar in Germany is still heavily regulated because of Chernobyl fall out and contamination of the boars’ forage, it is interesting to see that the abandoned towns around Fukushima are being over run with wild boar as well. http://www.mirror.co.uk/news/world-news/rampaging-radioactive-wild-boars-causing-7705006
There has been a Nuclear event at the Kakrapar Nuclear Plant in India. It has been going on for nearly three weeks now. I have posted two reports below by Dr. Gadekar, a renowned physicist, based in Sampoorna Kranti Vidyalaya, Vedchhi, Gujarat. He appears to be the only reliable independent source of information on this event at present.
If anyone knows of any publicly available radiation monitoring stations or networks, that are available in India, please post the links here.
12 March 2016 – Kakrapar Nuclear Plant Is Likely Undergoing A Loss-Of-Coolant Accident: Dr. A. Gopalakrishnan
Extract:
Till 7.00 PM on March 12,2016 , the DAE officials have no clue as to where exactly the PHT leak is located and how big is the rate of irradiated heavy water that is leaking into the reactor containment . However, some reports indicate that the containment has been vented to the atmosphere at least once , if not more times , which I suspect indicates a tendency for pressure build up in that closed space due to release of hot heavy water and steam into the containment housing . If this is true, the leak is not small , but moderately large , and still continuing. No one confirms that any one has entered the containment (in protective clothing) for a quick physical assessment of the situation , perhaps it is not safe to do so because of the high radiationfields inside . When NPCIL officials state that the reactor cooling is maintained , I believe what they may be doing is to allow the heavy water or light water stored in the emergency cooling tanks to run once-through the system and continue to pour through the leak into the containment floor through the break.
Comment:
It is unclear how serious the situation is, because of a lack of information from Indian authorities. Everyone should keep an eye on this one.
http://www.dianuke.org/kakrapar-nuclear-plant-likely-undergoing-loss-coolant-acc
Latest report:
25th March 2016 – Nuclear Accident in Gujarat Enters Third Week, Lethal Gamble Continues
Extracts:
The PHWR design that is the mainstay of the Indian nuclear programme is a derivative of the Canadian CANDU design. It uses natural uranium as fuel and heavy water as both the coolant as well as the moderator.
LOCA is serious in any nuclear reactor, but in a CANDU it can be catastrophic. Unlike a PWR (Pressurized Water Reactor) (Koodankulam) or a BWR (Boiling Water Reactor) (Tarapur), CANDUs have a positive void reactivity coefficient. What this jargon means is that as the temperature rises in the absence of cooling following a LOCA water begins to boil. Voids are created. In a light water reactor like at Tarapur or Koodankulam, this means that not many neutrons get slowed down. In the absence of slow neutrons to cause further fission, the chain reaction automatically stops. This is an example of a passive safety system that does not need any active intervention on part of the operators. However, in a CANDU, the slowing down of neutrons is done by the moderator heavy water which is separate from the coolant heavy water. A loss of coolant accident here, does not affect the slowing down of neutrons. The chain reaction continues unless it is actively interupted. These reactions are taking place in timescales of nano to micro seconds and human reaction times are too slow for effective action. The RBMK type of reactor that exploded at Chernobyl also had a positive void coefficient of reactivity although it used graphite instead of heavy water for moderation.
19th March 2016 – It’s Not Just Cancer! Radiation, Genomic Instability and Heritable Genetic Damage
Extracts:
The radioactive contamination of the planet has killed tens of millions of babies, caused a huge increase in infertility, and increased the genetic burden of the human race and life on earth.
Using evidence ranging from Chernobyl to the nuclear Test Veterans to the offspring of radiographers we showed clearly that a dose of 1mSv from internal contamination was able to cause a 50% increase in congenital malformations. This identifies an error in the ICRP model and in the current legislation of a factor of 1,000.
It’s official – genetic damage in children is an indicator of harmful exposures to the father
Comment:
This excellent fact based article points out a very little discussed result of radioactive contamination exposure, Genomic instability. Genetic damage caused by radioactive contamination in the first generation, can be expressed in multiple generations of the offspring. One Russian study I read found up to 22 generations and counting, could be affected. This is a very important consequence of radiation contamination exposure that is not discussed.
Southern Hemisphere Background Report For February 2016.
Station location
http://sccc.org.au/monitoring/Australian-Map.jpg
This short animation of Northern, and Southern Hemisphere air circulation, shows why we can get detections so far south.
Roof down pipe filter design for rainwater testing, http://sccc.org.au/down-pipe-filter-design
Day average chart for Caloundra February 2016
http://sccc.org.au/wp-content/uploads/2016/02/Caloundra-local-average-background-radiation-levels-February-2016.jpg
Well, February 2016 had the highest month average since records have been kept here. This was a surprise to say the least considering the wind direction. The wind direction this time of the year usually comes down the East Coast of Australia, from the Northern tropics. Interestingly, most of the late February increases occurred when the wind direction was coming from South or SSE. Equatorial winds this year were drawn South from the Eastern Pacific, and then directed it up the East Coast of Australia. The East Coast of Australia surface wind direction for the later part of February is shown clearly at 2 minutes and 54 seconds into this Suspicious0bserver video.
.
Caloundra February month average year comparisons.
2016 – was 41% above the 4 year pre-Fukushima local average.
2015 – was 30% above the 4 year pre-Fukushima local average.
2014 – was 40% above the 4 year pre-Fukushima local average.
2013 – was 39% above the 4 year pre-Fukushima local average.
2012 – was 37% above the 4 year pre-Fukushima local average.
Cairns February 2016 Report – “My previous baseline used to be 0.125. Last month some readings were below the 0.120 mark. There were no extremes, both curves behave in a similar parallel fashion. Yesterday we had high temperatures and inland wind with thunderstorms, that increased the readings.”
Thanks to the Cairn’s station operator for providing this day average Cairns and Caloundra comparison chart. Cairns is red in this comparison chart, and Caloundra is yellow.
http://sccc.org.au/wp-content/uploads/2016/03/Cairns-Caloundra-comparison-for-February-2016.jpg
For comparison, long term average background level yearly and monthly charts from 2007 to 2016, can be found here.
http://sccc.org.au/yearly-average-background-radiation-levels
Disclaimer: This is an amateur volunteer run service. Human error can provide incorrect information, and equipment malfunction can produce false readings. Do not rely on, or take action upon information presented here, without further research.
18th March 2016 – Shocking health effects in Fukushima nuclear workers found under the official radiation dose limits
Extracts:
The First male Daichi nuclear site worker had an official total dose of 50mSv. “I suffered damages to kidneys, heart, etc. — all important organs in my body.”
The second male Daichi nuclear site worker had an official total dose of 56mSv. He said
“I went to such a severe accident site and worked at the risk of my life, but all I’ve got was this cruel reality and treatment!” I suffered thyroid damage, and had all my stomach removed.
The third male Daichi nuclear site worker had an official total dose of just 19.2mSv. He was diagnosed as having acute myelogenous leukemia.
My doctor said that “70% of the cells in your bone marrow were occupied by cancer. Without any treatment, you will die for sure.”
Comment:
A lot or Fukushima worker deaths and injuries are not reported, so this report is just the tip of the iceberg of worker injury and deaths!
More info on what’s going on in Miami with the leak of reactor cooling water into Biscayne Bay. http://www.miamiherald.com/news/local/environment/article64667452.html
Another Simi Mom,
In my opinion it is criminal that large populations of Japanese men, women and children have been left to live in such contaminated areas. After so many nuclear catastrophes it is madness to allow the nuclear industry to carry on as normal, plus also allow it to expand by building new nuclear plants worldwide. We should be winding back the Nuclear industry as quickly as possible, and using renewable technologies which are much more efficient, and safer.
The nuclear industry and it leaders should be hell accountable for the untold number of lives that have been cut short by numerous nuclear accidents and the wide spread nuclear contamination, plus the enormous environment destruction they have wrought on the world and all living things.
This civilization sees itself as technologically advanced and enlightened, but will be remembered as the cause of one of the worst dark ages in human history.
200 TONS of spent nuclear fuel to be shipped to America for storage.
Yahoo News story today, which you all [may] pick apart, concerning attempts at retrieving remains of fuel rods at Fukushima. https://ca.news.yahoo.com/fukushimas-ground-zero-no-place-man-robot-003153046–finance.html Contrast that part of the news story with your memories of stories of men actually digging out broken fuel rods at the sodium reactor at Rocketdyne Area IV using hand tools. Given his comment here on 3/6/16, Vital will get a chuckle at reporter’s claim that ambient radiation in some areas around Fukushima is only as bad as that in Tokyo.
South Texas Nuclear Project Electric Generating Station near Tres Palacios Bay south of Galveston on Texas Coast, built using GE design. Nobody living nearby with any level of sophistication to keep watch on the plant, except for the plant employees. Most locals living around the plant are low income rural residents who would not be watching or listening to word about troubles at the plant like the folks at San Ononfre did.
While the average Texas working man/technical employee prides himself on his knowledge and skill with sophisticated equipment (such as Texans needed to plug the gas well at Porter Ranch) I worry that no one independent is watching what goes on at the plant. I see the plant from the air every time I fly into/from Houston Hobby, and I worry about the Houston Metro area because it’s downwind from the plant. Houstonians are friendly and helpful, so if any Radiation Conversation II commenters learn anything about problems at the South Texas Nuclear Project Electric Generating Station please post them here so I can get the word out through my Houston relatives.
3/8/16 Tritium leaking from Turkey Point nuke plant south of Miami, potentially screwing up drinking water source for Florida Keys. http://fusion.net/story/278064/turkey-point-leaking-radiation-into-biscayne-bay/
It seems like we’re seeing more and more stories about tritium leaking everywhere, like canaries in coal mines.
6th March 2016 – Tokyo was on the brink of nuclear catastrophe, admits former prime minister
Extracts:
He said he considered evacuating the capital, Tokyo, along with all other areas within 160 miles of the plant, and declaring martial law. “The future existence of Japan as a whole was at stake,” he said. “Something on that scale, an evacuation of 50 million, it would have been like a losing a huge war.”
Mr Kan admitted he was frightened and said he got “no clear information” out of Tepco, the plant’s operator. He was “very shocked” by the performance of Nobuaki Terasaka, his own government’s key nuclear safety adviser. “We questioned him and he was unable to give clear responses,” he said.
“We asked him – do you know anything about nuclear issues? And he said no, I majored in economics.”
Article:
http://www.telegraph.co.uk/news/worldnews/asia/japan/12184114/Fukushima-Tokyo-was-on-the-brink-of-nuclear-catastrophe-admits-former-prime-minister.html?utm_content=bufferbef49&utm_medium=social&utm_source=twitter.com&utm_campaign=buffer
———————————————————
Comment:
The article and posts below, clearly lay out how serious the present situation is in Tokyo.
Tokyo Contaminated & Not Fit for Habitation, Doctor Says
Extract:
All 23 districts of Tokyo contaminated with radiation, worse than at Chernobyl after the accident, and blood cells of children under ten are showing worrying changes; the WHO, the IAEA & the Japanese government cannot be trusted.
http://permaculturenews.org/2014/09/25/tokyo-contaminated-fit-habitation-doctor-says
——————————————————
Anecdotal evidence posted by matty1, on enenews.com, on March the 6th 2016.
Post 1:
“Tokyo is a thousand times more contaminated than belarus. 85% of the children in belarus have heart defects. Mita and Bove’ give Tokyo 5 years. Do not go to Tokyo. Nothing like this has ever happened. There is a tipping point going on. Tokyo is clamped like an iron fist. A no-persons city. It is criminal to even allow people to go there. People are dying mostly from being immunocompromised , stroke, cardiac arrest. Cancer explosion. There is an explosion of abortions and miscarriages there. Also birth defects.”
Post 2:
“The playground number of 480 msv is not anomolous. Enough rads in 2 hours for 1 year. I was on a train and it had to stop 3 time for ill people. People are living in a dream land.”
http://www.zerohedge.com/news/2015-04-25/2000x-normal-radiation-found-tokyo-playground-officials-deny-any-link-fukushima
Post 3:
“The illusion is becoming less diluted in Tokyo and Yokohama every day.”
Dangerous flaw in the electrical systems of EVERY nuclear plant threatens to shut them all down if not fixed immediately.
http://www.huffingtonpost.com/roger-witherspoon/dangerous-flaw-threatens-_b_9382364.html?utm_hp_ref=green&ir=Green
It’s a miracle we haven’t had a meltdown due to this obvious design flaw.
Study claims most Japanese seafood safe from Fukushima radiation.
http://www.huffingtonpost.com/entry/seafood-fukushima-radiation_us_56d4f6e6e4b0871f60ec971f
I don’t believe it.
JAPAN
29th February 2016 – 3 ex-TEPCO execs indicted over Fukushima nuclear disaster – report
Extract:
The three top officials of Tokyo Electric Power Company (TEPCO) were indicted on charges of professional negligence resulting in death and injury, the Kyodo news agency reported on Monday. The officials are Tsunehisa Katsumata, 75, who was chairman of TEPCO in 2011, and two former vice presidents, Sakae Muto, 65; and Ichiro Takekuro, 69, the report added.
Comment:
There should be a lot more people indicted over the handling of this catastrophe!
https://www.rt.com/news/333915-fukushima-nuclear-execs-indicted/
Southern Hemisphere January 2016 down pipe rain water filter test
Station location
http://sccc.org.au/monitoring/Australian-Map.jpg
This short animation of Northern, and Southern Hemisphere air circulation, shows why we can get detections so far south.
Roof down pipe filter design for rainwater testing,
http://sccc.org.au/down-pipe-filter-design
The background levels here went up significantly in late January 2016. There was 2.47 times as much rainfall in January 2016 (133.6 mm), compared to December 2015 (54mm). Even with the increased rainfall, the amount of Pb-210 captured for January and December in the rain water filter, was approximately the same.
Pb-210 is the end product of radon daughter decay. There was more Beryllium-7 detected in January 2016. This was probably created from spallation in the upper atmosphere, by recent solar storm activity. No detectable Cesium is being detected in the rain water filter tests.
January 2016 rain water test chart
http://sccc.org.au/wp-content/uploads/2016/02/Down-pipe-January-paper-filter-030216-TV7-28c-84600-Btext.png
It is important to understand that when you look at a scintillator test chart like the one above, the peak highs can be deceptive.
The Scintillator device used for testing the rain water filter, is less sensitive with increasing isotope energy.
For example the scintillator may have ~50% efficiency near the low energy Pb-210 peak and ~7% efficiency near the mid energy Be-7 peak. So the maths tells us, that more Be-7 was detected than its peak high would indicate!
At best, the above chart is showing what was detected, it does not quantifying the amount.
Radioactive water leak suspends Japan reactor start up.
http://www.msn.com/en-us/news/world/radioactive-water-leak-suspends-japan-reactor-start-up/ar-BBpLhEl?li=BBnb7Kz
Apparently we will never learn from our mistakes. Mankind is doomed to destroy itself one way or another.
17th February 2016 – ACTION ALERT: Join the nationwide citizens’ uprising against the EPA and lead poisoning of our public water supplies
Extracts:
We need 1,000+ samples to really do this right. The more, the better. For statistical certainty, we’d really like to have at least 20 samples from each large U.S. city. Using all these samples, we’re going to build an online USA map of water quality ratings, showing cities with high lead in RED so that everyone can finally see the truth about the safety of their local water supplies.
Don’t Americans deserve to know the truth about what’s in their water? We’ve been LIED to for too long, and it’s time for the lies to stop!
We can no longer trust the government to tell us the truth After the absolute criminal mischief carried out in Flint, Michigan by the Michigan bureaucrats and EPA do-nothings, all Americans now realize we cannot trust the government to tell us the truth about what’s in our water.
Comment:
I think it is a great idea to see citizen testing labs. This way you can get reliable independent information. Government’s are corrupt and can’t be trusted, as evidenced by the lies and ongoing cover up of the Fukushima catastrophe.
http://www.naturalnews.com/053008_city_water_lead_poisoning_citizens_revolt.html
18th February 2016 – Radioactive material stolen in Iraq raises fears of Islamic State dirty bomb
Extracts:
The document, dated November 30 and addressed to the ministry’s Centre for Prevention of Radiation, describes “the theft of a highly dangerous radioactive source of Ir-192 with highly radioactive activity belonging to SGS from a depot belonging to Weatherford in the Rafidhia area of Basra province”.
The material is classed as a Category 2 radioactive source by the International Atomic Energy Agency, meaning if not managed properly it could cause permanent injury to a person in close proximity to it for minutes or hours, and could be fatal to someone exposed for a period of hours to days.
Comment:
There are regular reports coming in of highly radioactive material being stolen or being lost!
These reports don’t build confidence in the nuclear industry’s mantra of security and safety!
http://www.abc.net.au/news/2016-02-18/radioactive-material-stolen-in-iraq-raises-security-fears/7178912
Indian Pont radiation leak now 120,000 times worse.
http://enenews.com/cbs-radioactive-leak-getting-worse-nuclear-plant-nyc-levels-increase-120000-governor-extremely-disconcerting-gundersen-dont-comng-radioactive-antimony-being-detected-5000-picocuries-liter
What a nightmare nuclear energy has become.
😐
The words of President John F. Kennedy
July 26, 1963 upon signing the ban on above ground nuclear tests
[excerpts]
“Even then, the number of children and grandchildren with cancer in their bones, with leukemia in their blood, or with poison in their lungs might seem statistically small to some, in comparison with natural health hazards. But this is not a natural health hazard and it is not a statistical issue. The loss of even one human life, or the malformation of even one baby who may be born long after we are gone, should be of concern to us all. Our children and grandchildren are not merely statistics toward which we can be indifferent.”
“Nor does this affect the nuclear powers alone. These tests befoul the air of ALL men and ALL nations, the committed and the uncommitted alike, without their knowledge and WITHOUT their CONSENT. That is why the continuation of atmospheric testing causes so many countries to regard ALL NUCLEAR powers as equally EVIL; and we can hope that its prevention will enable those countries to see the world more clearly, while enabling all the world to breathe more easily.”
http://www.jfklibrary.org/Research/Research-Aids/JFK-Speeches/Nuclear-Test-Ban-Treaty_19630726.aspx
Radioactive tritium found in water below Indian Point Nuke Plant near NYC.
http://www.msn.com/en-us/news/us/radioactive-material-found-in-groundwater-below-nuke-plant/ar-BBpclE0?li=BBnb7Kz
Major Earthquake in Southern Taiwan
There have been a number of fatalities, buildings have been damaged, plus multiple buildings have collapsed.
https://www.rt.com/news/331456-powerful-earthquake-strikes-taiwan/
Taiwan has a number of Nuclear power stations.
Wikipedia Extract:
“Active seismic faults run across the island, and anti-nuclear environmentalists argue Taiwan is unsuited for nuclear plants.[5] A 2011 report, by the environmental advocacy group, the Natural Resources Defense Council, evaluated the seismic hazard to reactors worldwide, as determined by the Global Seismic Hazard Assessment Program data, placed all of Taiwan’s reactors within the highest risk group of 12 reactors within very high seismic hazard areas, along with some of Japan’s”
https://en.wikipedia.org/wiki/Nuclear_power_in_Taiwan
The Taiwanese Nuclear power station radiation monitoring system does not appear to be operating at present. That makes it difficult to assess if the earthquake has affected any of the Nuclear power stations. Maanshan Nuclear plant is on the southern tip of the Island.
https://en.wikipedia.org/wiki/Maanshan_Nuclear_Power_Plant
The closest radiation monitoring stations are in Hong Kong in China, but at present the surface air currents are flowing across the island into the China Sea.
You can find the Chinese Hong Kong Radiation monitors, and the Taiwanese monitoring stations links here,
http://sccc.org.au/international-radiation-monitoring-stations
You can track wind direction using the Nullschool 3D Earth Wind Map service. This link should open at Taiwan.
http://earth.nullschool.net/#current/wind/surface/level/orthographic=-238.58,24.20,2451/loc=123.861,22.483
How to use the Earth Wind Map service.
https://www.youtube.com/watch?v=jIWmvxTRuNUo
Latest earthquake Information
http://earthquake.usgs.gov/earthquakes/map/
@vital1: This is excellent information! We concur entirely. Thank you.
@Michael, very cost effective live Radon monitoring station equipment has recently become available.
In my opinion, any large underground gas release like Porter Ranch would be releasing Radon or Thoron into the local environment.
The question is how much?
The only way to find out is to test for it.
Here is information on how to set up is a very cost effective real time live Radon and Thoron monitor station. The older pre-built model cost us around AU$250 a year and half ago. It can be built as a kit, or purchased pre-built. If anyone is interested, I would suggest purchasing the latest professional model, as it fixes the vibration and humidity sensitivity issues found in the older model.
http://www.theremino.com/en/hardware/inputs/radioactivity-sensors
You can use the free open source Theremino Geiger software with it to chart Radon levels, in real time on a laptop screen, or portable device. Information on Theremino Geiger software can be found here.
http://www.theremino.com/en/downloads/radioactivity
Link to download the latest Thermino Geiger software – Version 6.5 ,
http://www.theremino.com/wp-content/uploads/files/Theremino_Geiger_V6.5.zip
Our local live Radon monitoring station chart is the third chart down on this page.
http://sccc.org.au/monitoring/sunshinecoast-monitoring-station.html
Here is a Radon testing technique using a Geiger Counter. Unfortunately this method doesn’t enable the precise measurement of Radon air concentration. Even so, it will still let you know if there is significant amounts of Radon in the atmosphere.
After rain, testing a paper towel swab of a car bonnet with a Geiger counter can be effective way to test for Radon decay daughters. Unless you have a nuclear event happening, an initial high detection, that decays quickly in a few hours, indicates the presence of Radon decay daughters. If it is a large multi uSv/hr detection, it will take a lot longer before these daughter isotopes decay to near normal background levels.
General suggestions to get the best rain swab results.
It is important to wear surgical gloves, or equivalent.
A. When you do a rain swab test, use a couple of paper towels.
B. Use both sides to wipe over the wet car bonnet.
c. Straighten them out close to the original shape.
d. Then fold it into a shape suitable for the Geiger testing.
e. While you still have your gloves on, squeeze out as much water as you can.
f. Then place it in the zip lock bag. I usually get someone to hold the bag open for me, so I don’t touch the outside of the plastic bag.
h. While outside, take the gloves off, then squeeze out the air in the plastic bag, and seal it.
i. Label, date, and provide general location.
The flat rectangular shape makes it easier to test, and removing as much water as possible improves sensitivity. You don’t know what you have captured in the swab, so remember to keep you hands away from you face, and wash your hands thoroughly afterwards. Also, avoid leaning on the wet car while collecting the swab.
Label the sample with time, date, and location of collection. You, or someone else may be able to do further testing with better equipment in the future
If you are using a Geiger Counter to test the rain swab, take timed measurements in CPM. If Radon washout, it will be approx. half the original counts, after one hour. If it is manly Radon washout it will decay quickly, most of it will have decayed away in about 12 hours.
Having a Geiger counter with a computer charting facility is a great help. Charted here, is Radon daughter washout decay, captured in a rain swab. Most of it had decayed away in 6 hours.
http://sccc.org.au/wp-content/uploads/2013/06/Rain-swab-090613-Radon-decay-+-text.jpg
In the Porter Ranch environment until further tests are done, there is no way of knowing if other toxins are also present in the rain. Rain and snow concentrate atmosphere contamination because they collect contaminants as they fall.
In my opinion, if you are getting Radon washout events at high counts or uSv/hr levels, it would be advisable to keep children and pets, out of the rain. In the Porter Ranch area it would probably be wise to wash any locally grown vegetables, herbs and fruit. If you use tank water, I also suggest using a good water filter before use.
@vital1: We have been monitoring the Porter Ranch gas leak and there have been no solid reports we’ve seen that indicate radon is part of the leak in any major way. Where did you get that other than lawyers’ reps floating the notion?
It is not easy to measure for radon in Porter Ranch. It can be done in a number of ways including smart spreading of passive detectors throughout the neighborhood, a tall order with the evacuations and lack of any structure to organize those who would actually obtain such detectors and utilize them in a common manner so the data actually means something. An in-situ portable gamma-scintillation detector runs about $25,000 to $30,000 and requires someone expert to operate it, someone like you vital1 or me.
Until then, speculating on the radon gas content escaping during this methane leak is just that unless there is information out there we are unaware of. This report, as you already know vital1, won’t even check for radionuclides let alone radon.
Significant amounts of radioactive Radon gas is also being released by the Porter Ranch Methane gas leak, not just the toxins mentioned in the USC study below.
Information on Radon gas.
http://www.who.int/ionizing_radiation/env/Radon_Info_sheet.pdf
Also be aware that when you are exposed to multiple toxins, you can get a toxicity multiplying effect.
A single toxin in the environment can be a hazard, and maybe an organism’s natural biological defense system can deal with this effectively. If an organism has multiple toxins present, radiological and chemical, to deal with at the same time, you get a biological toxicity multiplying effect. The human or animal defense systems become weaker the more toxins it has to deal with.
Biologically, one toxin plus one toxin, does not equate double the toxicity effect. Studies show you can get a multiplying toxicity damaging effect 10 to 20 time greater. The human or animal defense systems become weaker the more toxins it has to deal with. The organism becomes overloaded dealing with too much toxic stress at once.
28th January 2016 – USC researchers to study long-term health effects of Porter Ranch gas leak
Extract:
Methane makes up about 90 percent of natural gas. Methane and other chemicals emitted in natural gas can react in the open-air environment and create other gases and chemicals, such as hydrogen sulfide. Benzene, toluene, ethylbenzene and xylene also have been associated with the emission and are thought to be part of the oily residues in the well and on the walls of the storage facility.
Researchers at USC are interested in investigating these chemical constituents and the long-term effects that might result from breathing in these chemicals.
I just received the day average comparison chart of Cairns and Caloundra, for January 2016
The January day average peaks at Caloundra were less than those recorded for Cairns, see the Cairns and Caloundra Comparison chart below. Cairns is a lot closer to the equator than Caloundra.
Monitoring Stations Location Map,
http://sccc.org.au/monitoring/Australian-Map.jpg
Cairns January 2016 Report – “Some spikes at the beginning of January associated with very hot weather. The rest of the month stayed fairly flat, close to my baseline of 0.125 uSV/hr.”
Thanks to the Cairn’s station operator for providing this day average Cairns and Caloundra comparison chart. Cairns is red in this comparison chart, and Caloundra is yellow.
http://sccc.org.au/wp-content/uploads/2016/02/Cairns-Caloundra-comparison-for-January-2016.jpg
January 2016 Southern Hemisphere Background report (41% above average)
Alert Caloundra 31th January 2016 – The background here has seen a steady increase during January, reaching 64% above average on the 31st January. The 24 hour, 60 second logging chart for the day, showed a significant increase in background levels between 9am to 2.30pm. It was cloudy, but not raining at the time.
24 hour 60 second logging chart for the 31st January 2016
http://sccc.org.au/wp-content/uploads/2016/02/Caloundra-24-hour-chart-310116.jpg
Day average chart for January 2016
http://sccc.org.au/wp-content/uploads/2016/01/Caloundra-local-average-background-radiation-levels-January-2016.jpg
What the chart colour alert codes mean.
http://sccc.org.au/what-does-each-step-in-the-alert-level-colour-code-mean
Three minutes and 15 second into this Suspicious Observer video weather report, you will see the surface air flow turn down along the East Coast of Australia from the tropics. Generally we see increased background levels at the monitoring station here, in the warmer months, when we get more air flow from the tropics.
Long term local background information can be found here,
http://sccc.org.au/archives/2630
Disclaimer: This is an amateur volunteer run service. Human error can provide incorrect information, and equipment malfunction can produce false readings. Do not rely on, or take action upon information presented here, without further research.
Here’s the latest message on the status of Fukushima Daiichi from TEPCO.
😉 Draw you own conclusions would be my suggestion.
“The current situation at Fukushima Daiichi NPS”
– From 3.11 toward the future, Produced by TEPCO
– (ver, Jan.2016)
– Video: (08:24)
http://www.tepco.co.jp/en/news/library/archive-e.html?video_uuid=g8wll0kc&catid=69631
My conclusion: Nuclear Power was and is a bad idea gone horribly wrong. 😡 😥
Nice catch Chase! Makes us not hungry just looking at it. This stellar capture should be the Fukushima Meltdowns at Five Years poster shot.
😐
Here’s a screenshot I took on 1/20/2016 at 2:36 jst via the TBS Webcam.
It looks like a very large fishing boat with it’s trolling lights on.
http://caferadlab.com/attachment.php?aid=359
The thought that somebody somewhere could unknowingly consume those fish is a very scary thought. So scary I can’t believe any human being in their right mind would do such a thing. Yet, I know humans do some pretty insanely stupid things, so I wonder. Why else would those fish trolling lights be on… hmm? Did they unload their hefty catch at some far away port and say in came from somewhere else? It would be a crime beyond description.
There are no fish police. At least not at 2:30 in the morning just east of ongoing TRIPLE MELTDOWNS.
@Chase,
“My thought is that if the Southern Hemisphere hovers around +20% for 4 years, then wouldn’t it be safe to assume the percent over pre-Fuku backgrounds in the Northern Hemisphere would be significantly higher?”
Research from the Northern Hemisphere atmosphere bomb testing era, during the 50’s and 60’s, indicates that five to one was the approximate ratio of radioactive contamination that leaked through the equatorial barrier. In other words, about 17% of the atmospheric radiation contamination in the Northern Hemisphere made it into the Southern Hemisphere.
If we assume that the Fukushima Catastrophe has a similar atmospheric dynamic, then a much larger level of Fukushima radioactive contamination has circulated the Northern Hemisphere, compared to what I have detected here in the Southern Hemisphere. The research papers published on the atmospheric Fukushima radioactive contamination releases, support this.
@vital1 Great information, as usual. Thank goodness somebody had pre-Fukushima data for clear comparison.
My thought is that if the Southern Hemisphere hovers around +20% for 4 years, then wouldn’t it be safe to assume the percent over pre-Fuku backgrounds in the Northern Hemisphere would be significantly higher?
Does the Radnet data reflect such a difference? Or is the data so unreliable as to make it useless to really consider. I think I know the answer. 🙁
Southern Hemisphere 2015 Year Background Radiation Report.
Summary
2015 – was 18% above the 4 year pre-Fukushima local average.
2014 – was 20% above the 4 year pre-Fukushima local average.
2013 – was 22% above the 4 year pre-Fukushima local average.
2012 – was 21% above the 4 year pre-Fukushima local average.
In 2015 test results indicated some of the increase in November and December local background levels were possibly from increased Southern Hemisphere volcanic activity. Even taking this into account, the data indicates a gradual decline in local background atmospheric detections from the previous year’s peaks, since Fukushima.
Monitoring Station Location Map:
http://sccc.org.au/monitoring/Australian-Map.jpg
This short animation of Northern, and Southern Hemisphere air circulation, shows why we can get atmospheric detections so far south.
I have also conducted a number of local beach sand, seaweed, and Pacific Ocean plankton tests. If any Fukushima Pacific Ocean Cesium contamination has reached this location, it is at levels below the detection sensitivity of the test equipment used here.
The scintillator test equipment used here is way more sensitive than an average Geiger counter, but it is not as sensitive as the very expensive test equipment available to research or university scientists.
Detailed local background level month and year charts from 2007 to 2015, can be found here.
http://sccc.org.au/yearly-average-background-radiation-levels
December 2015 down pipe rain water filter test
The December 2015 down pipe rain water filter test shows the usual Lead Pb-210 and Beryllium Be-7. December 2015 rainfall was 54mm. This is less than the rainfall for November 2015 76mm, but there was more Pb-210 detected in December.
December Rainwater Filter Chart
http://sccc.org.au/wp-content/uploads/2016/01/Paper-Towel-Filter-December-020116-TV67-22c-86286-B-text.png
November Rainwater Filter Chart
http://sccc.org.au/wp-content/uploads/2015/12/Down-pipe-November-paper-filter-031215-TV67-22c-84905-B.png
Disclaimer: This is an amateur volunteer run service. Human error can provide incorrect information, and equipment malfunction can produce false readings. Do not rely on, or take action upon information presented here, without further research.
HAZMAT in Vietnam on January 05 2016 02:06 PM (UTC).
Extract:
Cause of event 4 kilograms Cs-137 missing (stolen?)
Comment:
That is a lot of missing Cesium-137 !!
http://hisz.rsoe.hu/alertmap/database/index.php?pageid=event_summary&edis_id=HZ-20160105-51565-VNM
Carlsbad is near the Waste Isolation Pilot Plant (WIPP), a large underground nuclear waste repository in New Mexico. WIPP is located approximately 26 miles east of Carlsbad. There were major radiation releases from this facility in February 2014.
Google Maps:
https://www.google.com.au/maps/place/WIPP/@31.7856297,-106.3859676,7z/data=!4m2!3m1!1s0x8830e5cae55ca943:0xa15022872190c36f
29th December 2015 – Carlsbad NM Gamma 5, Do ya think there was a release?
Extract:
RadChick Radiation Research & Mitigation Wow that thanks Julie. Travis Malek she is part od a group where they source rad info daily, i suggest you check them out. The people are awesome there, good info and no drama
Chart:
https://scontent.fbne1-1.fna.fbcdn.net/hphotos-xap1/v/t1.0-9/1917060_1066703436714211_3292854551451818868_n.jpg?oh=08f2822b0260da147549a8f320f6c859&oe=571E43B2
Source:
https://www.facebook.com/photo.php?fbid=1066703436714211&set=p.1066703436714211&type=3&theater
Group:
https://www.facebook.com/groups/1489134567980447/
8-10uR/h in East Los Angeles, C/ at 10:15am. 12/26/2015.
within normal gamma ambient levels for this area.
Hector
Instrument: WB Johnson GSM-500 with Johnson GSP-1
cal: 12/21/2015
Glendale CA radiation station recording a 10 at 6:09 PM on 12/24/15. That is the lowest I’ve ever seen it. Merry Christmas everyone and thanks so much for all that you do!
Thanks to Dr. Sternglass for this research paper below. It clearly demonstrates how environmental radioactive contamination from the nuclear bomb testing era, caused very large declines in Pacific Ocean fish stocks.
The massive amounts of radioactive environmental pollution constantly following into the Pacific Ocean from the Fukushima Nuclear Catastrophe site, would have a similar effect. Fukushima radioactive contamination is lowering the fertility and weakening the immune systems of any sea life coming in contact with it.
Please use Dr. Sternglass’s research paper as a resource to educate people on how radiation contamination from the Fukushima Nuclear Catastrophe, has caused a collapse of the Pacific Ocean food chain.
Quote from Dr. Sternglass’s Research Paper:
“The purpose of the study was to determine whether continued atmospheric testing by France and China or potential releases from underground detonations that might unexpectedly escape into the nearby fishing grounds could have detectable effects on the reproduction of fish populations similar to the unanticipatedly severe effects of low level radiation on the human embryo and fetus (2, 3, 4) recently confirmed by independent studies by other investigators (5, 6).”
08.10.1971 – Fallout and Reproduction of Ocean Fish Populations. E.J. Sternglass, Department of Radiology, School of Medicine, University of Pittsburgh, Pittsburgh, Pennsylvania
Extract:
Nuclear Fallout causes Fish Population Decline,
As will be shown below, very large declines of fish-populations after low-altitude nuclear tests followed by a gradual recovery to pretesting levels have been observed both in the Atlantic and Pacific, strongly suggesting that the eggs of fish and the developing young are far more sensitive to internal radiation from low-level fallout than had been anticipated, very much as in the case of the human-embryo and fetus.
http://www.mindfully.org/Nucs/Fallout-Fish-Sternglass8oct71.htm
Thank you Dale and Michael for your reports.
@Chase & Enviroreporter
Glendale Rain 44.2 CPM
Background 42.5 CPM
Sample taken Dec 13th 2015 at 6:50 PM
Looks like we have cool rain at Radiation Station Glendale, California
@Chase et al: The latest rain is, thankfully, normal.
December 13, 2015
5:55 pm INT RSSMC RAIN: 46.0 CPM^^ OR BACKGROUND
5:40 pm INT RSSMC BG: 42.5 CPM^^
Stayed tuned for some serious stories we are near breaking. And don’t miss this week’s latest ATSDR bows out of Santa Susana Field Lab probe and comment, please.
PS: Raddies like Chase, vital1 and Dale make this job worthwhile. Thank you, gentlemen.
@Michael or anyone …Any California rain readings?
@vital1
Thanks, for all the great information.
IMO – If the truth is ever told the number of lives sacrificed at Fukushima will someday dwarf Chernobyl.
The number of living things that have been affected and that will be affected by this debacle cannot be estimated. Not to mention those that will never be born because of it.
Maybe the question is now, just how long will it take for TRIPLE NUCLEAR MELTDOWNS, 3 China Syndrome(s), to… do… whatever they’re actually going to do and how long will it take?
I am sure there is somebody somewhere that can or has simulated the oncoming waves of FALLOUT, at current rates, and determined what will happen, in the near and not so near future, to our ecosystems and livelihoods, as we now know it. I sometimes guess at the timeline, I hope, but I realize there’s probably no way of really knowing, so I move forward.
One answer is here, but it may be too late. I HOPE not. 😉
➡ 30-megawatt, Offshore Wind Farm (Windmills)
http://www.accuweather.com/en/weather-news/first-us-offshore-wind-farm-block-island-rhode-island-industry-seeks-further-growth-expansion-energy-future/54057815
@ Chase, “Many people could have been saved or avoided suffering had the truth been told in a timely manner.”
They decided to protect the nuclear industry rather than the men, women and children. This is unforgivable and criminal, and a crime against humanity.
“It’s been 5 years. I wonder what the real health impacts are?”
There are three nuclear core meltdowns at Fukushima Nuclear Catastrophe site in China syndrome, with an underground river constantly following over them into the Pacific Ocean. The Pacific Ocean is dieing!
The nuclear disaster in Japan is also much larger than the Fukushima site. The Japanese Government admitted in May 2011 that they had 14 Nuclear reactors that had been seriously damaged, not just the 4 at the Fukushima Nuclear disaster site. We have no real information on what has been happening at those other Nuclear Disaster sites, because of the news blackout.
An extract from a Japanese presentation on the subject, that has since been taken down.
“According to Japan’s Nuclear and Industrial Safety Agency (NISA), the earthquake and subsequent tsunami affected fourteen nuclear reactors at four sites along the eastern coast the Fukushima Daiichi site (six reactors), Fukushima Daini site (four reactors), the Ongawa site (three reactors) and the Tokai site (one reactor). The most serious damage occurred at the Fukushima Daiichi Nuclear Power Station.”
http://brc.gov/sites/default/files/meetings/presentations/brc_staff_memo_re_fukushima_5-10-11.pdf
Here are fatality and injury reports resulting from this ongoing catastrophe! This is probably just the tip of the iceberg!
USA
Jul 21, 2015 – USS Reagan Sailors Sue for Nuclear Justice
Extract:
Attorney Charles Bonner gives an update on his class action litigation on behalf of military personnel harmed by exposure to Fukushima fallout during an aid mission. The suit targets the plant operator and its manufacturers.
USA
There have already been independent medical reports of 35% spike in infant mortality in the North Western USA, and 48% in Philadelphia.
USA
22nd December 2011 – Peer Reviewed Study Shows 14,000 U.S. Deaths from Fukushima
Extract:
There’s shocking new evidence out that the Fukushima disaster may have led to the deaths of as many as 14,000 people…in America! For more on this – I’m joined by Dr. Janette Sherman – Internist and Toxicologist – and co-author of a new report on the link between an increase in deaths here in America and the ongoing Fukushima nuclear crisis.
https://www.youtube.com/watch?v=Bdow_6pN6jY#t=11
JAPAN
8th November 2015 – Chris Busby; Fukushima Thyroid Cancer- The Royal Swedish Academy of Sciences
Extract:
Sweden, like all European States is subject to the EURATOM Basic Safety Standards Directive which contains a clause, an amendment by the European Greens in 1996 at the suggestion of Busby, Alice Stewart, Alexy Yablokov and Rosalie Bertell.
It states that if “New and important Evidence” emerges that the risk model is wrong, all practices involving radiation exposure in the EU must be Justified all over again. Here, Chris Busby attacks the risk model and those who had presented extremely biased science through the day of the symposium.
He draws attention particularly to the recent publication in the journal Epidemiology which reports 120 thyroid cancers in 380,000 children living near Fukushima. This shows an error in the ICRP model of 2600 times.
Comment:
It is very evident from numerous research papers, that the Nuclear industry dose model is seriously flawed. This means all their statements about safety levels are grossly inaccurate.
JAPAN
From the FIOA requests of the NRC transcripts… March 16th 2011 correspondence between the NRC and the Japanese in which they admitted to 5 people having received lethal radiation doses. This was just days after the start of the disaster!
http://enformable.com/wp-content/uploads/2012/01/Pascarelli-Robert.png
USA
19 March 2015 – Changes in Congenital Anomaly Incidence in West Coast and Pacific States (USA) after Arrival of Fukushima Fallout
Extract:
Consistent patterns of elevated increases are observed in the west (20 of 21 comparisons, 6 of which are statistically significant/borderline significant), by state, type of birth defect, month of birth, and month of conception. While these five anomalies are relatively uncommon (about 7500 cases per year in the U.S.), sometimes making statistical significance difficult to achieve, the consistency of the results lend strength to the analysis, and suggest fetal harm from Fukushima may have occurred in western U.S. states.
http://file.scirp.org/Html/13-1330400_54828.htm
JAPAN
TEPCO Workers deaths are not reported
Extracts:
“She also said that there were 100,000 shifts shared between the work force that have worked at the Fukushima Daiichi Nuclear Plant so far, also, 4% of 100,000 (4300) workers have reportedly died.”
“Apart from Tepco workers, 64 members of the Self Defence Force and about 300 policemen have also died. They said that those policemen who work at the security check points of the no go zones in Fukushima prefecture are not wearing any protection, therefore, they have been exposed to huge amounts of ionizing radiation.”
http://robinwestenra.blogspot.com.au/2013/11/tepco-workers-deaths-not-reported.html
JAPAN
KPFA Flashpoints, Mar. 10, 2014 (at 3:00 in):
Steve Zeltzer, reporting from Japan: One of the things I learned in Osaka from the president of the day laborers is that many of the day laborers being brought into the plant, they’re not being registered and they’re disappearing. There were over 800 day laborers who have disappeared from contact by the union, which means they may have been killed or died during work.
http://enenews.com/kpfa-in-japan-ive-learned-over-800-people-missing-from-fukushima-plant-they-may-have-been-killed-or-died-during-work-govt-is-actually-in-business-with-the-yakuza-audio
JAPAN
10th March 2015 Japan’s nuclear-related deaths rise by 18%
Extract:
Tokyo – A total of 1 232 deaths in Japan’s Fukushima prefecture over the past year were linked to the nuclear accident four years ago, up 18% from a year earlier, a news report said on Tuesday.
http://www.news24.com/World/News/Japans-nuclear-related-deaths-rise-by-18-20150310-2
JAPAN
By ex Daiichi worker, from 2012 –
http://blog.goo.ne.jp/jpnx05/e/6de670909c7788f2443a5c370d4a384b
休憩中に 煙草をいっぷくして ・・・「 そろそろ、いくか 」 と、立ち上がっ て、座ったままの 彼に 声をかけたら、亡くなっていた。 しかし、ご遺体は、 ご遺族の元へは、返されなかった。 ご遺体から、放射能が出ているためだった という。 セメントに詰められて、J ヴィレッチ へ運ばれ ・・・その後は、ど のように 扱われたかは、誰も知らない。
‘One day I was taking a cigarette break with a coworker. When we finished our break, I stood up and called out to my still-seated coworker: ‘Wanna get going soon?’ But he didn’t move. He was dead. The dead body was not returned to his family because of radiation. They poured cement over the body and carted that off to J village area. I have no idea what happened to the corpse after that.’
😐
Declassified FOIA
“100% of the total spent fuel was released to the atmosphere from unit 4.”
“DOE Aerial Measurement Teams have completed two flyovers of the Daiichi site. NRC has received the data and the analyses from the first fly-over.”
– page 6 of the .pdf file
(Around March 18, 2011)
Source document: NRC
http://pbadupws.nrc.gov/docs/ML1212/ML12122A949.pdf
…more
“EXCEPT for ALASKA, all thyroid dose estimates are well below the EPA 5 rem PAG.”
Alaska took a BIG iodine hit. I didn’t know that. Probably Canada too.
Hey people of Alaska, were you informed? 😡
Okay, I’ll say it, “This IS criminal” and “Obama is a bold faced liar”!
“The thyroid estimate is VERY conservative and does not consider intervention actions like distribution of potassium iodide, removing dairy cows from contaminated pastures, or interdicting milk or leafy vegetables contaminated with 1-131.”
It’s been 5 years. I wonder what the real health impacts are? Many people could have been saved or avoided suffering had the truth been told in a timely manner. 😥
10 December 2015 – Declassified U.S. Government Report on Fukushima: “100% of The Total Spent Fuel Was Released to the Atmosphere from Unit 4”
Extracts:
The source term provided to NARAC was: (1) 25% of the total fuel in unit 2 released to the atmosphere, (2) 50% of the total spent fuel from unit 3 was released to the atmosphere, and (3) 100% of the total spent fuel was released to the atmosphere from unit 4.
For example, there was “more cesium in that [Unit 4] fuel pool than in all 800 nuclear bombs exploded above ground.”
Comment:
If 100% of the total spent fuel was released to the atmosphere from unit 4, it means the said removal of the spent fuel rods from unit 4 fuel pool was noting but staged theater for the masses!
http://www.zerohedge.com/news/2015-12-10/declassified-us-government-report-%E2%80%9C100-total-spent-fuel-was-released-atmosphere-unit
Uranium contamination in central California’s drinking water exceeds federal safety standards.
https://www.yahoo.com/health/uranium-contamination-danger-in-the-drinking-122454211.html
Southern Hemisphere Rain Water test Report For November 2015
Considering the rainfall for October (77mm) and November (76mm) were very similar, the amount of Pb-210 detected for November 2015 was significantly greater than October. This suggests there was a lot more Radon-222 in the air here at Caloundra, during November.
Location Map
http://sccc.org.au/monitoring/Australian-Map.jpg
Rain Water Filter Test Chart
http://sccc.org.au/wp-content/uploads/2015/12/Down-pipe-November-paper-filter-031215-TV67-22c-84905-B.png
Southern Hemisphere Background Radiation Report For November 2015 (Full Report)
Monitoring Station Locations
http://sccc.org.au/monitoring/Australian-Map.jpg
At the beginning of November and again on the 14th November, a 40%+ increase in day average backgrounds levels were detected at my location on the East Coast Of Australia, near Brisbane. Tests were conducted to try an establish the source of the elevated background.
There were evening storms on the 14th, during one of these elevated background events, so a car rain swab was collected on the morning of the 15th November. The rain had been sitting on the car overnight. A scintillator test of it was started on the afternoon of the15th. It was tested for ~24 hours.
Radon is formed in the normal radioactive decay of Thorium which produces Radon-220, and Uranium which produces Radon-222. Both of these different Radon isotopes decay slowly into lead.
In the test chart you will see isotope maker peaks for Lead Pb-212 and an X-ray at 77 keV. These are decay daughters of Radon-220. This suggests that Thorium-232 was the source. There are also traces of Lead Pb-210, and Potassium-40. Lead Pb-210 is the decay daughter of Radon-222. This means there was also some Radon-222 in the air at the time.
The test detected trace amounts of Th-232 decay daughters, so the rain swab test chart only shows the tops of the main Th-232 decay daughter and X-ray peaks. A Thorium gas mantle test shows the main Thorium Th-232 decay daughter peaks. I have provided it as a reference. As you can see from the gas mantel test, the equipment here can separate the combined X-ray daughter peak around 89/90 keV, from the main 77 KeV peak.
November 15th Rain Swab Chart.
http://sccc.org.au/wp-content/uploads/2015/11/Rainswab-151115-TV67-22c-85854-B.png
Thorium Mantel Chart for Comparison
http://sccc.org.au/wp-content/uploads/2015/04/Thorium-mantle-TV67-calibration-110415-3000.jpg
Where is the Thorium-232 coming from?
Sources of atmospheric releases of Thorium-232 could be the recent Indonesian, New Zealand or South American volcanic eruptions, or a mining operation somewhere? There is a lot of volcanic activity in the Southern Hemisphere at present. Because the elevated detections where detected along the entire Eastern Coast of Australia, by numerous private monitoring stations, I am leaning towards volcanic activity, rather than a mining operation.
Cairns November 2015 Report – “After several months of very flat readings, last month had a number of peaks, with the increase starting the last week in October. It appears, the peaks coincide with higher altitude wind coming from the inland and usually very hot days.”
As you can see from the comparison chart below, Cairns had much more dynamic swings in background than Caloundra for November.
Cairns is red in this chart and Caloundra is yellow.
http://sccc.org.au/wp-content/uploads/2015/12/Cairns-Caloundra-comparison-for-November-2015.jpg
My opinion is that the November 2015 elevated detections are a combination of,
1. The increased background we get every year in the warmer months, as a result of Fukushima equatorial breakthrough.
+
2. An increase from recent Southern Hemisphere volcanic activity.
The local November month average background radiation for November 2014, 2013, and 2012, works out to 0.130 uSv. The volcanic activity, or whatever source created the recent increase, appears to have increased the November 2015 month average local background to 0.137 uSv.
These measurements are recorded by a GammaScout Alert Geiger counter, logging every 60 seconds. The data is downloaded and turned into a day average chart, and eventually a month average chart.
Here are month day average charts for November 2015, 2014, 2013, and 2012, local background radiation levels.
Day Average Chart November 2015
http://sccc.org.au/wp-content/uploads/2015/11/Caloundra-local-average-background-radiation-levels-November-2015.jpg
Day Average Chart November 2014
http://sccc.org.au/wp-content/uploads/2014/11/Caloundra-local-average-background-radiation-levels-November-2014.jpg
Day Average Chart November 2013
http://sccc.org.au/wp-content/uploads/2013/11/Caloundra-local-average-background-radiation-levels-November-2013.jpg
Day Average Chart November 2012
http://sccc.org.au/wp-content/uploads/2012/11/Caloundra-local-average-background-radiation-levels-November-20121.jpg
More details can be found here,
http://sccc.org.au/archives/2630
Disclaimer: This is an amateur volunteer run service. Human error can provide incorrect information, and equipment malfunction can produce false readings. Do not rely on, or take action upon information presented here, without further research.
Happy Thanksgiving to all!!!.
External ambient gamma levels at 10 microrems/hour for gamma at ground level at 2:40pm.
Hector
Instrument: Wm B. Johnson and Associates GSM-501
cal: Jun 2015
Re: EPA Monitors
I am pretty sure it’s been said here before over the last four years, but I’ll say it again.
When, at some point, most of the EPA Rad Monitors are turned off or said to no longer function it will be a sad day.
What’s next? Controlling media so much that most people don’t realize that there are TRIPLE ongoing MELTDOWNS in Fukushima… that have been spewing FALLOUT to the atmosphere and sea for 1718 days nonstop.
😐 [sarc]
________________________
➡
Here’s a new site where some regular Web Cam watchers are posting observations. Creating different categories of observation and historical cam related archives.
There’s a screenshot of a multicolored ‘flying spark’ above Fukushima.
(credit user Horse) This user has observed as many as 15 of these per hour.
http://caferadlab.com/thread-230-post-828.html#pid828
Side note: The roof has been fully removed from Unit 1.
IMO – I think these ‘spark’ observations may be like a giant Jacob’s Ladder due to gases, moisture, and ionization factors.
http://www.paleotechnologist.net/?p=2501
https://upload.wikimedia.org/wikipedia/commons/7/7a/Electric_arc.jpg
23rd November 2015 – Ukraine nuclear power plants ‘dangerously’ without power as towers feeding energy to Crimea blown up
Extract:
The apparent act of sabotage in Ukraine’s Kherson region forced an emergency power unloading at several Ukrainian nuclear power plants, which can be extremely dangerous, according to the first deputy director of Ukraine’s energy company Ukrenergo, Yuriy Katich.
Comment:
Independent of the politics, this is a very dangerous situation for the whole of Europe. Nuclear fallout does not recognize national borders, or political beliefs.
https://www.rt.com/news/323060-ukraine-nuclear-plants-danger/
BETA BLIND
We have reviewed the Wall Street Journal article “Radiation Sensors in Major U.S. Cities Turned Off Because They Don’t Work” and it indeed provides a great deal more information about this crucial early-warning system that EnviroReporter.com had organized into a usable fashion in RadNet Air Monitoring until it was unceremoniously cut off.
“A national radiation-monitoring system enhanced after the Sept. 11, 2001, terrorist attacks isn’t working as intended, with nearly three-quarters of stations not checking for a type of radiation in real time, including ones in New York, Chicago and Los Angeles,” the WSJ piece begins. “Environmental Protection Agency officials confirmed 99 of 135 beta-radiation sensors in its RadNet system … aren’t working and have been turned off. Officials blame electromagnetic interference from sources such as cellphone towers and said efforts to resolve the problem have been unsuccessful.”
It took until 2015 for EPA to pull the plug on a system that didn’t work right since 2001? That begs credulity. But if that is true, it speaks to years of incompetence and indifference through both Democratic and Republican administrations.
“EPA officials said the beta-detection problem cropped up in 2006 when they started putting the real-time monitors into the field,” which, again, sounds dubious. How is it that the beta-detection worked fine from 2001 to 2005 with no apparent problem yet once put “into the field” they failed to work? More malarkey. No explanation for this dubious claim that doesn’t explain how and where this monitors first worked wherever they were stationed. If, however, the problem was shielding against outside interference, why not just increase the shielding?
One apparent problem is that the reporters, bright gents from all accounts we’ve heard, don’t understand how radiation works entirely therefore don’t report the story accurately. Take this sentence: “In instances where only a beta emitter is present, the lack of a working monitor could leave officials unaware of potentially dangerous levels of contamination, they added.” Folks, there are NO places where only a beta emitter is present as gamma radiation is everywhere. It’s what makes up cosmic radiation, radiation from the Sun among other things.
WSJ‘s radiation explanation then expands into more completely false explanations which, naturally, lead to false conclusions. Check the next three sentences out with our critiques in [brackets]: “Gamma- and beta-emitting radionuclides can be carried by the wind long distances from a nuclear event, such as an explosion or power-plant accident [FALSE – gamma radiation is an energy, not a particle, and can’t be “carried by the wind]. Gamma rays from those radionuclides can then travel hundreds of feet or more and penetrate objects [FALSE – gamma travels huge distances, in the millions of miles, not hundreds of feet], including human tissue, according to federal government websites [Really? Which government websites exactly?]. Beta particles generally travel only several feet from their emission source [FALSE – beta particles radiate an inch or two out from the source at most but can be transported around the globe via air, dust and water]. While they can penetrate skin, their main health threat comes if inhaled or ingested in tainted food or water [True].”
While EnviroReporter.com finds it tedious to critique the inaccurate work of other news media, this particular article demands further analysis due to our relationship to this very important subject. And, to be sure, the piece has some excellent information in it when not crippled by unsound science. For example this puzzler: “Officials said they don’t know why some beta monitors still work, including locations in Phoenix, Dallas, Pittsburgh and Washington, D.C.” We know why they still work – they are maintained properly and are switched on.
Now even if the reporters aren’t radiation experts, surely they should have known that the following reported quote clearly doesn’t pass the smell test: ““We can confidently say that this system is fully capable now and fully operational now with the current monitors it has to detect fairly minute levels of radiation,” said Jonathan Edwards, director of the EPA’s radiation protection division.” But the article says that the beta monitors have been turned off – the import of the piece – so how could Edwards’ bold assertion not be called out? Reporting isn’t just serving up quotes; it’s also about analysis such as noting nonsense spun to cover screw ups.
There’s unfortunately more. “EPA officials acknowledged that one major radionuclide—strontium-90, which can get into people’s bones—emits only beta particles. However, they said, an event releasing a large amount of strontium-90 would also release large amounts of gamma-emitting radionuclides that could be picked up.” How in the heck does that work? WSJ says Sr-90 “emits only beta particles” yet, with enough of it, it emits gamma? The fact is it is always emitting gamma in its atomic decay chain.
At this point, it bears noting that the beta, not gamma, signatures of dangerous man-made radionuclides, like strontium-90 and cesium-137, are what tell us if there is something afoot in the air, like a triple meltdown in Japan or a dirty bomb attack in the United States. But even costing only $2 million for EPA “fixed” monitors, which include beta detecting machines, out of an $8.1 billion annual budget, means nothing to the agency according to the article. “Not having the beta monitor is absolutely not a concern of ours,” said John Griggs, director of the EPA’s National Analytical Radiation Environmental Laboratory. Wow.
The rest of the article is accurate, and chillingly so. WSJ faithfully reports a number of convoluted EPA explanations why its radiation detection system is an abysmal failure yet is still world class. The article ends with “The EPA, in a response, said it remains “dedicated to protecting public health and the environment through the use of sound radiation science.””
When there is no data, there is no science, sound or unsound. When the federal agency that is supposed to monitor for dangerous mostly beta radiation in a world that includes terrorist organizations dedicated to America’s destruction like ISIS blows off its responsibilities, people in charge of that agency should be shown the door. They won’t be, though, and RadNet will stay dark and America will remain beta blind.
For two years, EnviroReporter.com was able to show you the barely functioning beta and gamma monitors of EPA’s RadNet so you would know what’s hot and what’s not. We apologize that you – and us – no longer have access to that life-saving information. Now at least you know why.
16th October 2015 – Nuclear waste leaves France for Australia
Extracts:
‘Areva, almost bankrupt, are using a dustbin ship to carry waste, without any serious inspection!’ Denis Baupin a senior lawmaker with the French green party, tweeted shortly before the ship left port.
Yannick Rousselet of Greenpeace France said the ship ‘should not be used’ to carry the nuclear waste, while Nathalie Geismar from Robin des Bois said other ports had found a “staggering number of flaws” in the ship.
http://www.skynews.com.au/news/world/europe/2015/10/16/n-waste-ship-leaves-france-for-australia.html
21 November 2015 – Indon to ‘block Aust-bound nuclear waste’
Extract:
INDONESIA’S Navy and police reportedly want to close their waters to a ship carrying nuclear waste bound for Australia.
“WE will block the ship because nuclear waste is very dangerous,” sea security coordinating agenda head Vice Admiral Desi Albert Mamahit told The Jakarta Post newspaper.
Comment:
I found most major news outlets in Australia are using this strange truncated head line, Indon to ‘block Aust-bound nuclear waste’. How can these news outlets be considered independent, when they use the same headline!
http://www.couriermail.com.au/news/breaking-news/indon-to-block-aust-bound-nuclear-waste/story-fnihsg6t-1227617732008?nk=298dd5f7f7fa674c758c384bb69c1abf-1448151099
20th November 2015 – Indonesia to close seas to ship transporting nuclear waste
Extract:
Desi said that MV Trader passed through Indonesian waters three months ago when it sailed from Australia to France. “Our ships are on standby, although the ship is still far from Indonesia. We have information about the ship,” he said.
If MV Trader passed through Indonesian’s sea territory, he said, it had the potential to pollute the country’s waters.
http://www.thejakartapost.com/news/2015/11/20/indonesia-close-seas-ship-transporting-nuclear-waste.html
Extreme UV levels here in Australia at present.
I suggest monitoring your local UV levels, as well as local radiation background now.
Chart of present Extreme local UV levels. ( Australians can find their local UV level information here, http://uv.willyweather.com.au/ )
http://sccc.org.au/wp-content/uploads/2015/11/UV-November-18th-to-20th-2015.png
Why are UV levels going so high?
The article below has a possible explanation. You will also find links to country based UV monitoring stations in this article.
Planetary Thermal Imbalance & Extreme UV Levels
http://www.sccc.org.au/extreme-uv-levels-in-summer
————————————————————–
Caloundra Early November 2015 Rain Water Test Report – At the beginning of November and again on the 14th November, elevated backgrounds levels were detected at my location on the East Coast of Australia, near Brisbane. Tests were conducted to try an establish the source of the elevated background.
http://sccc.org.au/wp-content/uploads/2015/11/Caloundra-local-average-background-radiation-levels-November-2015.jpg
There were evening storms on the 14th, during one of these elevated background events, so a car rain swab was collected on the morning of the 15th November. The rain had been sitting on the car overnight. A scintillator test of it was started on the afternoon of the15th. It was tested for ~24 hours.
Radon is formed in the normal radioactive decay of Thorium which produces Radon-220, and Uranium which produces Radon-222. Both of these different Radon isotopes decay slowly into lead.
https://en.wikipedia.org/wiki/Thoron
In the test chart you will see isotope maker peaks for Lead Pb-212 and an X-ray at 77 keV. These are decay daughters of Radon-220. This suggests that Thorium-232 was the source. There are also traces of Lead Pb-210, and Potassium-40. Lead Pb-210 is the decay daughter of Radon-222. This means there was also some Radon-222 in the air at the time.
The test detected trace amounts of Th-232 decay daughters, so the rain swab test chart only shows the tops of the main Th-232 decay daughter and X-ray peaks. A Thorium gas mantle test shows the main Thorium Th-232 decay daughter peaks. I have provided it as a reference. As you can see from the gas mantel test, the equipment here can separate the combined X-ray daughter peak around 89/90 keV, from the main 77 KeV peak.
November 15th Rain Swab Chart.
http://sccc.org.au/wp-content/uploads/2015/11/Rainswab-151115-TV67-22c-85854-B.png
Thorium Mantel Chart for Comparison
http://sccc.org.au/wp-content/uploads/2015/04/Thorium-mantle-TV67-calibration-110415-3000.jpg
Where is the Thorium-232 coming from?
If it was from Fukushima, I would expect to see other Fukushima isotope markers present. Sources of atmospheric releases of Radon-220 could be the recent Indonesian, New Zealand or South American volcanic eruptions, or a mining operation somewhere? There is a lot of volcanic activity in the Southern Hemisphere at present. On the Emergency and Disaster Information Service map, you can see the locations of erupting volcanoes in South America, New Zealand and Indonesia.
http://hisz.rsoe.hu/alertmap/index2.php
Because the elevated detections where detected along the entire Eastern Coast of Australia, by numerous private monitoring stations, I am leaning towards volcanic activity, rather than a mining operation.
—————————————————————–
Southern Hemisphere October 2015 Rain Water Test Report.
As usual, Lead Pb-210 and Beryllium Be-7 were the main isotopes detected in the rainwater filter. Rainfall for October was 77 mm.
http://sccc.org.au/wp-content/uploads/2015/11/Down-pipe-October-paper-filter-121115-TV67-22c-84904-B.png
Disclaimer: This is an amateur volunteer run service. Human error can provide incorrect information, and equipment malfunction can produce false readings. Do not rely on, or take action upon information presented here, without further research.
Southern Hemisphere November Background Increase.
Summary:
There was a general increase in background levels detected by multiple stations in the Southern Hemisphere, in early November. In local rain swab tests, trace amounts of Iodine-129 and Lead-210 where detected, plus Radon-220 and Radon-222 washout decay daughters. The live Radon monitor reached a peak of ~ 1.8 pCi/Lt on the 14th November, during the storm event.
November 2015 Multi Station Detailed Reports:
Alert Caloundra 3rd November 2015 – It was 42% above pre-Fukushima average level on the 3rd November. This is the first alert level since March 2015.
Note: This alert code system here, is not based on any official government alert system. It is one set up by the station operator to indicate significant local increases.
http://sccc.org.au/what-does-each-step-in-the-alert-level-colour-code-mean
From previous testing, when we reach alert levels here, rain events can cause large radon washouts. We haven’t seen any studies on the heath effects of being exposed to very large Radon washouts. It is suggested, if possible, to stay out of the rain when we have local monitoring station alert levels, and if you do get wet, have a shower when you get home.
http://sccc.org.au/wp-content/uploads/2014/10/Radon_Info_ENG.pdf
Day average background level chart,
http://sccc.org.au/wp-content/uploads/2015/11/Caloundra-local-average-background-radiation-levels-November-2015.jpg
Dunedin New Zealand Report 4th November – “What is going on? Levels here from 0.8 to 1.6 pico Curies per litre, and rising …” This is a live Radon monitor detection.
Caloundra 8th November 2015 – Conducting a maintenance check on the GammaScout Geiger counter that is used to collect the day average background here, to confirm that these recent local elevated November detections are not caused by equipment fault, or from dust contamination.
I did find a small white fleck of material on the mica window which I brushed off with a very soft brush. I also cleaned out the whole unit, plus cleaned around the location where GammaScout is located. I also checked all the circuitry for damage, and the possibility that an insect got fried in the high voltage circuit area. An insect short would cause circuit malfunction, and erroneous detections. It all checked out OK. The next data download on the 9th November may confirm if the background elevation was caused by dust contamination, or from the particle found on the mica window.
Caloundra 9th November 2015 – The 24hour chart for the 8th shows a drop in background around 8.30am, after the monitoring Geiger counter was cleaned. Unfortunately there was a significant change in wind direction at the time. Wind started coming from the South, where as before it was manly from the North.
Therefore it is not conclusive at this time, if the Geiger counter cleaning, or the wind change caused the significant drop in background levels, from a day average of 0.148 uSv/hr on the 7th to 0.133 uSv/hr on the 8th.
Cairns 9th November 2015 Report – “My readings in Cairns for yesterday also went up to 0.147 uSv/hr. Will keep an eye on it and will let you know of further development.”
Cairns 10th November 2015 Report – “The reading for Cairns yesterday increased further to 0.166 uSv/hr. The highest reading since Jan this year. I am charging the battery at the beginning of each month, so that should eliminate any problems with that. Will keep you informed about further development.”
Cairns is red in this chart and Caloundra is yellow.
http://sccc.org.au/wp-content/uploads/2015/11/Cairns-Nov-15.jpg
Cairns 11th November 2015 Report – “Yesterdays reading was down to normal again at 0.125uSv/hr.”
Alert Caloundra 14th November 2015 – It was 43% above pre-Fukushima average level on the 14th November. There were a series of thunder storms that passed over the area, followed by heavy rain, that came from the South West in the evening. The local live monitors here showed elevated background levels for most of the day. When the storms passed over, the background level peaked.
Southern Hemisphere updates can be found here,
http://sccc.org.au/archives/2630
Disclaimer: This is an amateur volunteer run service. Human error can provide incorrect information, and equipment malfunction can produce false readings. Do not rely on, or take action upon information presented here, without further research.
vital1 – Thanks and yes I did get your reply. Thanks so much for your consideration. Fukushima and nuclear power in general, is such a scourge on our planet, I fear for all life on earth because of it.
Bob, I posted a reply to your query in EnviroReporter’s Radiation Food Lab.
To All,
Is there any way to verify the information contained in this article? It basically states that the real reason for cancelling the Dungeness crab season is radioactive contamination of the crabs, not domoic acid contamination as the State suggests. The also claim all Alaska salmon and other fish are now cancerous and should not be ingested. Here is the link.
http://superstation95.com/index.php/world/item/505-california-shuts-down-commercial-crab-season-indefinitely-cites-naturally-occurring-toxin-but-real-culprit-is-radiation
Thanks.
8th November 2015 – Chris Busby; Fukushima Thyroid Cancer- The Royal Swedish Academy of Sciences
Extract:
Sweden, like all European States is subject to the EURATOM Basic Safety Standards Directive which contains a clause, an amendment by the European Greens in 1996 at the suggestion of Busby, Alice Stewart, Alexy Yablokov and Rosalie Bertell.
It states that if “New and important Evidence” emerges that the risk model is wrong, all practices involving radiation exposure in the EU must be Justified all over again. Here, Chris Busby attacks the risk model and those who had presented extremely biased science throught the day of the symposium.
He draws attention particularly to the recent publication in the journal Epidemiology which reports 120 thyroud cancers in 380,000 children living near Fukushima. This shows an error in the ICRP model of 2600 times.
Troubling indications of re criticality at Fukushima.
http://enenews.com/former-japan-ambassador-uncontrolled-nuclear-chain-reactions-suspected-fukushima-troubling-indications-recurring-criticality-tellurium-132-detected-100-miles-plant-recriticality-issue-discussed
Here are updates on the serious situation at the St Louis West Lake Landfill fire, and Cold Water Creek contamination.
15th October 2015 – Regional West Lake Landfill CommUnity Meeting.
Extract:
Monthly Meeting of Citizens to discuss information about West Lake Landfill (Radioactive Nuclear Waste) and Bridgeton Landfill (Fire). This month the discussion was on the Missouri Attorney General Chris Koster’s document release, review research of forest fires in Chernobyl and how to prepare for an emergency, whether that is a Shelter in Place or Evacuation.
The West Lake land fill is not the only seriously contaminate location in St Louis, Cold Water Creek is another hot area.
28th October 2015 – Residents in St Louis dying in record numbers from World War II radioactive waste
Extract:
Soon enough, one little Facebook page grew from simply getting back in touch, to the alarming realisation that more than 2700 residents reported rare incidents of illness. This was becoming a cancer cluster of epic proportions: 45 cases of appendix cancer, 184 cases of brain cancer, 315 cases of thyroid cancer, 448 cases of auto-immune disease, and so on.
“The rates of appendix cancer, for instance, which is relatively rare — we see about 800 cases across the nation per year. To find seven or eight cases in one zip code or one small geographic area is rather unusual.”
http://www.news.com.au/technology/environment/residents-in-st-louis-dying-in-re
28th October 2015 – 4.5 microSv/h, Koriyama city Incineration plant road side mud
Extract:
Cesium have a low boiling point. Aprox.700 degrees Celsius, 1300 degree Fahrenheit. Garbage incineration easily make Cesium gasification.
Comment:
Japanese Madness, incinerating contaminated waste just spreads the contamination into local communities.
These are very high detections, passing cars, wind and rain will spread this contamination far and wide!
25th October 2015 – Radioactive Dump That Burned in Nevada Had Past Troubles
Extract:
A soundless 40-second video turned over by US Ecology to state officials showed bursts of white smoke and dirt flying from several explosions on Oct. 18 from the dump in the brown desert about 110 miles northwest of Las Vegas.
Comment:
Poster pinksailmatt, in the radiation detection forum, on enenews.com, posted this detection he found on RadNet Las Vegas Nevada. The spike occurred just after the explosion at the radioactive dump site.
Here are the RadNet Las Vegas Nevada readings for the past few days.
Notice the spike on the day of those radiation dump explosions.
These CPM’s were ALL energy levels combined for Gamma.
10/17/2015 11:25 / 3703 CPM
10/18/2015 2:28 / 3458 CPM
10/18/2015 19:32 / 4403 CPM – Spike!
10/19/2015 13:35 / 3384 CPM
10/20/2015 12:40 / 3456 CPM
10/21/2015 11:44 / 3587 CPM
10/22/2015 14:50 / 3615 CPM
10/23/2015 17:55 / 3726 CPM
So they had a 1000 CPM spike in total gamma.
About 30% Higher than norm.
http://www.nytimes.com/aponline/2015/10/25/us/ap-us-radioactive-waste-plant-fire.html?_r=0
USA
21 October 2015 – The threat of low-level radiation
Extracts:
NORTH ST. LOUIS COUNTY, Mo. — A study released Wednesday by the World Health Organization said long-term exposure to radiation — even low levels — can dramatically increase the risk of dying from cancer.
Using social media, the neighbors said they’ve documented more than 2,700 cases of cancer, auto-immune diseases and tumors in their area.
Comment:
The St. Louis County and Santa Susana Field Lab sites are clear examples of how radioactive waste in the environment can cause death and illness in large numbers of people living in nearby communities!
The sins of the past affect present, and future generations.
http://www.cbsnews.com/news/is-radiation-to-blame-for-st-louis-county-cancer-cases/
USA
8th October 2015 – Underground fire 300 meters from nuclear waste causes St. Louis to hatch contingency plan
Extracts:
ST. LOUIS – Beneath the surface of a St. Louis-area landfill lurk two things that should never meet: a slow-burning fire and a cache of Cold War-era nuclear waste, separated by just 300 meters.
Although the fire at Bridgeton Landfill has been burning since at least 2010, the plan for a worst-case scenario was developed only a year ago and never publicized until this week, when St. Louis radio station KMOX first obtained a copy.
http://www.japantimes.co.jp/news/2015/10/08/world/st-louis-girds-catastrophic-event-underground-fire-burning-since-10-get-near-cold-war-nuke-waste-cache#.VintTZfhntQ
Southern Hemisphere September 2015 Rain Water Test Report.
The test equipment has had an upgrade.
For testing until now, a Gamma Spectacular GS-1100A sound card spectrometry driver was plugged into the mic input of a laptop. This laptop mic input could only sample the test signal up to 96K 16 bit. A external Xonar USB sound card is now being used instead of the standard laptop microphone input.
This means the test signal can now be sampled at 192k 24 Bit. This has resulted in a significant improvement in sensitivity, particularly at low keV energies.
A paper towel rain filter design was used again this month, rather than the polyester filter used previously. This paper towel filter was sun dried for a longer period than last months filter, so it had less moisture content when tested.
Filter Design: http://sccc.org.au/down-pipe-filter-design
As usual, Lead Pb-210 than Beryllium Be-7 were the main isotopes detected rainwater filter. Rainfall for September was 59 mm.
http://sccc.org.au/wp-content/uploads/2015/10/Down-pipe-September-paper-filter-131015-TV67-20c-84600-B.png
Previous Rain water and soil tests can be found here.
http://sccc.org.au/pages/The-Food-Lab.html#Local_Rain_Water
Thought you might be interested in this ->
An article in today’s Wall Street Journal: “Radiation Sensors in Major U.S. Cities Turned Off Because They Don’t Work”
http://www.wsj.com/articles/radiation-sensors-in-major-u-s-cities-turned-off-because-they-dont-work-1445276241
Unfortunately, we can’t read the entire article because it requires payment, but it’s interesting that the mean stream media is reporting on this, isn’t it?
Cs-134 detection in air Finland!
15th October 2015 – Environment Pollution in Finland on Thursday, 15 October, 2015 at 10:32 (10:32 AM) UTC.
Extract:
Radiation and Nuclear Safety Authority of Finland (STUK) has detected a small amount of radioactive substances in the air in the Finnish capital of Helsinki, reported Finnish daily Helsingin Sanomat has reported. The abnormal amount of radioactive substances, including manganese (Mn-54), cobalt (Co-60), and cesium (Cs-134 and Cs-137), were found in early October in samples collected from the city by a STUK’s monitoring station located in northern part of Helsinki.
Comment:
The detection of Cs-134 means that the nuclear event that created this was recent!
http://hisz.rsoe.hu/alertmap/site/index.php?pageid=event_desc&edis_id=ED-20151015-50503-FIN
3rd October 2015 – Pt. 2 – Fukushima Contamination – Dr. Tim Mousseau
Extract:
“Bio-Impacts of Chernobyl & Fukushima”
Evolutionary biologist Dr. Tim Mousseau shares findings from his unique research on the biological effects of radiation exposure to wildlife from the nuclear disasters at Chernobyl & Fukushima.
Comment:
The extensive independent research information provided in this video presentation by Dr. Tim Mousseau, destroys the myth promoted by the nuclear industry that radioactive contamination has little effect on local wildlife.
The nuclear industry has promoted the idea to the public that the Chernobyl exclusion zone has become a lovely nature reserve, where animals run free and wild. This is clearly a made up fantasy, in an attempt to hide the long term consequence of nuclear contamination on the environment.
Southern Hemisphere Background Radiation Report For September 2015
September 2015 Summary
September 2015 monthly average background radiation level was 5% above the pre-Fukushima average. This is considerably lower than the September 2012 and 2013 average.
Caloundra Australia September day average chart:
http://sccc.org.au/wp-content/uploads/2015/09/Caloundra-local-average-background-radiation-levels-September-2015.jpg
September average for 2014 was 5% above the pre-Fukushima average.
September average for 2013 was 15% above the pre-Fukushima average.
September average for 2012 was 13% above the pre-Fukushima average.
Cairns Report:
Cairns is on the east coast of Australia, and it is much closer to the equator than Caloundra, see location map.
http://sccc.org.au/monitoring/Australian-Map.jpg
Here is the Caloundra and Cairns September day average background comparison chart.
Thanks again to the Cairns station operator for this report, and chart.
“The readings stayed close to my baseline of 0.125 uSV/hr for the whole month. Glad, nothing of significance to report. Yours also look pretty parallel to mine.”
In the chart, Cairns is red and Caloundra yellow.
http://sccc.org.au/wp-content/uploads/2015/10/Cairns-Caloundra-comparison-for-September-2015.jpg
————————————————————————
The Caloundra year average charts show a consistent seasonal variation in background levels since Fukushima. Most of the equatorial barrier air flow break through between the Northern and Southern hemispheres, happen in the warmer months. On this page you will find all the month and year average charts for local background radiation levels, from November 2007 to 2015 for Caloundra.
http://sccc.org.au/yearly-average-background-radiation-levels
Disclaimer: This is an amateur volunteer run service. Human error can provide incorrect information, and equipment malfunction can produce false readings. Do not rely on, or take action upon information presented here, without further research.
😐
Observation from the Fukushima Webcam:
Spark phenomenon – The number of colored flying sparks/bolts seen has increased since the beginning of this year.
➡ This is one of the best shots I’ve ever seen of this issue.
Multiple trails and colors during daylight.
http://s87.photobucket.com/user/HorseCam/media/02-27%20r1%20053230%20green%20flash_zpsw0vav2nu.png.html
IMHO – This phenomenon is not a camera anomaly.
They used to be very rare and happen only after earthquakes or extreme weather. Now it seems like they can sometimes be counted as to ‘how many’ per hour. That’s amazing! I am sure it means something. I just don’t know what. (?)
(can be viewed on youtube videos)
Who knows what may happen when containment(s) blow sky high, cores go rogue and toxic goo of all kinds mix and accumulate for years.
Maybe by 2020 the entire facility will look like a 4th of July fireworks display. 😉
Rain in Glendale Sept. 15th 2015.
Sample 36.1 CPM, Background 44.1 CPM
The sample was gathered from raindrops collected on leaves at 11:30 AM. The background reading was from the dry container and paper towel used to gather the rain drops. Looks like the rain added nothing to the count, so this rain from tropical moisture is uncontaminated.
@Chase et al: That wall looks missing around an opening and there seem emissions coming from the hole in the roof but we can’t quite make it out. We can’t see any spraying down the hole, though.
Is Unit One’s spent fuel pool steaming off its water and overheating? Sure looks like it. If so, a big uncontrollable series of events could ensue that will lead to a SFP fire that would become The Unforgettable Fire.
Please keep an eye on this, Chase, and thank you for telling fellow raddies about it.
😐
Observing smoke/steam emissions coming from the hole in the roof of Reactor 1 since 8 am Sept 10th jst. There is also a large panel on the west wall that looks charred. (?) This is something new.
A crane appears to be spraying something down the hole. ?
TEPCO Webcam: Unit 1
http://www.tepco.co.jp/en/nu/f1-np/camera/index2-e.html
Southern Hemisphere August 2015 Rain Water Test Report
I used part of a paper towel roll for the rain water filter this month, instead of the usual polyester wool filter. The theory is that it may capture more soluble material than the polyester wool. A test result similar to the polyester filter was observed, only very small traces of Lead-210 and Beryllium-7 were captured. The exception being that the cellulose and water content of the paper appeared to be filtering out very low energy X-rays.
A bit more rain fell this month compared to last month, 159mm for August.
This clean paper towel filter was tested in the lead shielded test chamber for 24 hours, and that test result was then used for background subtraction from the used filter test result.
Here is the test chart minus that background.
http://sccc.org.au/wp-content/uploads/2015/09/Down-pipe-August-paper-filter-030915-TV67-20c-84600-B-text.png
Disclaimer: This is an amateur volunteer run service. Human error can provide incorrect information, and equipment malfunction can produce false readings. Do not rely on, or take action upon information presented here, without further research.
@Dale: Not to worry…
That’s right, Dale, as you kindly pointed out to us this morning: Japan lifts evacuation order for town near doomed nuke plant.
Just 19 kilometers from three actively spewing melted nuclear reactor cores. That’s 11.8 miles or less than the distance from Radiation Station Santa Monica to downtown Los Angeles and slightly more than the distance between ‘DTLA’ and Radiation Station Glendale California.
All cleaned up, yes? If one were to judge from the numbers of Japanese returning to Naraha Japan, just 100 families of 2,600 households since a trial period of voluntary return begun in April 2015, the answer would be ‘no.’ But the Japanese government isn’t daunted especially since it has to show how normal things are, despite no salvaging of the lost cores deep underground irradiating the groundwater and Pacific Ocean with massive amounts of extremely dangerous radionuclides.
“Our clock started moving again,” Naraha Mayor Yukiei Matsumoto said at a Saturday ceremony held at a children’s park. “The lifting of the evacuation order is one key step, but this is just a start.” The mayor said that “fear” still remained as if that were the main problem. Wow, what incredible hubris and determined stupidity.
That fatal foolishness is not confined to Japan, as Dale pointed out in his comment. In late August 2015, the US Environmental Protection Agency cut off the beta graph feeds to the public that EnviroReporter.com had organized into a coherent monitoring system with our RadNet Air Monitoring. While EPA was kind enough to size their RadNet portal such that it fits our monitoring pages, unless you are expert at navigating the agency’s Byzantine and outdated system, you are beta out of luck. And so is the entire country (and its neighbors).
But wait! It’s all okay, right? After all, Japan is hosting the 2020 Olympics so it has to be all clear and back to business as usual. That business as usual is going to cost plenty.
Thank you Dale, our very own Dr Solar, for maintaining your excellent Radiation Station. We need it, and the other EnviroReporter.com Radiation Stations now more than ever.
RIP, Enviroreporter’s sweet links to RadNet’s Gross Beta Count graphs from selected RadNet locations. It used to be so easy, but now it is quite a chore. It’s still possible to pull the data, but it takes a long time using RadNet’s query function. Exasperating.
On another note, take a look at RadNet’s misleading graphical depiction of individual sampling sites spread across the nation.
http://www2.epa.gov/radnet/near-real-time-and-laboratory-data-state
All green dots, giving the impression that all sites are fully functioning, and every site is “clear”. We know from many previous reports on the Enviroreporter website, that RadNet is not fully functional. Radnet sites are frequently down or only partially functioning. Yet, the national status map on the RadNet site is all green (I haven’t actually clicked on every dot, but I doubt that all 134 sites are fully functioning). This probably means nothing more than its a marker for the site, and a link to the gamma chart for that site, if available.
That status map would look very different if down sites were grayed out, or colored differently to indicate non-reporting or partial reporting. RadNet’s depiction of the National Status map could be greatly improved.
➡ Low Flying Helicopter Over Pacifica (Bay area) This Week Sept 1, 2015
“The advisory comes from the National Nuclear Security Administration. The helicopter is equipped with gamma radiation sensors.”
” The survey is part of a study by the Department of Homeland Security Domestic NUCLEAR DETECTION OFFICE intended to help improve the ability to detect and measure radiation from the air, the agency said in a statement. The agency conducted a similar survey over the same areas in 2012, according to Berkeley city officials. ”
http://patch.com/california/pacifica/advisory-low-flying-helicopter-over-pacifica-week-0?utm_source=article-mostrecent&utm_medium=rss&utm_term=politics%20&%20government&utm_campaign=recirc&utm_content=aol
😐
Southern Hemisphere Background Radiation Report For August 2015
August 2015 Summary
More good news here at Caloundra, there haven’t been any significant upticks or events to report for months now, plus the background levels have stabilized. The background levels are not at pre-Fukushima levels, but close.
August 2015 monthly average background radiation level was 5% above the pre-Fukushima average.
August day average chart:
http://sccc.org.au/wp-content/uploads/2015/08/Caloundra-local-average-background-radiation-levels-August-2015.jpg
August average for 2014 was 4% above the pre-Fukushima average.
August average for 2013 was 8% above the pre-Fukushima average.
August average for 2012 was 9% above the pre-Fukushima average.
Caloundra and Cairns August day average background comparison chart – Thanks again to the Cairns station operator for this chart and report. Cairns is on the east coast of Australia, and it is much closer to the equator than Caloundra, see location map.
http://sccc.org.au/monitoring/Australian-Map.jpg
Cairns Monitoring Station Report:
“I noticed increasing readings in the last week of the month and got a lot of alarms set at 0.4 uSV/hr during the day.
I thought it might be a good idea to top up the battery charge, getting that many alarms.
As soon as I started to charge the battery, the alarms stopped immediately and the readings went back close to my baseline of 0.125 uSv/hr.
So I regard the last weeks increased readings as questionable, after observing the above behaviour.
You also might want to take notice of this particular equipment behaviour of the Gamma Scout Rechargeable for future reference.”
In the chart, Cairns is red and Caloundra yellow.
http://sccc.org.au/wp-content/uploads/2015/09/Cairns-Caloundra-comparison-for-August-2015.jpg
On this page you will find all the month and year average charts, for local background radiation levels from November 2007 to 2015.
http://sccc.org.au/yearly-average-background-radiation-levels
More detailed long term data can be found here.
http://sccc.org.au/archives/2630
Disclaimer: This is an amateur volunteer run service. Human error can provide incorrect information, and equipment malfunction can produce false readings. Do not rely on, or take action upon information presented here, without further research.
There is no indication of any Sendai meltdown according to the Safecast Tile Map today. In comments to his video rant, the poster Kevin Blanch writes “these rats;;;want a fight they have one with me I was a boxer a never defeated in 4 year wrestler, I know the over aggressive fools, the Nuclear crime rats , want to over leverage there lies, I counter punch at the exact right time in there fucking guts,, let them prf me wrong with there cover up lies,, they can’t, it works both ways you want to cover the truth, it will burn you and I am the one that lit the flame that knocked the nuclear liars the fuck out. Kevin”
That this rant has repeatedly found footing is astonishing. We reluctantly approved these comments with links to the videos for their entertainment value only.
RADIATION STATION HARRISBURG NC
Just found this .More on the possible SENDAI 1 Meltdown
ps…I left message 15 min ago and CANT find it!!!!!!! Will look further or repost another
ALERT!…..ALERT!….ALERT!!!!!!!!!!!
RADIATION STATION HARRISBURG NC
POSSIBLE PARTIAL MELTDOWN @ SENDAI..Japan…..Kevin Blanch
I took an outside AIR reading this morning @ 9:35 am……70.4 cpm……unusually high average reading which averages 38 cpm
Inside reading was 32.0 @ 9:47 am……Somethings up!!!
22nd August 2015 – 481,000 Bq/Kg of Cs-134/137 measured from earth of Minamisoma city.
Extracts:
The highest reading of Cs-134/137 was 481,000 Bq/Kg from moss and soil. The second highest reading was 222,000 Bq/Kg from the soil on the bridge.
Monkey’s excrement was also analyzed to detect 50,000 Bq/Kg of Cs-134/137. The second highest reading was 36,600 Bq/Kg.
Article and Links:
http://fukushima-diary.com/2015/08/481000-bqkg-of-cs-134137-measured-from-earth-of-minamisoma-city/
——————————————————————————————–
In March 2013, I was sent a resin encapsulated sample of black fungus like material, for testing. It reportedly came from somewhere in the Minamisoma area of Japan. This fungus like material started growing on the concrete and rock surfaces in Japan, after the Fukushima Nuclear Catastrophe. It appeared to be bio-accumulating Cesium.
For those of you who have not looked at a chart like this before, the position of the peaks in the chart indicate which isotopes are present. I placed a pen tip next to a photo of the sample, to give people a clear idea of just how small the sample was. The black sample material only filled up around two thirds of this small sample container.,
Test Chart
http://sccc.org.au/wp-content/uploads/2013/04/Minamisoma-Cesium-290313-TV45-23c-25040-MB.jpg
This black fungus material sample from Japan, contaminated with Cesium Cs-137 & Cs-134, was encapsulated in resin for safety reasons, so we don’t know how much it weighed. Visually, looking at the encased sample, it appeared to be a few grams, if that. A professional lab reported test results were 117 Bg of Cs-137 and 58 Bq of Cs-134.
I posted the test results on the Internet for discussion, and a weight expert posted this comment in 2013.
“I’m an expert on weighing objects (sell scales, use different ones daily, some precise to .01g). Fungus in that form does not appear to hold too much water weight and would likely weigh less than a gram given the scale. If it jis thin and flakey type fungus, it may be under .25-.5g. Is it thick like a mushroom cap or more like lichen? I’ve only observed extremely thin fungi growing on concrete, and I would err on the very low side. My best guess is 0.3g.”
My reply:
“That means the black fungus sample from Japan is very, very, hot.
Test results 117 Bg Cs-137 and 58 Bq Cs-134
117 + 58 = 175 Bq x (1000 grams/0.3 grams) = 583,333 Bq/Kg of Cesium
Even if it was 10 times greater in weight 3 grams, it would still be 58,333 Bq/Kg of Cesium.”
If the weight expert estimate of 0.3g is correct, then this was highly contaminated material!
You wouldn’t want your family living in an area with this amount of radioactive contamination! Any so called expert or government official, telling people it is safe for their families to live in highly contaminated areas like this, are criminally negligent in my opinion.
Monday, August 17, 2015
AIKEN COUNTY, S.C> (WRDW) — SRS confirms the lockdown has been lifted. SRS was on lockdown after a possible threat caused emergency response to the site. According to a release from SRS, an offsite law enforcement investigation found no explosive residue or device on inspected truck.
http://www.wrdw.com/home/headlines/Savannah-River-Site-322079422.html
17th August 2015 – Savannah River Nuclear Facility Under Lockdown Amid “Security Event”.
Extracts:
According to the Savannah River site, a potential security threat is in progress that has caused emergency response.
http://www.zerohedge.com/news/2015-08-17/savannah-river-nuclear-facility-under-lockdown-amid-security-event
The Pacific Ocean is dying! The huge amount of radioactive contamination, conservatively equal to 10,000 Hiroshima nuclear bombs, has been released from the Fukushima Nuclear Catastrophe site. The Fukushima nuclear catastrophe site is still releasing huge amounts atmospheric radioactive contamination, plus thousands of tons of highly radioactive contaminated water is still flowing into the Pacific Ocean every day!
There are an increasing number of media reports coming in, of Pacific Ocean fish, whales, birds and other sea creatures dieing in large numbers. The Fukushima radioactive contamination would be lowering the fertility and weakening the immune systems of any sea life coming in contact with it. As immune systems become weakened, it would be logical to expect viruses and bacteria that would normally be under check, to become more infectious. This radioactive contamination could also potentially stimulate viruses and bacteria to mutate into more infectious strains.
This massive amount of radioactive environment pollution has resulted in the Pacific Ocean food supply crashing! Hence the large number of reports of seals, whales and birds etc., washing up on the west coast of North America, starving to death.
Thanks to Dr.Sternglass, who passed away in early February, for this research paper below. It clearly demonstrates how Nuclear contamination from the nuclear bomb testing era caused a significant crash in Pacific Ocean fish stocks. If this was the case then, it would be logical to assume that the Fukushima Nuclear Catastrophe is having a similar effect.
Quote:
“The purpose of the study was to determine whether continued atmospheric testing by France and China or potential releases from underground detonations that might unexpectedly escape into the nearby fishing grounds could have detectable effects on the reproduction of fish populations similar to the unanticipatedly severe effects of low level radiation on the human embryo and fetus (2, 3, 4) recently confirmed by independent studies by other investigators (5, 6).”
08.10.1971 – Fallout and Reproduction of Ocean Fish Populations. E.J. Sternglass, Department of Radiology, School of Medicine, University of Pittsburgh, Pittsburgh, Pennsylvania
Extract:
Nuclear Fallout causes Fish Population Decline
As will be shown below, very large declines of fish-populations after low-altitude nuclear tests followed by a gradual recovery to pretesting levels have been observed both in the Atlantic and Pacific, strongly suggesting that the eggs of fish and the developing young are far more sensitive to internal radiation from low-level fallout than had been anticipated, very much as in the case of the human-embryo and fetus.
http://www.mindfully.org/Nucs/Fallout-Fish-Sternglass8oct71.htm
This is one of many informative reports you will find linked to in EnviroReporter’s Radiation Food Lab.
Southern Hemisphere July 2015 Rain Water Test Report
Station location
http://sccc.org.au/monitoring/Australian-Map.jpg
This short animation of Northern, and Southern Hemisphere air circulation, shows why we can get detections so far south.
Roof down pipe filter design for rainwater testing,
http://sccc.org.au/down-pipe-filter-design
32.5 mm rain fell in July, and the chart shows very small traces of the usual Pb-210 and Be-7. In this chart I have CPS on the Y axis to show activity, and have turned off Y log to show linear scaling. This is only a test chart of the polyester part of the rain water filter system design.
Chart normal view minus Background
http://sccc.org.au/wp-content/uploads/2015/08/Down-pipe-July-polyester-filter-020815-TV67-18c-87206-B.jpg
Disclaimer: This is an amateur volunteer run service. Human error can provide incorrect information, and equipment malfunction can produce false readings. Do not rely on, or take action upon information presented here, without further research.
RADIATION STATION HARRISBURG NC….8/6/2015
Quick 10 min. shower from W to E this afternoon.We are in a drought here…
1…277.1 cpm @ 2:35 pm
2…33.1 cpm @ 2:45 pm background
……8.37 x background
Will upload to YouTube shortly
Dear EnviroReporter,
Has anyone informed you and your readers that the Nuclear Regulatory Commission (NRC) is considering replacing the present “Linear No Threshold” radiation-dose model (which basically says there is NO safe dose of radiation) to something called HORMESIS, which is the idea that low-level radiation is “good for you.”
It gets worse.
There are 4 more recommendations they are considering.
” (1) Worker doses should remain at present levels, with allowance of up to 100 mSv (10 rem) effective dose per year if the doses are chronic.
(2) ALARA [As Low As Reasonably Achievable] should be removed entirely from the regulations. The petitioner argues that “it makes no sense to decrease radiation doses that are not only harmless but may be hormetic.”
(3) Public doses should be raised to worker doses. The petitioner notes that “these low doses may be hormetic. The petitioner goes on to ask, “why deprive the public of the benefits of low dose radiation?”
(4) End differential doses to pregnant women, embryos and fetuses, and children under 18 years of age. ”
What this means is that YOU can be exposed to as much radiation as a nuclear worker! And children and pregnant women will no longer have lower-dose protections. And that industry, etc. would no longer have to attempt to keep exposures to the public “As Low As Reasonably Achievable.”
The NRC is requesting that the public comment on this.
Everyone, PLEASE submit a comment telling your opinion/analysis of this.
If you prefer, here is where you can submit your comment anonymously:
http://www.regulations.gov/#!submitComment;D=NRC-2015-0057-0010
And you can learn more about the whole thing here:
https://www.federalregister.gov/articles/2015/06/23/2015-15441/linear-no-threshold-model-and-standards-for-protection-against-radiation
This is something you cannot and should not remain silent about because it can affect you, your family, your pet, your environment, etc.
Tell EVERYONE you know about this.
Thank you.
LOWEST NUMBER OF RADNET BETA STATIONS WORKING SINCE WE BEGAN LISTING STATIONS:
✓
“I want to make a difference on planet Earth, I want to BE THE CHANGE I wish to see in the world.”
– Bindi Irwin (now age 17)
“Me too!” 😉
– Chase (age 57)
Trouble In The Jungle
( a short rap song by Bindi)
“mankind is not so kind at all…” 😐
I found this yahoo news item about a major 20 ton piece of equipment being being removed successfully from a fuel pool at Fukushima’s wrecked Dai-ichi power plant reactor number 3. I’m glad to see there is progress, but 40 years to clean up and decommission? That is a very long time, and I don’t know if it will be long enough.
http://news.yahoo.com/fukushima-operator-says-20-tons-rubble-lifted-reactor-082425383.html
Southern Hemisphere Background Radiation Report For July 2015
July 2015 Summary
The good news is that local background levels here have stabilized, and there haven’t been any significant upticks, or events to report.
July 2015 monthly average background radiation level was 5% above the pre-Fukushima average.
July day average chart:
http://sccc.org.au/wp-content/uploads/2015/07/Caloundra-local-average-background-radiation-levels-July-2015.jpg
July average for 2014 was 5% above the pre-Fukushima average.
July average for 2013 was 5% above the pre-Fukushima average.
July average for 2012 was 9% above the pre-Fukushima average.
Caloundra and Cairns July day average background comparison chart – Cairns is on the east coast of Australia, and it is much closer to the equator than Caloundra, see location map.
http://sccc.org.au/monitoring/Australian-Map.jpg
In the background comparison chart, Cairns is red and Caloundra yellow.
http://sccc.org.au/wp-content/uploads/2015/08/Cairns-Caloundra-comparison-for-July-2015.jpg
On this page you will find all the month and year average charts, for local background radiation levels from November 2007 to 2015.
http://sccc.org.au/yearly-average-background-radiation-levels
Disclaimer: This is an amateur volunteer run service. Human error can provide incorrect information, and equipment malfunction can produce false readings. Do not rely on, or take action upon information presented here, without further research.
I am hopeful that no more old technology, high energy, fission style nuclear plants will be built. The costs are high, the risks are high, and the consequences of accidents are grave. With so much arguing against it, the only businesses willing to pursue it are those who stand to profit when governments are willing to take on the costs, risks, and consequences. Who would be foolish enough to enter into such a Faustian bargain? Of course, when governments partner with business under such terms, they gamble that the apathy and ignorance of the governed will allow the assumption of costs and risks which are too great for too long a period of time.
I think that the more likely outcome will be increasingly attractive alternate forms of energy generation. Naturally, we have great hopes for low density energy sources such as wind, solar, geothermal, tidal, and wave. All of that will help of course, but I don’t rule out that safer forms of nuclear power will eventually be developed. High and low energy fusion power plants will someday become feasible, and that’s when I think the equation will rebalance toward safer more sustainable nuclear energy sources. I’m hoping that unsafe fission plants will be replaced with safer fusion energy generation technologies. This will enable a more politically palatable conversion effort toward lower costs, lower risks, and both lower quantities of nuclear waste and less harmful forms of nuclear waste. Personally, I don’t think we are that far from such improved nuclear technologies. Let’s just hope it will be in time to avoid the next “Black Swan Event”.
@Chase: It is folly of astronomical scale that can and probably will kill the planet. The clock just keeps on ticking as Lights Out shows. There is no escaping it. Most of our species, the poorest of them, don’t even know what’s at stake – their and their children’s future. But they will suffer all the more. Denial of this Earthnocide by Man won’t change anything, won’t stave the crumbling of Nuclear Rome. The crimes against unborn humanity continue to mount. But as long as there is at least one voice of reason, like yours Chase, there is hope. The question becomes what to hope for and how to make it manifest in the most effective of forms.
The “Nuclear Deal” with Iran.
😡
Every time I hear the words ‘Nuclear Deal’ repeated it makes me grit my teeth in anger. There is no deal except for those who stand to profit.
Have Chernobyl and Fukushima’s TRIPLE MELTDOWNS been forgotten?
The only ‘Nuclear Deal’ that makes sense to me is the one where worldwide all Nuclear Power Plants are dismantled and banned from the planet. Now that would be a REAL DEAL. Anything less is an incalculable risk and a moral injustice against every living thing. Seems to me that should be clear to even the most simplest of minds.
We have free power all around us in the form of wind, waves and the sun to name a few. Harnessing these energies has always been right in front of us, yet we are sold/told that using Nuclear Power to boil water is somehow a good thing.
Nuclear Power in the USA
(Updated June 2015)
“Following a 30-year period in which few new reactors were built, it is expected that six new units may come on line by 2020, four of those resulting from 16 license applications made since mid-2007 to build 24 new nuclear reactors.”
http://www.world-nuclear.org/info/Country-Profiles/Countries-T-Z/USA–Nuclear-Power/
New Reactors Worldwide
(Updated May 2015)
“…over 60 reactors under construction in 15 countries.”
http://www.world-nuclear.org/info/Current-and-Future-Generation/Plans-For-New-Reactors-Worldwide/
Nuclear Power in the USA
(wikipedia)
“In August 2012, the US Court of Appeals for the District of Columbia found that the NRC’s rules for the temporary storage and permanent disposal of nuclear waste stood in violation of the National Environmental Policy Act, rendering the NRC legally unable to grant final licenses for any further new nuclear power plants.[174] This ruling was based on the fact that the Yucca Mountain waste repository had never received a license due to its license application being withdrawn by the DOE nor had any viable alternative waste repository been proposed. So long as this ruling stands and this impasse on waste disposal exists, no additional nuclear plants can ever be licensed for operation in the United States.”
So why are we still building/subsidizing new ones?
Nuclear Matters (how cute)
“As of 2014, the U.S. nuclear industry has begun a new lobbying effort, hiring three former senators — Evan Bayh, a Democrat; Judd Gregg, a Republican; and Spencer Abraham, a Republican — as well as William M. Daley, a former staffer to President Obama. The initiative is called Nuclear Matters, and it has begun a newspaper advertising campaign.”
https://en.wikipedia.org/wiki/Nuclear_power_in_the_United_States#Debate_about_nuclear_power_in_the_U.S.
@vital1: WOW! That is astonishing. That the Japanese government would allow this speaks volumes as it is their own people who are the glowing guinea pigs. It bears repeating that the California Highway Patrol, as documented on this website, considers anything 3 times background to be a Hazardous Materials situation which necessitates the appropriate protocols to protect life and property. This radiation reading, in a park in a country that will host the 2020 Olympics, is over 83 times the CHP’s Haz-Mat limits! Maybe the Shot Put competition could be held in this park. Call it the Hot Put.
@ Michael, “Most folks don’t know if this is a high level and its implications but a comparison to typical background would be illustrative.”
Thanks for pointing that out. Here in Australia where I am located, it would be 201 times our pre-Fukushima background, or 251 times greater than the Japan pre-Fukushima average background.
Needless to say, you wouldn’t want your children playing in a park with radioactive contamination detections that enormously high!
@vital1: What would be the normal reading range? Most folks don’t know if this is a high level and its implications but a comparison to typical background would be illustrative.
26th July 2015 – 20 μSv/h still detected in Fukushima city
Extracts:
On 4/23/2015, a citizen’s group detected 20.1 μSv/h in Fukushima city. It was in the river area of Abukuma-gawa river, where is open for everyone as a park.
It was over scale of the dosimeter tested by Ministry of the Environment so the radiation level was confirmed by scintillation survey meter TCS-172B.
http://fukushima-diary.com/2015/07/video-20-%CE%BCsvh-still-detected-in-fukushima-city/
Alert level on a Eugene Oregon private monitoring station at present, ~2200 cpm on,
http://radmon.org/
No stations near by on it, or any other networks, seem to be showing any elevated detections. Therefore it maybe just equipment malfunction, but as usual it maybe worth keeping an eye on it.
List of International live radiation monitoring stations.
http://sccc.org.au/international-radiation-monitoring-stations
Update:
M2.7 Explosion – 4km WNW of Junction City, Oregon report on USGS.
Time
2015-07-24 20:36:02 (UTC)
2015-07-25 06:36:02 (UTC+10:00) in your timezone
Times in other timezones
Nearby Cities
4km (2mi) WNW of Junction City, Oregon
24km (15mi) NW of Eugene, Oregon
28km (17mi) NW of Springfield, Oregon
36km (22mi) S of Corvallis, Oregon
80km (50mi) SSW of Salem, Oregon
Are the high radiation detection at Eugene Oregon and the USGS detected explosion 4km (2mi) WNW of Junction City Oregon related, I have no idea???
http://earthquake.usgs.gov/earthquakes/eventpage/uw61045402#general_summary
@All: From our friends at Physicians for Social Responsibility – Los Angeles
Date: Wednesday, August 5th
Time: 4PM sharp- A moment of silence will be observed at 4:15pm, so please arrive early
Location: Chain Reaction peace sculpture, 1800 block of Main Street at the Santa Monica Civic Center
Please join us on August 5th to remember Hiroshima and Nagasaki and grow the movement for a nuclear weapons free world.
On August 6th, 1945 (August 5 in North America), the United States dropped the first atomic bomb over Hiroshima, Japan, killing 130,000 people. Three days later, a second bomb exploded over Nagasaki, killing 70,000. Other countries developed their own nuclear weapons, and humanity became hostage to the ever-present threat of nuclear annihilation. Today, there are more than 15,000 nucelar weapons in the global nuclear arsenal, most of which are far more powerful than the bombs that devastated Hiroshima and Nagasaki. Whether by accident or intent, we remain at risk – and all that we hold dear hangs in the balance. Read more on our website.
Southern Hemisphere June 2015 Rain Water Test Report.
There was a lot of very fine organic material captured in the down pipe rain water filter in June.
Roof down pipe filter design for rainwater testing, http://sccc.org.au/down-pipe-filter-design
There was also a lot less Lead Pb-210 than Beryllium Be-7 in June’s rainwater filter test. In summer we tend to see much more Pb-210 detected in the rain water tests here, when the air masses tend to come from a northerly direction.
There was also a possible trace detection of Cesium-137. It was a very small detection, less than one Cesium-137 gamma ray detection every ~100 seconds. There was no corresponding Cesium-137 32 X-ray detection to help confirm that it was Cesium-137. At these low detection levels, the amount of low energy 32 keV Cesium-137 X-ray present, may be too small to be detected, so there is a degree of uncertainty to it being a definitive Cesium-137 detection.
Rainfall for June was 78.2 mm.
Less Pb-210 in the filter means less Radon-222 was in the air. This was also reflected in the local live Radon monitor.
http://sccc.org.au/wp-content/uploads/2015/07/Down-pipe-June-polyester-filter-dried-test-120715-TV67-18c-84612-B-text.png
Years of rain water tests can be found here.
Disclaimer: This is an amateur volunteer run service. Human error can provide incorrect information, and equipment malfunction can produce false readings. Do not rely on, or take action upon information presented here, without further research.
Not the most scientific of tests, but…
July 8– Ventura, CA 10 min exterior, about 1 mile inland: 48.6
July 9– Ventura, CA 10 min exterior, sitting on beach, 44.1
July 9– Ventura, CA 10 min testing of wet towels and bathing suits worn at beach, 42.0
Watched an ABC TV show called ‘The Whispers’ on Hulu.com. (free) Episode 4 – Meltdown
😐 The disinformation was obvious. Disturbing in a way.
The story line involves an NRC worker and an FBI agent. In short, in this episode, they are trying to stop a meltdown at a Nuclear Plant somewhere near DC.
After stating such things like… “we would have to evacuate a 6 mile zone”, (I almost laughed), and a couple of other played down numbers they then needed to flood the reactor with salt water and the one agent said “Oh, you mean like Fukushima.”
I was surprised they mentioned Fukushima at all, but then I thought about how, what they said and the way they said it, ‘implied’ that Fukushima didn’t meltdown because they saved it using this method.
🙄
Millions watch that show. They may now think they know something that’s been falsely planted in their brain without even realizing it.
Wow!
http://www.hulu.com/the-whispers
External gamma environmental levels in East Los Angeles at 9 microrems per hour at 9:00am on 7/10/15.
Instrument: Wm B. Johnson and Associates GSM-501
Cal: 6/15
The activists at Green Action Japan are urging folks to sign a Change.Org petition demanding that the Japanese government and Tokyo Electric Power Company stop gushing radioactive goo from the wrecked triple reactors at the Fukushima Daiichi nuclear power plant into the Pacific. While this petition is likely to have no effect on the situation, it is still important that EnviroReporter.com readers sign it as we did.
Sign Stop Radioactive Contamination of the Pacific Ocean from the Fukushima nuclear power plant site!
Not convinced it’s important because mainstream and so-called alternative media don’t cover this travesty? Then check out our Fukushima – The Perfect Crime? for an introduction into our comprehensive Fukushima investigation.
There are 694 signatures right now.
[As of July 14 at 8:21 am PDST, there are 1,855 signatures!]
Southern Hemisphere Background Radiation Report For June 2015.
Station location
http://sccc.org.au/monitoring/Australian-Map.jpg
This short animation of Northern, and Southern Hemisphere air circulation, shows why we can get detections so far south.
Roof down pipe filter design for rainwater testing, http://sccc.org.au/down-pipe-filter-design
June 2015 Summary
June 2015 saw a decrease in month average background levels compared to the last couple of years. June saw more Southern Ocean air reach this location, hence the lower background level. A number of significant solar radiation storms occurred in June. No significant increases in local background radiation levels were detected during these solar storm events.
June 2015 monthly average background radiation level was 3% above the pre-Fukushima average.
June day average chart:
http://sccc.org.au/wp-content/uploads/2015/06/Caloundra-local-average-background-radiation-levels-June-2015.jpg
June average for 2014 was 7% above the pre-Fukushima average.
June average for 2013 was 7% above the pre-Fukushima average.
June average for 2012 was 3% above the pre-Fukushima average.
Caloundra and Cairns June day average background comparison chart
Cairns is on the east coast of Australia, and it is much closer to the equator than Caloundra. It is much more likely to get Northern air flows during the cooler months than Caloundra, see location map.
Comment by Cairns station operator:
“The readings stayed fairly close to my longer term baseline of 0.125 uSv/hr. The solar events affecting earth around the 20th of June, did not have any noticeable influence on the readings.”
In this chart, Cairns is red and Caloundra yellow.
http://sccc.org.au/wp-content/uploads/2015/07/Cairns-Caloundra-comparison-for-June-2015.jpg
On this page you will find all the month and year average charts, for local background radiation levels from November 2007 to 2015. The most recent data suggests the amount of airborne contamination reaching this location has decreased significantly.
http://sccc.org.au/yearly-average-background-radiation-levels
Disclaimer: This is an amateur volunteer run service. Human error can provide incorrect information, and equipment malfunction can produce false readings. Do not rely on, or take action upon information presented here, without further research.
2nd July 2015 – Radiation spikes after wildfire in Chernobyl exclusion zone
Extracts:
Ukrainian nuclear inspectors have measured a significant increase in radiation in the Chernobyl exclusion zone caused by heavy wildfires raging in close proximity to the crippled nuclear power station.
Air near the desolated settlement of Polesskoye in the Chernobyl zone is contaminated with the radioactive element cesium-137. Its content in the air has reached a level called “sequence above the norm” (approximately ten times the norm), the State Nuclear Regulatory Inspectorate of Ukraine (SNRI) reported on Wednesday.
http://rt.com/news/271081-chernobyl-wildfire-radiation-ukraine/
7/2/2015 @ 11:54am
External gamma ambient level in East Los Angeles is constant between 8-9 Microrems per hour. This is normal ambient levels for this area.
Instrumentation: Wm B. Johnson and Associates GSM-501
29.06.2015 – High Alert: Ukraine Asks OSCE to Check Radiation Levels Over Donetsk
Extract:
It was earlier reported that an explosion that occurred at a Donetsk chemical factory on June 16 could have led to damages at the radiation storage site as it triggered the detonation of underground ammunition depots.
http://sputniknews.com/europe/20150629/1023987253.html#ixzz3ea7KqTPT
RADIATION STATION HARRISBURG NC June 19,2015
Rain test off my car with INSPECTOR+. Been some time since last test. Thunder/lightning storm moving SW to NE approx. 20 min. A NEW record CPM count since 7/4/2011!
1…12.34 X 1,000 = 12,340 CPM….6:08 pm
2…881.3 CPM reverse side napkin….6:21 pm
3…29.5 CPM inside background….6:32 pm
Compare that to July 4, 2011 when 2 thunderstorm readings taken ……..
1…12.27 X 1,000 = 12,270 CPM 1st shower
2…37.75 CPM inside background
[Above was 325.03 times background]
3…10.47 X 1,000 = 10,470 CPM
4…32.21 CPM inside background
[Above was 325.05 times background]
Go to my YouTube channel here and watch latest 5 views
It’s been a while but I was able to take a sample from the rain we had yesterday:
2015/06/09
Simi Valley, CA – 10 MIN AVG cloudy sky
8:30p INT 49.0 CPM
8:40p INT 85.5 CPM – Paper towel rain sample
2015/06/10
Simi Valley, CA – 10 MIN AVG partly cloudy sky
6:20a INT 44.5 CPM
6:30a INT 52.5 CPM – Same paper towel rain sample from the previous night
Significant radiation over background in Los Angeles rain, half of which is alpha:June 9, 2015
9:35 pm SAME RAIN SAMPLE IN PLASTIC BAG: 43.8 CPM^^ or 5.1 CPM alpha radiation. Alpha makes up 52.6% of overage.
Sample #4 – 9:20 pm RAIN: 48.9 CPM^^ or 24.7% HIGHER THAN BACKGROUND
9:00 pm INT RSSMC: 39.2 CPM^^
8:00 pm SAME RAIN SAMPLE IN PLASTIC BAG: 63.3 CPM^^ or 5.7 CPM alpha radiation. Alpha makes up 21.9% of overage.
Sample #3 – 7:45 pm RAIN: 69.0 CPM^^ or 60.5% HIGHER THAN BACKGROUND
7:30 pm INT RSSMC: 43.0 CPM^^
4:55 pm SAME RAIN SAMPLE IN PLASTIC BAG: 54.1 CPM^^ or 14.1 CPM alpha radiation ALPHA ALONE 34.8% HIGHER THAN BACKGROUND. Alpha makes up 50.9% of overage and is not the product of radon daughters/progeny as proved in Beta Watch.
Sample #2 – 4:30 pm RAIN: 68.2 CPM^^ or 68.4% HIGHER THAN BACKGROUND
4:15 pm INT RSSMC BG: 40.5 CPM^^
Sample #1 – 8:15 am INT RAIN: 45.8 CPM^^ or background
8:00 am INT RSSMC BG: 43.6 CPM^^
Recent Iodine I-131 Detections
These recent I-131 and other isotopic detections suggest there are still nuclear fission events occurring in the underground molten coriums at Fukushima. If these detected isotopes are not from Fukushima, then there must have been another recent major nuclear accident that has not been made public!
21st May 2015 – Iodine-131 detections in Finland and Norway preceded by detections in Japan.
Extract:
Iodine-131 levels in Gunma prefecture sludge skyrocketed on their May 1 report to the highest readings since the huge Fukushima emissions of July 2013. These analyses were actually done in April 21-23. This area is to the southwest of the Fukushima plant.
On May 12, I-131 was found in Chiba prefecture drinking water (not sludge). So it looks like the latest fission event is still going on.
http://optimalprediction.com/wp/iodine-131-detections-in-finland-and-norway-preceded-by-detections-in-japan/
9th June 2015 – I don’t know what to tell you…
Extract:
The radiation data, however, is actually pretty solid. Zr-97 in Germany, I-131, Co-60, Nb-95, Ru-103, Cs-134 & Cs-137 in Finland, I-131 also in Norway, Sweden and Switzerland. Widespread upticks and “glitch dots” across Europe. A system slow-down for the USA… It makes me wonder.
https://allegedlyapparent.wordpress.com/2015/06/09/anyway/
19th May 2015 – Radiation safety watchdog detects airborne radioactive particles, says no cause for alarm
http://yle.fi/uutiset/radiation_safety_watchdog_detects_airborne_radioactive_particles_says_no_cause_for_alarm/8003739
@ Chase, “What causes brain cancer”?
The health effects of microwave non ionizing radiation, which is used in wifi devices tablets, and mobile phones is accumulative. Your risk of damaging health effects increases with exposure intensity, and with the length of time you are exposed.
In my opinion after doing lots of research on this subject, I have concluded that being exposed to significant amounts of non ionizing radiation and ionizing radiation at the same time is much more damaging than being exposed to just one type of radiation!
If I was living in the Northern Hemisphere particularly Japan and North America, I would be making a significant efforts to also significantly reduce both my non ionizing radiation and ionizing radiation exposure.
Wireless Risk Management
For wireless convenience, we are placing at risk the health of generations of children!
All mobile wireless devices are a source of microwave radiation. Microwave radiation was classed as a 2B carcinogen by the WHO in 2011, so limiting your exposure is important. Large numbers of independent peer review studies are showing this could potentially be a major health issue. All ionizing or non ionizing radiation is cumulative. Pregnant women, children, and and particularly girls, are much more sensitive to radiation that adults.
There is no safe level of microwave radiation exposure for children. In this video British microwave military expert Barrie Trower, explains why tablets, wireless computers, baby monitors, cell and cordless phones, plus other microwave radiation devices are NOT safe for children.
In this video “National Day Of Action Against Smart Meters”, with Jerry Flynn, there is reference to a US government document going back to 1976 listing all the health hazards caused by wireless devices and concludes, “This should be kept secret to preserve industrial profit.”
Wifi in Schools, The Facts
Cancer Officially Number One Cause of Childhood Death in U.S.
http://eatlocalgrown.com/article/12174-cancer-officially-number-one-cause-of-childhood-death-in-us.html
Practical things you can do to reduce your family’s exposure to Microwave radiation.
The more wireless devices you have turned on in your house at one time, the more intense will be the microwave radiation exposure to your family and the neighbours. Think about it. In a home of a family of four, each person could have a mobile phone, a tablet computer, their own laptop, a cordless phone system, Xbox game console, wireless access point, or mobile broadband device.
All of these devices radiate significant amounts of microwave radiation individually. Combined, this adds up to a very significant exposure. Train the family to turn them off, or use alternative technologies! Gee, I don’t even own a mobile phone, and I’ve survived! Some people are far more sensitive than others to this type of radiation, and can suffer significant symptoms, in a very short period of time.
Ideally stop using wireless devices altogether and use wired connections, or at least use methods to reduce you and your families exposure. Doing this not only limits your exposure, but also the exposure to everyone around you too! When it comes to microwave radiation, distance is your friend. Each doubling of the distance from a microwave transmitting device, quarters the radiation exposure.
1. Turn them off when not in use! This has an added benefit, that it lessens the time available for someone to hack into the device. Wireless devices such as printers, access points and tablets, can send out very strong microwave signals constantly, when left on.
2. Lower the wireless signal transmission strength to the lowest possible level you can, to get everything working well with a 3 to 4 bar signal strength. A lot of wireless modems, and access points will allow you to turn down the wireless transmission signal strength in their software settings.
3. Place wireless access points, and mobile broadband device as far away from you as practical. I have suggested to lots of people with mobile broadband devices, that they put it on a 5 meter USB extension cable. This is so they can get the device away from them. They can then also use it like an aerial, to find the best signal strength location. Don’t place these devices on your lap or on your person. Young guys will be frying the family jewels, for older guys it may not matter. 🙂
4. Only have the device’s wireless function turned on when necessary. Remember, there can be more than one wireless type built into a device, wifi as well a blue tooth etc. Turn off other built in wireless devices, if you are not using them. This will also improve security.
5. Do not sleep with these devices in your bedroom, or under your pillow. What is society coming to, for me to even have to mention this. 🙂 Not only is this a fire hazard, but also a health hazard.
6. Replacing a cordless phone system with an old style corded phone can greatly reduce the amount of microwave radiation emanating through your house, and your head.
Watch these two very informative videos on the biological effects of microwave radiation, based on lots of independent research from all over the world.
Wake up call video part 1
Wake up call video part 2
Southern Hemisphere Background Radiation Report For May 2015.
Station location
http://sccc.org.au/monitoring/Australian-Map.jpg
This short animation of Northern, and Southern Hemisphere air circulation, shows why we can get detections so far south.
May 2015 Summary
May 2015 saw a decrease in month average background levels compared to the last three years. When Southern Ocean air reaches this location, we see lower background averages. More Southern Ocean air reaches this location in the cooler months and winter, hence the significant seasonal variation in background levels. This May has seen significant Southern Ocean air flows.
May 2015 monthly average background radiation level was 4% above the pre-Fukushima average.
May day average chart:
http://sccc.org.au/wp-content/uploads/2015/05/Caloundra-local-average-background-radiation-levels-May-2015.jpg
May average for 2014 was 13% above the pre-Fukushima average.
May average for 2013 was 7% above the pre-Fukushima average.
May average for 2012 was 7% above the pre-Fukushima average.
Here is an May 2015 comparison chart between Cairns and Caloundra, from the station operator located near Cairns. Cairns is on the east coast of Australia, and it is much closer to the equator than Caloundra. It is much more likely to get Northern air flows during the cooler months than Caloundra, see location map. In the chart, Cairns is red and Caloundra yellow.
Thanks to the North Queensland monitoring station operator for creating this chart. “The two bumps in the graph were coincidental with winds coming from the inland, from NW, instead of the predominantly SE airflow from the Pacific.”
http://sccc.org.au/wp-content/uploads/2015/06/Cairns-Caloundra-comparison-for-May-2015.jpg
On this page you will find all the month and year average charts, for local background radiation levels from November 2007 to 2015. The most recent data suggests the amount of airborne contamination reaching this location has decreased significantly.
http://sccc.org.au/yearly-average-background-radiation-levels
More detailed long term data can be found here.
http://sccc.org.au/archives/2630
Southern Hemisphere May 2015 Rain Water Test Report.
The May rainfall test chart shows the rainwater filter captured a lot less Lead Pb-210 and Beryllium Be-7.
Rainfall for May was 103.2 mm.
Background level saw a decrease this month, and this is reflected in the fact that less Lead Pb-210 and Beryllium Be-7 were detected in the filter.
Less Pb-210 in the filter means less Radon-222 was in the air. This was also reflected in the local live Radon monitor.
http://sccc.org.au/wp-content/uploads/2015/06/Down-pipe-May-polyester-filter-dried-test-020615-TV67-20c-84600-B.png
In the warmer months I will try a new filter design. I don’t think the polyester and carbon filters are very efficient at capturing water soluble salts.
Years of rain water tests can be found here.
http://sccc.org.au/pages/The-Food-Lab.html#Local_Rain_Water
Disclaimer: This is an amateur volunteer run service. Human error can provide incorrect information, and equipment malfunction can produce false readings. Do not rely on, or take action upon information presented here, without further research.
I googled… “What causes brain cancer”?
RISK FACTORS
“In most people with primary brain tumors, the cause of the tumor is not clear. But doctors have identified some factors that may increase your RISK of a brain tumor. Risk factors include:”
“- Your age. Your risk of a brain tumor increases as you age. Brain tumors are most common in older adults. However, a brain tumor can occur at any age. And certain types of brain tumors occur almost exclusively in children.”
➡ “- EXPOSURE TO RADIATION. People who have been exposed to a type of radiation called ionizing radiation have an increased risk of brain tumor. Examples of ionizing radiation include radiation therapy used to treat cancer and radiation exposure caused by atomic bombs.”
“- More common forms of radiation, such as electromagnetic fields from power lines and radiofrequency radiation from cellphones and microwave ovens, have not been PROVED to be linked to brain tumors.”
[…but they might. hmm…?]
Source – Mayo Clinic
http://www.mayoclinic.org/diseases-conditions/brain-tumor/symptoms-causes/dxc-20117134
I wonder if Joe Biden has read this? Was Beau Biden a victim or collateral damage? When are the Nuclear Proponents going to ‘get a clue’?
Brazil, Alert level detections from two different sources.
An email from a contact just came in.
I’m currently in the extreme south of Brazil. 2 days ago, something unusual happened: the background went from the usual 0.013 to 0.017 to above 0.030mR/h for few minutes. No weather change was happening at the moment.
This event could be just equipment failure. My second counter wasn’t around for me to confirm.
——————————–
After this email arrived I had a look at the Brazilian live private monitors, and one on the Radmon network has been getting very elevated detections.
Getting elevated detections from two different local sources around the same time, means it is statistically more likely that these are genuine detections and not equipment malfunctions.
See screen shot.
Brazilian radmon Screen Shot
http://sccc.org.au/wp-content/uploads/2015/06/Brazil-radmon-050616.jpg
http://radmon.org/
International Live Monitoring Station List,
http://sccc.org.au/international-radiation-monitoring-stations
“One way or the another, your actions, will determine your fate…”
Actress Julia Roberts speaking as Mother Nature
(2 minute video from conservation.org)
➡ http://natureisspeaking.org/mothernature.html
or… https://www.youtube.com/watch?v=WmVLcj-XKnM
“Nature doesn’t need people.”
“People need nature. ”
[applause!]
This puts it in perspective. That’s what most people lack when it comes to the subject of the ongoing TRIPLE MELTDOWNS and the nonstop FALLOUT from Fukushima. Looking past today and tomorrow and where the next meal or paycheck will come from is the extent of the perspective for most of the people I know.
The increase in gamma counts in Fairbanks may have two origins: dust from 200 miles of the Tanana River floodplain. The river is low, leaving a lot of silt exposed to the wind. Plant pollen [birch, aspen, alder] is also in the wind and can carry radioactivity absorbed earlier by trees. Winds from the south and east are redistributing cesium and other hot stuff that was dropped in the initial reactor explosions and fires in 2011. When pollen and dust go airborne, it registers on EPA’s monitor. Take no solace from the ‘small’ numbers. This stuff is incredibility poisonous, half a gram can kill thousands and render landscapes uninhabitable for hundreds, perhaps thousands, of years. More? Search: low dose radiation effects [sudden heart attack is my favorite].
Mobile camera sensors are made up of a large number of very small light sensitive pixels, that are also sensitive to ionizing radiation. If you stop all light from reaching the the solid state mobile camera sensor, then mostly only ionizing radiation Beta or Gamma can turn on a pixel.
By counting the number of active pixels each second, in a totally dark environment, you can roughly calculate the amount of radiation it has been exposed to. Even though this mobile app provides adjustment for the different sensitivities of camera sensor types, and sensor background noise, it is important to check at the app site for mobile phone suitability.mic
Look forward to your article on China’s impact upon America’s environment.
😐
This is a significant change. Thank you for the summary.
“EnviroReporter.com has not found such a high degree of alpha in its sampling in thousands of previous tests conducted over the last four years.”
– Michael Collins
What is the increased alpha possibly indicating?
IMO – It indicates that… the ongoing global catastrophe at Fukushima is obviously not improving nor is it going to be any time soon.
People should be aware and prepared. Exactly what that means, I’m not so sure. I guess when the Kardashians start wearing ‘masks’ as a fashion statement, then maybe people will catch on.
I wish the EPA wasn’t a farce.
I wish lungs had replaceable filters. 🙁
This means that the dust reading in its entirety was over three times background. The U.S. Environmental Protection Agency considers radiation three times background or above to be “significant.”
The California Highway Patrol maintains a three times background trip level to trigger a hazardous materials response by the agency. Hazmat protocols include use of respirators and other body and breathing protections when dealing with a radiation source ionizing at this level or above.
A spring 2015 examination performed April 17 at Radiation Station Santa Monica, which along with eight affiliated radiation stations across America and Australia have completed over 7,322 tests and reports since March 15, 2011, showed radiation at just 78.8 percent above normal.
The first tests of summer also indicate a high presence of alpha radiation which, by itself, comprised 75 percent of the overage with beta making up the other 25 percent. Indeed, the alpha detected alone was over 168 percent of background levels of radiation.
EnviroReporter.com has not found such a high degree of alpha in its sampling in thousands of previous tests conducted over the last four years.
Alpha radiation, which can be stopped by a piece of paper or plastic, is nevertheless the most dangerous to human health of the main different types of radiation: alpha, beta, gamma and X-ray. Ingestion through drink, water or breathing are the main pathways for alpha radiation into people and animals.
While alpha particles are positively charged and are relatively heavy, blocking them is easier than beta or gamma because they travel a short distance before losing energy. Nevertheless, alpha radiation is between 20 to 1,000 times more dangerous to the human organism due to their “relative biological effectiveness” in causing cell-death and cancer according to numerous sources.
EnviroReporter.com‘s periodic beta testing of dust acquired from three HEPA filter machines in Santa Monica is in response, in part, to the fact that the EPA’s Los Angeles RadNet beta detecting graphs online have been absent for several years. The L.A. RadNet gamma station appears to be continuing to function.
A June 1 tally of RadNet found only 37 out of 124 beta stations functioning across the United States and Puerto Rico. Large metropolitan areas like New York City, Boston and Chicago all have no beta detection graphs working. States like Florida, with five RadNet locations, have no operating beta graphs at all.
The working beta stations reveal four month highs were found across America. Hitting this dubious milestone included Montgomery Alabama, Tucson Arizona, San Bernardino County California, Hartford Connecticut, Fort Wayne Indiana, Baltimore Maryland, Grand Rapids Michigan, Concord New Hampshire, Toledo Ohia, Pittsburgh Pennsylvania and Madison Wisconsin.
Beta radiation includes fission products from nuclear reactors including Cesium-134, Cesium-137 and Strontium-90. Massive amounts of these beta radionuclides have escaped into the air and Pacific Ocean at Fukushima Japan which is in its fifth year of an ongoing triple meltdown that began March 11, 2011 after an earthquake and tsunami destroyed most of a huge reactor complex there.
EnviroReporter.com has been testing various media for this escaped radiation ever since. Its highest detections of radiation in the environment came in late 2013 with rain ionization in Death Valley National Park coming in at dozens of times background.
Until the EPA ever gets its RadNet system fully operational, Americans will only have a partial idea of how ‘hot’ with radiation its air is. Failure to maintain this system leaves the country at a huge loss should radiological releases happen due to nuclear plant malfunctions and meltdowns as well as terrorism by an expanding list of American enemies who vow to destroy it.
BY THE NUMBERS:
Radiation Station Santa Monica, California USA
June 1, 2015
12:40 pm INT SAME HEPA DUST IN PLASTIC BAG – ALPHA TEST: 64.8 CPM^^ which suggests strong alpha radiation presence. A plastic bag will block alpha radiation meaning that of the background overage, beta was [64.8 – 41.5 =] 23.3 CPM^^. The total amount over background was [134.7 – 41.5=] 93.2 CPM^^. The amount of alpha radiation detected was this total minus the beta component of it [93.2 – 23.3 =] 69.9 CPM^^ The ALPHA RADIATION ALONE IS 168.4% OF BACKGROUND HIGHER which is astonishing.
12:25 pm INT RSSMC BG: 41.5 CPM^^
12:10 pm INT HEPA DUST from two HEPA filters, one Ionizer/HEPA filter from May 20 to today, or 43 days total: 134.7 CPM^^ which is 2.25 TIMES BACKGROUND HIGHER In just 61% of the time of the last period, the sample was 2.88 times higher over background than in the prior period.
May 20, 2015
4:45 pm INT HEPA DUST from two HEPA filters, one Ionizer/HEPA filter from March 11 to today, or 70 days total: 68.1 CPM^^ which is 78.8% ABOVE BACKGROUND which is just 20% of the radiation over background from the last period which was half as many days. This is a welcome reading and result.
4:30 pm INT RSSMC BG: 38.3 CPM^^
+++
June 1, 2015 Nationwide Radiation Report
BETA GRAPH ANALYSIS
Since our last report April 17, 2015 (below in archives), Montgomery AL soared to a four month high May 10 topping ~365 CPM; Anchorage AK saw its crucial beta monitoring cease March 24 but sputtered to life April 28 and shows June 1 to be a mild ~40 CPM; Fairbanks AK hit 150 CPM May 22; Phoenix AZ May Day was perhaps a good watch-word on May 1 with a ~520 CPM spike; Tuscon AZ hit a four month high May 12 with a sizzling ~435 CPM May 12; Little Rock AR registered ~135 CPM May 5; Fort Smith AR registered 100 CPM June 1; Anaheim CA‘s beta graph shows just ~45 CPM June 1 which is small consolation for their Anaheim Ducks’ historic debacle; Fresno CA smashed through previous highs hitting ~970 CPM November 11 and then the graph died December 2 leaving a huge hole in California airborne beta monitoring – as of June 1 it’s still blank but it’s gamma graph is active; Bakersfield CA hit ~440 CPM May 28; Los Angeles CA‘s beta graph stopped in March 2014 never to return in America’s second largest metropolitan. Our June 1 HEPA filter debris test found hot dust registering positive for alpha radiation which came in alone at 168.4% of background higher which is astonishing; Riverside CA‘s graph gave out September 15, 2014 never to return; San Bernardino County CA smashed through a four month high of ~610 CPM on May 8 which is about twenty times normal; San Diego no longer has a working beta graph because it died January 15 after months of erratic fits and starts but gone for good in a town with a huge Navy base which makes the station’s inoperability careless in the extreme; Hartford CT jumped to a four month high May 30 with ~125 CPM; Washington DC registered just ~35 CPM June 1; still not one beta monitor out of five works in Florida which is amazing and maybe because the gamma’s high activity suggests something really hot in the Sunshine State where citrus has tested positive for Fukushima-originated Cesium-134 since the meltdowns began; Augusta GA no longer has a working beta graph in a very active environment, unfortunately, giving out August 25, 2014 never to return; Ft. Wayne IN had a malfunctioning beta station from February 5 through March 9 but hit a four month high May 24 with a jolting ~340 CPM; Baton Rouge LA was just ~20 CPM June 1; Orono ME is the farthest functioning beta station away from the triple meltdowns at Fukushima Dai-ichi, Japan, and this lovely town has the lowest readings sometimes down into the single digits for days at a time like June 28 with it in the single digits around 9 CPM; Baltimore MD‘s beta and gamma graphs are now ‘on’ and functioning properly with the city hitting 200 CPM May 18, a four month high; Worcester MA blew through ~320 CPM September 28 and has spiked three times in November over 200 CPM and then its beta station died December 9 and then briefly be reborn Christmas Day only to die, for good, the next day and joined Boston in the dead beta graphs group; Grand Rapids MI got up to a four month high May 15 with ~175 CPM; St. Paul MN was blowing through 300-350 CPM regularly before its beta station died October 16, 2014 not to return in this important upper Midwest center until the last two days where it read a scant ~35 CPM June 1; St. Louis tested ~40 CPM June 1; Lincoln NE topped 300 CPM on May Day; Concord NH registered a four month high May 12 with ~195 CPM in an area with normal background around ~25 CPM; Albuquerque NM registered ~260 CPM May 7; Buffalo NY tested at 150 CPM May 30; New York City NY is not functioning as it hasn’t for years but its gamma gross count is sort of jumping around like LA’s gamma is – just one difference, NYC’s gamma is much more active which is one thing New Yorkers can brag about: they’re hotter than Los Angelenos even if their crucial beta station is on the fritz; Syracuse NY showed ~160 CPM November 26 and then the beta graph died December 1 and never came back plus its gamma station is poorly maintained as evidenced by the scant and inaccurate readings, dying once again completely May 5; Charlotte NC‘s graph died January 13 but came alive May 6 hitting ~145 CPM May 19; Raleigh NC hit ~170 CPM July 24, 2014 and cut out and still hasn’t come back on, a real loss in the South; Toledo OH hit a four month high May 8 with ~210 CPM; Corvalis OR was ~105 CPM June 1Pittsburgh PA soared to a four month high May 7 topping ~225 CPM; Puerto Rico‘s beta graph doesn’t work but the gamma remains somewhat active; Amarillo TX is one of the hottest sites in the country was just ~80 CPM last night after topping ~910 CPM April 27; Dallas TX spiked to ~245 CPM May 28; Ft. Worth was just ~40 June 1; Salt Lake City UT‘s beta station is still down since a huge beta increase over 200 CPM in early May 2014 and remains knocked out; and Madison WI hit peaked at a four month high May 25 with a chart-topping 350 CPM.
@vital1: Outstanding comments that both horrify and give hope. That Tokyo had higher tap water contamination levels than Fukushima City should make that health conscious country concerned, don’t you think? Apparently not. It is easier to feign ignorance than face up the the fission flowing out of the faucet courtesy of the triple Fukushima meltdowns more out of control than ever, especially if you live in a ‘don’t rock the boat’ culture. How many American and Australian athletes are training their hearts out to make it to the 2020 Tokyo Olympics miles only to be greeted by hot water and all that’s cooked with it? Or the millions of tourists and business people visiting, and soaking in, the Land of the Rising Radiation Levels? The denial is staggering.
But perhaps not as staggering as what you bring us in the way of news about China’s “insane” plan to build over 70 (SEVENTY – not a misprint) nuclear reactors upwind of Japan and North America with ridiculously substandard safety controls. It is slow motion national suicide which won’t just sink this country of over a billion. China’s impact upon America’s environment is the subject of an upcoming EnviroReporter.com exposé.
That’s why Denise Anne and I are thrilled you’ve shared how we can turn our smart phones into nuclear radiation monitors. But first, vital1, since you have more equipment, experience and skills in the world of radiation detection than the most of us, can you tell us how it works?
Using a mobile phone app to turn an Android and iOS Mobile phone into a Geiger counter. A cheap way to get a basic Geiger counter when you’re on a budget.
An independent review on how effective this Geiger counter app can be, when set up on an Android or iSO mobile phone. The youtube video also shows how use, and set it up.
Go to the app creators web site, to check out which models of mobile phones it will work on.
http://rdklein.de/html/radioactivity.html
@ Michael, more nuclear madness!
25th May 2015 – China warned over ‘insane’ plans for new nuclear power plan
Extract:
He Zuoxiu, a leading Chinese scientist, says the country is not investing enough in safety controls after lifting of post-Fukushima disaster reactor ban.
He said: “They want to build 58 (gigawatts of nuclear generating capacity) by 2020 and eventually 120 to 200. This is insane.”
http://www.theguardian.com/world/2015/may/25/china-nuclear-power-plants-expansion-he-zuoxiu
@vital 1 et al: Astonishing story and all the more horrifying now that the brave 25-year-old sailor has been apprehended, Britain won’t charge him with the Official Secrets act for this whistleblowing, according to the Guardian. That way the allegations won’t be examined publicly. And the American press is muted as both CNN and the New York Times haven’t covered this at all. But we are right now:
Unlike climate change, eliminating nuclear weapons is not only possible, it is going to be mandatory for the survival of the species. Luckily, America’s nukes run on such an old system that it can’t be hacked into by hostile groups like, say, ISIS. So what to do? Drop a cool $355 billion over the next decade on nukes alone, part of a 30-year trillion dollar splurge on the scourge of the planet. And you wonder where your taxes are going?
Thank you vital1!
18th May 2015 – Nuclear disaster waiting to happen’: Royal Navy probes Trident whistle blower’s claims
Extracts:
McNeilly, a weapons engineer, who allegedly served from January to April this year on board the HMS Victorious, claims that a number of security lapses and technical faults with the Trident missiles carrier exposes the UK nuclear deterrent to potential terrorist attacks that “would kill our people and destroy our land.”
http://rt.com/uk/259481-trident-submarine-safety-whistleblower/
😉 Every now and then I come across a real gem.
IMO – We need more projects like this. This is a powerful, tasteful, work of art with a not so subtle message.
How anyone could watch this video and not realize that Nuclear Power is a crime against all humanity is beyond me.
By Your Side – Sade & Goda Tsuneo
https://www.youtube.com/watch?v=2f75XEGWqWc
or
https://vimeo.com/88405888
[applause!]
@Michael, good to hear you were not able to detect any increase.
Southern Hemisphere Rain Water Report For April 2015.
Station location
http://sccc.org.au/monitoring/Australian-Map.jpg
This short animation of Northern, and Southern Hemisphere air circulation, shows why we can get detections so far south.
Tritium Detection?
I delayed publishing the April 2015 rain water report because of ongoing technical discussion regarding the possible detection of Tritium, in this months water filter test.
There are very small amounts of naturally occurring Tritium in the atmosphere. It can be created in trace amounts by spallation in the upper atmosphere, by cosmic rays or from releases from a nuclear power plant or nuclear accident.
It is only conjecture at this point that it is Tritium, and has not been confirmed. It could equally be another isotope, or a technical issue with the equipment at these very low energy keV detection levels.
Both Iodine I-129, and Beryllium Be-7, which were detected in this months water filter test can also be created by spallation in the upper atmosphere, by cosmic rays or from releases from a nuclear power plant or nuclear accident.
There was a lot of solar storm activity last month, and it takes around two weeks for spallation products to reach the surface of the planet.
Lead Pb-210 is the decay daughter of naturally occurring Radon decay. It can also be released from a nuclear power plant, or nuclear accident. At present there is no conclusive evidence that any of the latest isotope detections here at this location are from Fukushima.
http://sccc.org.au/wp-content/uploads/2015/05/Down-pipe-April-polyester-filter-dried-test-050515-TV67-22c-85006-B-text.jpg
For those who are interested, more technical discussion about the possible Tritium detection can be found here,
http://www.gammaspectacular.com/phpBB3/viewtopic.php?f=5&t=45
Years of local rain water, and rain swab test results can be found here.
Disclaimer: This is an amateur volunteer run service. Human error can provide incorrect information, and equipment malfunction can produce false readings. Do not rely on, or take action upon information presented here, without further research.
@vital1, Dale & Chase: Thank you for the invigorating discussion. Our rain samples confirm what we’ve thought – the forest fire adjacent Chernobyl made aloft radiation, but not enough of it to disperse over the West Coast of the USA as pre-supposed by the anonymously-run optimalprediction.com. If it’s there, it’s too low to count.
May 14, 2015
3:00 pm INT RAIN sample: 37.5 CPM^^ or background
2:45 pm INT RSSMC BG: 41.3 CPM^^
1:30 pm INT RAIN sample: 43.8 CPM^^ or 21.3% ABOVE BACKGROUND but we consider normal per subsequent sample reading
1:15 pm INT RSSMC BG: 36.1 CPM^^
May 8, 2015
10:00 am INT RSSMC BACKGROUND: 37.5 CPM^^
9:30 am INT RSSMC RAIN remnants sample: 40.6 CPM^^ or background
April 18, 2015
7:00 pm EXT Pacific Ocean water sample taken with paper towel: 34.5 CPM^^ or background
6:45 pm EXT Background including paper sample towel at Pelican Cove, Palos Verdes CA: 39.0 CPM^^
Southern Hemisphere Background Radiation Report for April 2015.
Station location map
http://sccc.org.au/monitoring/Australian-Map.jpg
This short animation of Northern, and Southern Hemisphere air circulation, shows why we can get detections so far south.
April 2015 Summary
April 2015 saw a decrease in month average background levels compared to the last three years. When Southern Ocean air reaches this location, we see lower background averages. More Southern Ocean air reaches this location in the cooler months and winter, hence the significant seasonal variation in background levels. This April has seen significant Southern Ocean air flows.
April 2015 monthly average background radiation level was 8% above the pre-Fukushima average.
April Day Average Chart:
http://sccc.org.au/wp-content/uploads/2015/04/Caloundra-local-average-background-radiation-levels-April-2015.jpg
April average for 2014 was 22% above the pre-Fukushima average.
April average for 2013 was 9% above the pre-Fukushima average.
April average for 2012 was 12% above the pre-Fukushima average.
Here is an April 2015 comparison chart between Cairns and Caloundra, from the station operator located near Cairns. Cairns is on the east coast of Australia, and it is much closer to the equator than Caloundra. It is much more likely to get Northern air flows during the cooler months than Caloundra, see location map. In the chart, Cairns is red and Caloundra yellow.
Thanks to the North Queensland monitoring station operator for creating this chart.
http://sccc.org.au/wp-content/uploads/2015/05/Cairns-Caloundra-April-2015-background-radiation-level-comparison.jpg
To make it easier to compare year and month background averages, I have created this page.
http://sccc.org.au/yearly-average-background-radiation-levels
On this page you will find all the month and year average charts, for local background radiation levels from November 2007 to 2015 for Caloundra. Historically, the recorded pre-Fukushima local background here was low, averaging around ~0.1 uSv/hr. This data has allowed the tracking of changes in local background levels, plus the detection of radioactive clouds passing through.
The most recent data suggests the amount of airborne contamination reaching this location, has decreased significantly.
http://sccc.org.au/yearly-average-background-radiation-levels
More detailed long term data can be found here.
Disclaimer: This is an amateur volunteer run service. Human error can provide incorrect information, and equipment malfunction can produce false readings. Do not rely on, or take action upon information presented here, without further research.
@Chase: Yes, there is a lot of red in nuclear power’s ledger (traditional high power fission reactors). The economics of nuclear power has always hidden those costly parts of the equation away. Thank you for pointing out those high costs and the continuing long term threats to the environment that they pose.
The point of the article I posted was mostly about bringing renewable energy, chiefly wind and solar, into the same “always available” category as nuclear. Doing so inexpensively would make wind and solar, with battery storage, compete head to head with nuclear power without all of the risky, poisonous attributes of nuclear fission.
I also mentioned fusion as a safer form of nuclear power, and I do hope that one day mankind will master that technology. Not that it doesn’t present it’s own risks, but those risks will be much lower than fission technology. Some of the large scale “hot” fusion technology uses tritium and deuterium fuel, and these elements can also be harmful. There are other forms of fusion power, so-called Cold Fusion, or Low Energy Nuclear Reactors, that may also prove feasible. These methods might also provide round the clock power but have much safer materials and waste products. Hopefully, they would replace fission reactors when the fission reactors are retired or when fission technology is finally judged to be too risky to continue operating.
Here is an interesting article on LENR. http://www.extremetech.com/extreme/149090-nasas-cold-fusion-tech-could-put-a-nuclear-reactor-in-every-home-car-and-plane
And, let’s just hope fission reactors are the most dangerous technology we ever implement in search of limitless energy. I don’t want to think about what might go wrong with manmade exotic matter or black holes.
@Dale
“The economics of renewable energy versus nuclear power may be changing,…”
IMO – There never was an ‘economic’ comparison of renewable sources to nuclear power and there never will be.
That was one of the Nuclear Power Industry’s first lies and probably the one LIE that’s most easy to understand. Not counting the simple numbers like comparing the cost of 1 Nuclear Plant to the number of windmills or solar panels that could be installed with that money. Then, there’s the long term storage of radioactive waste. Again, there is no such thing as ‘safe’ long term storage. What’s the REAL COST of that? The answer is, there is no number! 300 years 10,000 years 24,000,000 years is how long some of this stuff will still be contaminating the planet. Nuclear Proponents are robbing the future in order to boil water today.
The insidious nature of radioactive contamination’s transport vectors guarantees that at some point, when a barrel breaks, a fuel pool no longer cools or when tectonic plates move and the underground storage facilities are breached there will be contamination. Sure, it may take a few decades or even a few thousand years, but as it stands now, it will happen. (Example: WIPP) That’s if it’s not illegally dumped first. We know that happens more than we care to think about, but it does. What’s the cost of that?
Now add in the cost/value of the contaminated areas of the planet we already have and it should be really clear there is no economic comparison. What is the value of damaged DNA? What is the cost to mother earth? There is no way to put a number to such an immoral atrocity.
I also have no doubt that more MELTDOWNS will occur. Yes, time is of the essence.
‘There will be meltdowns’
“Presentation held in Loviisa 12.1.2010. Gordon Edwards is math & physics professor from Canada who increases awareness of nuclear power to prevent the harm that the mere self-sustaining thrive of the industry leads to.”
The CONS of Fusion Power:
“Given that the fusion approach, will not, failing any miraculous breakthroughs, be ready by the time we need it, which is very soon if not now, it could be argued that it makes more sense to spend those billions of research dollars on something that will be.”
(It may not be realistically achievable large scale.)
“[Fusion] It is not expected to be commercially available until somewhere around 2050. If you believe the projections on climate change, we pretty much need to have our energy house in order by then, with a dramatically lower carbon footprint that needs to begin dropping yesterday. The DOE has forecast that the US can meet 80% of its electricity demand from renewables by that time using existing technology while Denmark will be fulfilling 100% of its total energy needs with renewables by then.”
(We don’t need it.)
…more
Cons of nuclear fusion
· Unproven at anything resembling commercial scale.
· No full scale production expected till at least 2050
· Commercial power plants would be extremely expensive to build
· Requires extremely high temperatures. Difficult to contain
· Could produce a net negative amount of energy (gee, that would suck)
· IF cold fusion could be achieved, it would be much easier to implement.
· The billions in research funding could be spent on renewables instead
http://www.triplepundit.com/special/energy-options-pros-and-cons/fusion-power-pros-cons/
@Dale: Waiting for the next nuclear accident, courtesy of the Sun itself, does not seem to be addressed and with the odds of a full scale catastrophe setting alight spent fuel pools at 12 percent in the next decade. Should “all fronts” include nuclear, especially the 70+ new reactors China is envisioning, without addressing this? That doesn’t even address the intractable problem of nuclear waste and proliferation.
The economics of renewable energy versus nuclear power may be changing, if cheap large scale energy storage can be implemented. A number of questions came to mind after reading this article. http://www.forbes.com/sites/jeffmcmahon/2015/05/01/did-tesla-just-kill-nuclear-power/
Can nuclear power ever be made to be as safe as solar or wind power, backed by utility scale batteries? Can fission reactors and their poisonous radioactive fuel/waste ever be safely stored? How many years and how much will it cost to invent “safer” fusion reactors? While such technology may eventually be developed, we may be much closer to developing large utility scale batteries than solving either long term safe storage of radioactive waste or developing new, safer fusion reactors.
Personally, I would like to see progress on all fronts. Reduce and phase out unsafe nuclear technology. Safely store existing radioactive fuel and waste (at least as long as it takes to either remove it from planet Earth or transmute it into something less harmful). Develop safe fusion power, renewables, and utility scale energy storage. There is no shortage of ideas to transform our energy industries, but we may be short of one thing, — time. Time to put together a comprehensive plan to address all of these issues before we experience another nuclear accident.
A news story today, 5/4/15, that radioactive waste from Tennessee is going to start heading to the Nevada Test Site by truck fairly soon. Significant concerns, all along the truck route, if there is an accident where one of the large containers falls off the truck. But, at least we get a brief look at what the truck and cargo combination will look like. So if you’re using U.S. 40 to drive cross country, if you see one of these babies steer clear. See photo & article at:
http://www.reviewjournal.com/news/nevada/test-run-signals-start-nuclear-waste-shipments-nevada
I made a comment here in March 2015 about the Chernobyl seclusion zone being closed for several weeks because of a terrorist threat. Now we have a zone closure because of Fire threat. Just seems odd to me. Maybe there’s more going on at Chernobyl than we are told? That’s seems like how it’s consistently worked in the past. I know it’s speculation on my part, but what are we supposed to do?
30th April 2015 – Wildfire Near Chernobyl
Extract:
Visible smoke plume seen on April 28 MODIS satellite image (natural-color composite). Zone of Alienation shown as red circle. International borders are yellow. Visible plume extends at least 60 km into Belarus.
Comment:
Thanks to Leuren Moret for pointing to this blog.
http://blog.skytruth.org/2015/04/wildfire-near-chernobyl.html?utm_source=feedburner&utm_medium=feed&utm_campaign=Feed%3A+Skytruth+%28SkyTruth%29
Michael, the Belarus state run background radiation monitoring page has gone down. I am presently getting a 404 page error. Belarus borders the Ukraine near the contaminated Chernobyl forests, it also has forests highly contaminated by the 1986 Chernobyl nuclear catastrophe.
It was working the last time I looked, which was last night here in Australia, this would be early morning on the 2nd May for the USA. There appeared to be a slight uptick in background levels in Eastern Belarus the last time I looked. I do not have enough information to clarify if this was a natural variation for that area of Belarus, or a result of the Chernobyl forest fires.
Technical issue????
http://rad.org.by/radiation-belarus.html?ln=en
@vital1: The resuspension of Chernobyl radiation through these forest fires is going to be picked up somewhere. Your links are superb. Thank you for keeping us on top of this as it has implications for the region and world.
HAZMAT in Ukraine on Thursday, 30 April, 2015 at 08:36 (08:36 AM) UTC.
Extract:
Radioactive ashes and dust caused by the forest fire in exclusion zone of Chernobyl nuclear power plant is expected to fall today in Kiev – during the previous days of the fire the radioactive precipitation fell in Belarus.
http://hisz.rsoe.hu/alertmap/site/index.php?pageid=event_desc&edis_id=HZ-20150430-48013-UKR
If the Chernobyl fire does spread the contamination, here are two tools to help keep track of it.
International list of live monitoring stations.
http://sccc.org.au/international-radiation-monitoring-stations
Nullschool surface wind world map, you can zoom in and move the 3D earth with this tool, plus look at wind direction at different altitudes.
http://earth.nullschool.net/#current/wind/isobaric/1000hPa/orthographic=21.99,53.01,2451
Chernobyl forest fires are something to take notice of, and keep and eye on, particularly if you are living in Europe.
29th April 2015 – Forest / Wild Fire in Ukraine on Wednesday, 29 April, 2015 at 03:07 (03:07 AM) UTC.
Extract:
Fire has engulfed a large sector of woods in the exclusion zone around the destroyed Chernobyl nuclear power plant. Ukrainian prime minister Arseniy Yatsenyuk says the fire is being brought under control. It is unclear if the fire has hit parts of the zone heavily contaminated by radiation from the 1986 reactor explosion and fire. A 30-kilometer (18.6-mile) zone around the plant is off-limits to most people except for workers constructing a new shelter to cover the destroyed reactor’s building, and to visitors on short trips. The explosion and fire left some sections of the zone heavily contaminated, while other parts were less damaged. Interior Minister Arsen Avakov said Tuesday the fire involved about 400 hectares (1.5 square miles).
http://hisz.rsoe.hu/alertmap/site/index.php?pageid=event_desc&edis_id=WF-20150429-47989-UKR
07.07.2012 – Chernobyl’s radioactive trees and the forest fire risk
Extracts:
“Pine damages easily. Wind blows it down. Insects infest it. Drought makes brush into perfect tinder which can all too easily catch fire. And these dying radioactive plantations are considered too dangerous and expensive to clear.
If ignited, one expert likens the potential effect to setting off a nuclear bomb in Eastern Europe. Wind could carry radioactive smoke particles large distances, not just in Ukraine, but right across the continent.”
“Sergiy says more big wildfires in Chernobyl like the one in 1992 would be catastrophic for Ukraine’s image, and potentially devastating for farmland right across Europe.”
“Berries are highly efficient at soaking up and storing radionuclides, huge quantities of which were dispersed over large parts of the Soviet Union and Western Europe by smoke plumes from the explosion. ”
“It is blueberry season, and they are selling them by the plastic pint glass. You could pull in to haggle, but Sergiy Zibtsev, a professor from the Forestry Institute at the Kiev University of Life Sciences does not recommend it. They are laced with radioactive strontium.”
Comment:
The civil war in the Ukraine posses unforeseen threats to people across Europe. With a lot of scarce resources going to the civil war effort, neglect of Chernobyl’s forests could be a major health issue for people living across Europe!
http://www.bbc.com/news/magazine-18721292
💡
“Michael, we definitely need a lot more people to wake up to how serious the Fukushima Nuclear Catastrophe is, plus how widespread the environment damage is. ”
– vital1 April 24, 2015 at 3:13 am
The media PR headlock/stranglehold is extremely tight.
However…
I would like to see a roving random question asked of those on the street. Maybe Michael and Denise could make a video? I am guessing that many would be knowledgeable, some would respond with anger and others would pretend to not care.
I would ask questions like these to start.
➡ Regarding Fukushima and it’s Nuclear Power Plants:
is…
A. the crisis over?
B. the situation in cold shutdown?
C. it like a banana or an X-ray?
D. radiation (fallout) diluted?
E. mitigation something you think about?
etc…
IMO – People are somewhat aware, but because of peer pressure and political correctness many are afraid to speak or they have issues with revealing their true thoughts because of the psychological severity of the catastrophe itself. It’s a powerful control mechanism. It might be an interesting experiment.
East Los Angeles, CA 10 minute exterior count at 8:30am Sunday April 4
checks in at 46.8 counts per minute after yesterdays light rain.
Hector
[Editor: Testing the rain itself is very important. Perhaps next time.]
Yes, vital1, the light on the horizon says that the front-runner for next President of the United States is knee-deep in uranium ore and Russian cash.
Meet the new boss, same as the old boss:
Cash Flowed to Clinton Foundation Amid Russian Uranium Deal – April 23, 2015 New York Times
“At the heart of the tale are several men, leaders of the Canadian mining industry, who have been major donors to the charitable endeavors of former President Bill Clinton and his family. Members of that group built, financed and eventually sold off to the Russians a company that would become known as Uranium One.”
Should this tale prove true, Hillary Clinton could be facing a criminal inquiry that will make her bid for President more a road to a Republican return to the White House. Arrogance + stupidity + greed + uranium = Time in the ‘big house,’ not the White House.
Some light on the horizon Michael.
LONDON, 24 April, 2015 − World group seeks ban on uranium and nuclear power
Extracts:
Uranium mining across the world should cease, nuclear power stations be closed and nuclear weapons be banned, according to a group of scientists, environmentalists and representatives of indigenous peoples.
The declaration applauded the expansion of renewable energy and the significant strides in phasing out nuclear power following the growing awareness that “nuclear power is not a cost-effective, timely, practical or safe response to climate change”.
The Symposium’s co-president, Dr. Dale Dewar—a physician who is associate professor at the University of Saskatchewan and is co-author of the book, From Hiroshima to Fukushima to You—summed up by saying: “We are calling on national and international leaders to protect our planet and our populations from any further nuclear catastrophes. Anything less would be irresponsible.”
http://www.climatenewsnetwork.net/world-group-seeks-ban-on-uranium-and-nuclear-power/
I can’t believe they’re going to hold the Olympics in Tokyo. The entire area is dangerously radioactive. Everything from the streets to the food is contaminated. If I were a participant I’d have to bow out. What a tragedy.
Michael, we definitely need a lot more people to wake up to how serious the Fukushima Nuclear Catastrophe is, plus how widespread the environment damage is.
Report just in, another very high radiation detection. Children had been playing in this Tokyo park, up until now!
24th April 2015 – Tokyo park closed after extremely high radiation levels found, prompting child health fears
Extract:
Soil underneath a slide at the park in Toshima ward in the north-west of the Japanese capital showed radiation readings of up to 480 microsieverts per hour, the local administrative office said.
http://mobile.abc.net.au/news/2015-04-24/tokyo-park-closed-after-rocketing-radiation-levels-found/6419312
@vital1: Thank you for this excellent analysis. It makes the most sense, this Toxicity multiplying effect combined with rising sea water temperature. Smart and absolutely critical insights that will be ignored but all here.
Earth Day, the day most people pat themselves on the back for using cloth bags and ‘caring’ about the environment. It might as well be called Smurf Day for all it matters. That’s why we’re blessed to have such superb insights from you, vital1. The only other thing I read of note on Smurf Day was Bloomberg’s Beyonce Beats Environment as Media Favors Celebrity News which says “Beyonce Knowles, the pop singer and actress, gets 11 times more mentions in U.S. media than stories about deforestation and five times more than the ocean’s health, according to a report by the Project for Improved Environmental Coverage non-profit group. Environmental stories made up less than 1 percent of headlines last year, its survey shows.”
We shall reap what we have sown. Some us, however, are doing something about it. Thank you fellow raddies.
Radiation contamination of the environment on the scale of the Fukushima nuclear catastrophe, has much broader effects than just detectable increases of radiation in air and water spreading out from Japan. It affects the dynamics of the entire biosphere!
In my opinion it is not just the radioactive contamination from Fukushima directly poisoning the sea, and causing the large Pacific Ocean die offs. It is a combination of interrelated factors, because everything is interconnected.
The Toxicity multiplying effect.
North Pacific Ocean water is now a mixture of toxic industrial chemicals washed out to sea during the tsunami, and a verity of radioactive isotopes, not just Cesium, but also Tritium, Strontium, Americium, and Plutonium, etc. A lot of these isotopes are heavy metal toxins, as well as being radioactive. All this has now been added to the toxins that were already in the Pacific Ocean before Fukushima.
A single toxin in the environment can be a hazard, and maybe an organism’s natural biological defense systems can deal with this effectively. If an organism has multiple toxins present radiological and chemical, to deal with at the same time, you get a biological toxicity multiplying effect. The human or animal defense systems becomes weaker the more toxins it has to deal with.
Biologically one toxin, plus one toxin, does not equate to double the toxicity effect. Studies show you can get a multiplying toxicity damaging effect 10 to 20 time greater. The human or animal defense systems becomes weaker, the more toxins it has to deal with. The organism becomes overloaded dealing with to
much toxic stress at once.
All this weakens the immune systems of humans, plants and animals. So we could see viruses that would normally be under check become more infectious , or viruses mutate into more infectious strains.
In the long term more humans, plants and animals life may die from the indirect effects of the radioactive contamination, as a result of the weakened immune systems, or from virus mutations.
Atmosphere damaged.
Extreme UV levels are now being detected in both Northern and Southern Hemisphere, spring and summer. I am suggesting that the increase in Northern hemisphere UV has been caused by atmosphere damage from the large amount of ionizing radiation released into the Northern Hemisphere upper atmosphere, by the Fukushima Nuclear Catastrophe.
Extract:
“Aquatic wildlife is particularly vulnerable Phytoplankton are at the start of the aquatic food chain, which account for 30 per cent of the world’s intake of animal protein.
Phytoplankton productivity is restricted to the upper layer of the water where sufficient light is available. However, even at current levels, solar UV-B radiation limits reproduction and growth.
A small increase in UV-B exposure could significantly reduce the size of plankton populations, which affects the environment in two ways. With less organic matter in the upper layers of the water, UV radiation can penetrate deeper into the water and affect more complex plants and animals living there. Solar UV radiation directly damages fish, shrimp, crab, amphibians and other animals during their early development.
Pollution of the water by toxic substances may heighten the adverse effects of UV radiation, working its way up the food chain. Furthermore less plankton means less food for the animals that prey on them and a reduction in fish stocks, already depleted by overfishing.”
Excessive UV effects on ecosystems
http://www.grida.no/publications/vg/ozone/page/1389.aspx
Planetary Thermal Imbalance
A possible new cause for upper atmosphere damage is from the large Fukushima krypton-85 and other radioactive releases. This is creating a Planetary Thermal Imbalance & Extreme UV Levels. Planetary Thermal Imbalance is indicated by record breaking extremes in worldwide hot and cold temperatures. The large difference between hot and cold creates extreme weather events.
A lot of Kryton-85 was released by the Fukushima Nuclear catastrophe.
Extract:
“The study shows that krypton-85 from nuclear fission enhances air ionization and, thus, interferes with the atmospheric-electrical system and the water balance of the earth atmosphere.
If Krypton-85 continues to increase, changes in such atmospheric processes and properties as atmospheric electric conductivity, ion current, the Earth’s magnetic field, formation of cloud condensation nuclei and 57 aerosols, and frequency of lightning may result and thus disturb the Earth’s heat balance and precipitation patterns.”
These Krypton-85 induced consequences call for Krypton-85 monitoring.
http://www.empa.ch/plugin/template/empa/*/7530
The Fukushima Nuclear catastrophe is continuing:
A 1992 German risk study of a NPP core melt down on the upper Rhine river concluded that.
1. Strontium-90 levels would skyrocket, and reach a peak levels around 5,000 days later. Strontium-90 levels would then stay high for around another 40,000 days + !
We are already seeing reports of skyrocketing levels of Strontium-90 being detected in the ground water tests, at the Fukushima Nuclear Catastrophe site.
2. Cesium-137 would reach peak levels after 10,000 days.
Interestingly, Tepco has has tried to implemented the counter measures suggested in this document, at the Fukushima Nuclear Catastrophe site. They have not had much success so far.
(Note: that the charts in this document are log scale.)
http://www.irpa.net/irpa8/cdrom/VOL.1/M1_97.PDF
If this study is correct, these increases will continue long into the future!
All the wars, and strife in the world at present is analogous to people fighting each other on a sinking boat. We urgently need the whole world to cooperate, and focus on mitigating the Fukushima Nuclear Catastrophe.
A robot shows the glowing green inside one of the damaged Fukushima nuclear plants. It’s a pretty impressive video, I thought readers might want to take a look. The text says that the radiation levels aren’t as high as expected… The camera image displays up to 8 Sv/hr, though. I’m glad that these areas can now be surveyed, that shows progress in the cleanup effort. But, the damage is done. We need these images to underscore the danger from nuclear accidents.
http://www.cnn.com/2015/04/20/asia/japan-fukushima-second-robot/index.html
HAZMAT in Mexico on Thursday, 16 April, 2015 at 04:49 (04:49 AM) UTC.
Extract:
Authorities issued an alert for several Mexican states on Wednesday after thieves snatched potentially deadly radioactive material used for industrial radiography.
“Being close to this quantity of unprotected radioactive material for hours or days could be fatal,” the statement warned. It was the latest case of radioactive material being stolen in Mexico. In December 2013, thieves took a truck containing highly radioactive cobalt-60, but they were apparently unaware of the cargo within the vehicle. Authorities ultimately arrested and hospitalized several suspects in that case after recovering the potentially lethal material.
http://hisz.rsoe.hu/alertmap/site/index.php?pageid=event_desc&edis_id=HZ-20150416-47803-MEX
NORWAY AND ENGLAND
The Mosterhamn private monitoring station in Norway just went ballistic at 78.34 uSv/hr, and most likely a false alarm, but worth keeping and eye on. Correction 664 uSv/hr!
Screen shot,
http://sccc.org.au/wp-content/uploads/2015/04/Mosterhamn-Norway-Chart-screenshot-170416.png
Mosterhamn Station Norway is on the private Monitoring system,
I have also noticed over the last couple weeks is Grimsby private station located on England’s East coast, on radmon.com, constantly detecting elevated levels of background radiation.
By the charts, the equipment appears to be operating normally. This suggests significant radiation from a local source is passing through the area.
Screen shots,
Today
http://sccc.org.au/wp-content/uploads/2015/04/Grimsby-UK-Chart-screenshot-170416.png
Screen Shot – 14th April, was the time in my time zone in Eastern Australia, when I captured this screen shot.
http://sccc.org.au/wp-content/uploads/2015/04/Grimsby-UK-Chart-screenshot-140415.png
I have more screen shots as well, but these two should convey what I am talking about.
March Southern Hemisphere 2015 Rain Water Test Report
Summary:
Again this month we see trace detections of Beryllium Be-7 and Lead Pb-210, nothing that we could definitively qualify as Fukushima contamination. Beryllium Be-7 can be made by spallation in the upper atmosphere, during solar events, and takes around two weeks to reach the surface. Lead Pb-210 is a decay daughter of Radon Rn-222. Both these isotopes can also be released from a Nuclear accident.
No were near as much water went through the rain water filter this month (68mm), as last month (426.6mm).
Roof down pipe filter design for rain water testing.
http://sccc.org.au/down-pipe-filter-design
Rain Filter Test Chart (The chart is minus background.)
In this chart I have CPS on the Y axis to show activity, and have turned off Y log to show linear scaling. This is only a test chart of the polyester part of the rain water filter system design.
This test chart is minus background.
http://sccc.org.au/wp-content/uploads/2015/04/Down-pipe-March-polyester-filter-dried-test-060415-TV67-22c-84600-B-text.jpg
Disclaimer: This is an amateur volunteer run service. Human error can provide incorrect information, and equipment malfunction can produce false readings. Do not rely on, or take action upon information presented here, without further
research.
IMO – We cannot rely on labels.
The email about the daughter who consumed some ‘potentially’ rad-hot tuna ‘possibly’ packed in the USA, (comment by vital1 on the Food Lab page), is probably just the tip of the iceberg when it comes to how the radioactive contamination transport vectors will sooner or later find a path to… somewhere.
vital1’s comment:
I read an article in “The Independent”, linked by drudgereport.com, concerning some foods produced in the Fukushima area, alledgedly finding their way to Taiwan and possibly the UK. Since the contamination in and around the damaged Fukushima nuclear plants has yet to be fully cleaned up, and likely won’t be cleaned up for many more decades, I am concerned about the prospect of foods produced and distributed from contaminated areas making their way onto store shelves everywhere with inaccurate labeling. While the emissions from the damaged Fukushima plants are not as great as they once were, I think it is still something to be wary of. Now, I think it is prudent to be careful with some imported foods regardless of labeling. I don’t necessarily stop consuming them entirely, but I do check them if I have concerns. If I can’t rely on the labels, I guess I will have to be a lot more concerned.
http://www.independent.co.uk/news/uk/home-news/food-from-fukushima-could-be-hitting-britains-shelves-through-legal-safety-loophole-10174298.html
@Chase & vital1: Your words, Chase, put wind in our sails as they make us proud. The best work on this online news website is yet to come. We are nothing without you and folks like vital1. Thank you.
Imagine this: Look at the havoc our greedy plundering of the sub-atomic world has gotten us in just the last 100 years. One hundred years ago, Madame Curie was still convincing French officers in the trenches of World War I that her horse-drawn wagon, with a big boxy X-ray machine in it, could help save wounded Alliance soldiers. Now, she is long gone – dead from radiation poisoning – but her lab books are so radioactive with radium that they are kept under leaded glass away from the public. 100 years. Atomic bomb explosions, meltdowns, spills, ruined seas and land all in a failing effort to harness the power of the Sun when the Sun is already there. And so are we exposing this fatal folly.
HAZMAT in Canada on Wednesday, 08 April, 2015 at 03:09 (03:09 AM) UTC.
Extracts:
A search was carried out on Tuesday in Malbaie for what authorities believe were radioactive materials destined for export, the Canada Border Services Agency has announced.
A permit is required to export such dangerous materials, the CBSA noted. The investigation is still ongoing and the RCMP, the Canadian Nuclear Safety Commission and the Sûrete du Quebec were all present on the scene.
The substances were destined for export, but Roby would not indicate which country they were destined for.
Comment:
I get the impression that this is a more serious situation than authorities are letting on.
http://hisz.rsoe.hu/alertmap/site/index.php?pageid=event_desc&edis_id=HZ-20150408-47678-CA
HAZMAT in Vietnam on Monday, 06 April, 2015 at 17:43 (05:43 PM) UTC.
Extract:
It remains a question why it took such a long time for the steel mill to notice the disappearance of the capsule, believed to contain highly radioactive cobalt-60. The province’s department of science and technology told the press on Monday that one can be exposed to radiation with the level of 2.5 millisieverts per hour when being about 10 centimeters from the Pomina 3 plant’s capsule. That level is alarmingly high considering the annual dose limit for general public is 1 millisievert.
Comment:
Read my post on scrap metal contamination below, to get a better idea of how much highly radioactive contaminated material is getting into scrap metal recycling system.
http://hisz.rsoe.hu/alertmap/site/index.php?pageid=event_desc&edis_id=HZ-20150406-47661-VNM
EnviroReporter.com is my #1 rad information site!
(No others even compare.)
The data and links contained in these archives and articles contain a lot more than just comments. The FACTS stand out.
I have actually went back and read from the beginning of this forum every comment at least once.
(took me a full day)
In my opinion Michael and Denise and other commenters here are not ‘preachers’ they are ‘teachers’. They share their knowledge freely and for that I thank them.
I have a feeling that someday, maybe soon(?), that this site will become an even greater asset to those who seek the knowledge of how we got here and why the illusion of ‘safe’ Nuclear Power was a scam/lie that has robbed the future of everyone’s clean air and water.
I wonder if future historians, if there are any, will call this the Age of Fallout or the Age of Suffering? Maybe both. 😥
I explain the basics to people who want to know more about the issues of Fukushima’s TRIPLE MELTDOWNS and the Nuclear Industry’s stranglehold on us all as best as I can. I can debate tactfully and verbally joust with best of ‘the experts’ now. Thanks mostly to the vast knowledge contained in these pages.
@Chase: Thank you so much. Yours is an excellent observation. Allow me to add to it. Beyond the X-ray levels of gamma these poor creatures are enduring, they breath in, and eat from, this despoiled water, ruined by the greed and hubris of man.
Please share with your friends at your favorite forum and beyond, Chase, as Buesselor’s now oft-repeated hooey just keeps coming unchallenged. RadNet Air Monitoring – April 7, 2015 Nationwide Radiation Report: https://www.enviroreporter.com/radnet-air-monitoring-data/-data/-data/
@Michael – Excellent reply to Ken Buesselor oceanographer. I hope he reads this along with millions of others.
We now know that a single X-ray can damage a human fetus.
So…
Imagine the ocean creatures, large and small, who are in it 24/7/365. That means that sea creatures are getting 4 times more radiation exposure per day than a human swimming for 6 hrs.
That means every 3 months they get an X-Ray or 4 per year.
Question:
I wonder how many X-rays it takes to dissolve a starfish? 🙁
(Just rolling with the X-ray compare.)
Better question:
How much Fuku-Goo does it take to dissolve a starfish or affect it’s immune system?
Thanks ALL!
#kenbuesselor #fukushima
April 7, 2015
9:15 pm INT RAIN SAMPLE 4: 39.6 CPM^^
9:00 pm INT RSSMC: 37.2 CPM^^
6:20 pm INT RAIN SAMPLE 3: 40.0 CPM^^
5:30 pm INT RAIN SAMPLE 2: 45.4 CPM^^ which is 13.8% above background but within the Inspector Alert nuclear radiation monitor’s conservative +/-15% margin of error meaning the reading is BG. [Note that in all three rain samples, radon progeny/daughters do not impact the reading as there is none in this area.]
5:15 pm INT RAIN SAMPLE 1: 39.1 CPM^^
5:00 pm INT RSSMC: 39.9 CPM^^
NATIONWIDE RADIATION REPORT
While EnviroReporter.com‘s Spring investigations up the southern and central California coast, testing Pacific waters at multiple locations, yielded repeated samples reading at background, the April 6, 2015 edition of the Salem Oregon Statesman Journal newspaper reported that Fukushima radiation has reached North American shores much farther north off a dock in Victoria Island in British Columbia, Canada. While this unfortunate development isn’t surprising to any of the readers, viewers and listeners of EnviroReporter.com over the last four years, one quote from a self-proclaimed Fukushima radiation expert quoted in the article rang out loud and clear to us:
“Even if the levels were twice as high, you could still swim in the ocean for six hours every day for a year and receive a dose more than a thousand times less than a single dental X-ray,” said Woods Hole chemical oceanographer Ken Buesseler. “While that’s not zero, that’s a very low risk.”
Buesseler’s claim is patently false. The cesium-134 and cesium-137 in the Pacific water is not dangerous from its gamma radiation like the immense gamma blasts of “a single dental X-ray” because these beta-emitters can be swallowed when swimming in the ocean or ingested from marine life exposed to the radioactive ‘goo.’ Comparing swimming in an ocean with Fuku goo to a dental X-ray is ludicrous but easily slipped past most readers.
This reckless claim was made out of ignorance or something worse but to have this person repeatedly quoted in mainstream media saying this kind of misleading nonsense gives the reader, and especially the users of the Pacific, the less than true notion that everything is A-Okay. Unfortunately, reporters in this country are usually so inept at radiation science that Fuku hooey blown their way goes by unchallenged.
EnviroReporter.com actually knows its radiation so when we say there is no goo in the water we tested along the central and southern California coast – so far – you can trust it. We reported our results March 24 (which are followed here by our April 7 Nationwide Radiation Report).
5:35 pm INT RSSM *DRY TOWEL* PACIFIC OCEAN SAMPLE drawn at Sycamore Canyon Beach at at 3:10 pm March 21: 43.8 CPM^^ (background)
5:20 pm INT RSSM *DRY TOWEL* PACIFIC OCEAN SAMPLE drawn at beach at bottom of Latigo Canyon at 2:30 pm March 21: 39.1 CPM^^ (background)
5:05 pm INT RSSM *DRY TOWEL* PACIFIC OCEAN SAMPLE drawn at Topanga State Beach at 2:00 pm March 21: 37.2 CPM^^ (background)
4:50 pm INT RADIATION STATION SANTA MONICA BACKGROUND (BG): 39.6 CPM^^
2:25 pm EXT Carmel River State Beach Pacific Ocean water: 55.3 CPM^
2:10 pm EXT Carmel River State Beach background: 64.7 CPM^^
Readings across the United States were not as encouraging as the results of EnviroReporter.com‘s Spring investigation up the California coast. It is important to remember the following when reviewing our April 7, 2015 report following:
April 7, 2015 Nationwide Radiation Report:
Since February 2, 2014 (below in archives), Montgomery AL hit ~205 CPM April 1 but has eased to 55 CPM by April 7; Anchorage AK saw its crucial beta monitoring cease March 24; Fairbanks AK hit ~240 CPM February 15; Phoenix AZ hit a four-month high March 1 with a solid 750 CPM; Tuscon AZ, which nearly topped 380 CPM February 19; Little Rock AR registered ~155 CPM March 16; Fort Smith AR went nuts, beta-wise, and nearly hit 400 CPM twice in the last week; Anaheim CA‘s beta graph shows just ~25 CPM April 7; Fresno CA smashed through previous highs hitting ~970 CPM November 11 and then the graph died December 2 leaving a huge hole in California airborne beta monitoring; Bakersfield CA has gone off the charts – in excess of 1,000 CPM – March 15 but the April 7 reading is a low 100 CPM in comparison; Los Angeles CA‘s beta graph stopped in March 2014 never to return in America’s second largest metropolitan. On the 4-year anniversary of the ongoing triple meltdowns in Fukushima Japan, March 11, RSSMC triple HEPA filter debris test found hot dust coming in at 3.9 times background; Riverside CA‘s graph gave out September 15, 2014; San Bernardino County CA almost hit a four month high of ~340 CPM on April Fools Day which is no joke to anyone breathing that concentration compared to normal levels; San Diego no longer has a working beta graph because it died January 15 after months of erratic fits and starts; Hartford CT was an enviable ~60 CPM April 7; Washington DC registered ~135 CPM February 15-16; still not one beta monitor out of five works in Florida which is amazing; Augusta GA no longer has a working beta graph in a very active environment, unfortunately, giving out August 25, 2014 never to return; Ft. Wayne IN had a malfunctioning beta station from February 5 through March 9 so the latest period’s high is ~155 CPM April 4; Baton Rouge LA was just ~20 CPM April 7; Orono ME is the farthest functioning beta station away from the triple meltdowns at Fukushima Dai-ichi, Japan, and this lovely town has the lowest readings sometimes down into the single digits for days at a time like today with it in the single digits around 9 CPM; Baltimore MD‘s beta and gamma graphs are now ‘on’ and functioning properly with the city hitting~160 CPM on the beta scale which is nothing to be raven about; Worcester MA blew through ~320 CPM September 28 and has spiked three times in November over 200 CPM and then its beta station died December 9 and then briefly be reborn Christmas Day only to die, for good, the next day; Grand Rapids MI got up to ~165 CPM April 1; St. Paul MN was blowing through 300-350 CPM regularly before its beta station died October 16, 2014 not to return in this important upper Midwest center; St. Louis tested ~45 CPM April 7; Lincoln NE flirted with ~375 CPM March 21; Concord NH hit ~130 CPM March 8; Albuquerque NM registered ~460 CPM February 24; Buffalo NY tested at ~110 CPM March 26 settling down a bit from the last report period; New York City NY is not functioning as it hasn’t for years but its gamma gross count is sort of jumping around like LA’s gamma is – just one difference, NYC’s gamma is much more active which is one thing New Yorkers can brag about: they’re hotter than Los Angelenos even if the crucial beta station is kaput; Syracuse NY showed ~160 CPM November 26 and then the beta graph died December 1 and never came back plus its gamma station is poorly maintained as evidenced by the scant and inaccurate readings; Charlotte NC topped 220 CPM Christmas Eve bringing with it the gift of a four month high though the graph died January 13 so who knows now; Raleigh NC hit ~170 CPM July 24 and cut out and still hasn’t come back on, a real loss in the South; holy Toledo OH was ~135 CPM March 14; Corvalis OR was ~135 CPM March 15 trending lowerPittsburgh PA was ~160 CPM April 7; Puerto Rico‘s beta graph doesn’t work but the gamma has picked up in the last few weeks; Amarillo TX hit 1,000 CPM several times in the last few months and is one of the hottest sites in the country for reasons not fully understood though we are getting close to some astonishing new answers that will be published soon though we can happily report that the Texas Panhandle hub was just ~30 CPM last night; Dallas TX reached over 305 CPM on the Ides of March, March 15; Ft. Worth hit ~265 CPM February 15; Salt Lake City UT‘s beta station is still down since a huge beta increase over 200 CPM in early May 2014 and remains offline; and Madison WI hit ~170 CPM April 7, 2015 which is considerable but nothing like the highs of the last period for this Midwest center.
4/6/15
10 minute average exterior East Los Angeles, CA
44 CPM normal for this area at 3:05pm
Hector
Alert level showing up on a Burlington Vermont private monitoring station in the USA on,
at present.
Maybe a malfunction, no stations near are indicating any increase in background level. Worth keeping and eye on to see if any other stations nearby increase.
Screen Shot
http://sccc.org.au/wp-content/uploads/2015/04/Burlington-USA-060415.png
List of International live stations,
http://sccc.org.au/international-radiation-monitoring-stations
Southern Hemisphere March 2015 Background Radiation Report.
Station location
http://sccc.org.au/monitoring/Australian-Map.jpg
This short animation of Northern, and Southern Hemisphere air circulation, shows why we can get detections so far south.
March 2015 Summary
There was an increase in the March month average background levels.
March 2015 monthly average background radiation level was 33% above the pre-Fukushima average.
March average for 2014 was 31% above the pre-Fukushima average.
March average for 2013 was 32% above the pre-Fukushima average.
March average for 2012 was 24% above the pre-Fukushima average.
Technical details:
Around the 19th March Earth had a G4 level geomagnetic storm, the largest Geomagnetic solar storm to hit Earth for a long time.
http://sccc.org.au/wp-content/uploads/2015/03/Geomagnetic_-storm_18_19_March_2015.png
It did not significantly affect the background levels here, see 24 hour chart for the 18th March.
http://sccc.org.au/wp-content/uploads/2015/03/Caloundra-Australia-24-hour-local-radiation-background-chart-180315.jpg
and day average chart.
http://sccc.org.au/wp-content/uploads/2015/03/Caloundra-local-average-background-radiation-levels-March-2015.jpg
This proves that background here, near sea level, is not greatly influenced by solar storms. At least to a G4 solar storm level rating.
———————————-
From the station operator located near Cairns. Cairns on the east coast of Australia, is much closer to the equator than Caloundra.
“As you mentioned before, there was no noticeable influence on the readings, by the solar events we had during last month. Since the last cyclones, my readings here were quite flat and steady. That’s what I like to see….”
A comparison chart of Cairns (Red) and Caloundra (Yellow) background levels for March 2015.
http://sccc.org.au/wp-content/uploads/2015/04/Rad-March-R-Cairns-Y-Caloundra.jpg
———————————-
Towards the end of March the background levels at Caloundra went through dynamic swings. This significant drop in background occurred during a rain event here. The 22nd March had 32.4mm of rain, and 23rd, 24.2 mm. Rain does not necessarily bring fallout with it. It depends what directions the surface wind and rain are coming from.
(Note: The 4yr average referred to in the charts, is the 4yr pre-Fukushima average.)
What the coloured alert levels, in the bar charts indicate.
http://sccc.org.au/what-does-each-step-in-the-alert-level-colour-code-mean
March 2015 (33% above month average)
http://sccc.org.au/wp-content/uploads/2015/03/Caloundra-local-average-background-radiation-levels-March-2015.jpg
March 2014 (31% above month average)
http://sccc.org.au/wp-content/uploads/2014/03/Caloundra-local-average-background-radiation-levels-March-2014.jpg
March 2013, (32% above month average)
http://sccc.org.au/wp-content/uploads/2013/03/Caloundra-local-average-background-radiation-levels-March-2013.jpg
March 2012 (24% above month average)
http://sccc.org.au/wp-content/uploads/2012/04/Caloundra-local-average-background-radiation-levels-March-2012.jpg
Disclaimer: This is an amateur volunteer run service. Human error can provide incorrect information, and equipment malfunction can produce false readings. Do not rely on, or take action upon information presented here, without further research
Malibu Creek State Park, CA, 10 min exterior: 39 cpm
October 2000 – Radioactive Scrap Metal
Extracts:
Significant Past Incidents
At the Dijon conference the US Nuclear Regulatory Commission (NRC) reported that it is notified of about 200 lost or stolen radioactive sources each year and that since 1983 20 sources had been accidentally melted at steel works and other foundries. According to other sources, 65 meltings have occurred world-wide 9. IAEA says it is aware of 49 meltings world-wide at 1998:
…an increase of 40% within the last two years….This situation is aggravated by increasing amounts of scrap originating from decommissioning of nuclear reactors, weapons and submarines. As a result, radioactive materials entering the public domain in an uncontrolled manner are creating a serious risk of radiation exposure for workers and the public as well as excessive costs for plant decontamination and waste of product to be borne by the metal industry.
As of June 1997 the database maintained by the US Nuclear Regulatory Commission showed over 2300 reports of radioactive materials found in recycled metal scrap 10 (emphasis added)
Tip of an Iceberg?
In the US the NRC believe the 200 reports of lost, stolen or abandoned sources they receive each year probably represents the tip of the iceberg.
Comment:
You really need to read this article to get a clear idea how wide spread and large, the Radioactive Contaminated Scrap Metal issue is!
http://www.nuclearpolicy.info/publications/scrapmetal.php
@Chase: Well done! This is astonishing news not easily found in American media. The UK press has this heartwarming take with Chernobyl nuclear reactor finally gets radiation shield to protect families 28 years after disaster.
I was able to translate the other article.
Title:
”Chernobyl nuclear power plant explode threat March 8, 2015”
“The Chernobyl nuclear power plant has daily lives in emergency mode, the station deployed additional forces of protection, law enforcement work. Nuclear club have brought not only over Ukraine.”
“Ukraine’s nuclear facilities headache the whole of Europe, constantly straining and Western and Russian citizen. A country that is on the verge of economic collapse, where a civil war, and illegal armed groups do not just roam with guns and tanks move on, nuclear facilities are transformed into a potential threat to regional scale. In Ukraine, a new round of nuclear blackmail.”
“State Inspectorate for Nuclear Regulation of Ukraine, translated into enhanced security mode, waiting for an attack on nuclear facilities – Chernobyl NPP and Zaporizhzhya.”
“On February 24, the SBU has received information that March 8, 2015 at the Chernobyl Nuclear Power Plant will be implemented explosion. Information came from an unknown person on the phone. Law enforcement agencies in Ukraine during the day tried hard to detect explosive device, but to no avail, the bomb was not found. However, the protection of the object has been strengthened, introduced a special permit regime.”
“In addition to the Chernobyl nuclear power plant, stronger version of the protection introduced and Zaporizhzhya, where just waiting for the attack. SBU traditionally full responsibility for the provocation imposes on pro-Russian terrorists.”
– translated via google
http://www.newsli.ru/news/ussr/politika/13770
IMO – As long as these DNA destroying monstrosities exist we will always live with this fear. The really sad thing is, other ways, better ways of boiling water exist. Windmill farms or solar panels are not a target for terrorist threats nor do they require an evacuation zone or a long term radioactive contamination storage facility. 😉
😐 NOT in our NEWS.
Chernobyl exclusion zone shut down because of terrorist threat that came on February 24th, 2015.
I stumbled upon this while watching a new youtube user bionerd video.
I can find no other web search information regarding this.
*Translated via google translate.
“Yesterday, February 24, the SBU anonymous caller who said that on March 8, 2015 an explosion on a 3-unit of the Chernobyl nuclear power plant. This UNN to law enforcement.”
“According to security officials, in connection with a bomb threat reinforced checkpoint regime and increased protection of the object SSE “Chernobyl NPP”.
In Russian:
* http://fakty.ictv.ua/ru/index/read-news/id/1543563
http://www.newsli.ru/news/ussr/politika/13770
Here’s the video where user bionerd confirms the closure.
(first few seconds)
My maternal ancestors have lived in the Appalachian Mountains of Pennsylvania since the beginning of remembered time, carving out a living in the woods and drinking spring water. Those mountains are, to us, the family’s Garden of Eden. Back in 1975-1978, I would fly into and out of Washington, D.C. at least twice each month, and while looking out the airplane window, I would see the unmistakeably shaped stacks of Three Mile Island Nuclear Generating Plant. At the time, I would think about my long dead ancestors, and wonder how their spirits felt about this modern invasion of their woodland paradise.
Less than a year after I left for California, the “Three Mile Island Accident” occurred. At the time, there was little word on television or in the West Coast newspapers about what was occurring. I really did not have a clue, nor did my relatives still living in the sylvan paradise of rural Pennsylvania. Now, on the anniversary of the accident 36 years later, the world knows what has happened. A brief bullet point summary which appeared online:
ecowatch.com/2015/03/27/three-mile-island-36-anniversary
If Michael Collins had written a 36th anniversary article, it would have had more meat, more heart, more outrage. But even with the bare bones outline, my heart is heavy because I was not smart enough, in 1979, to call my relatives and tell them to “Get the hell out”. But they are stubborn mountain people, and would not have left their land which is so bound up in their identity.
My children and grandchildren now live down wind of both San Onofre and Diablo Canyon. If an accident were to occur at either nuclear plant, they would have about 1 day to get out. I have told them “When it happens get out”, to flee to the Gulf Coast so we can figure out what to do over the long run. Will they listen? Probably not, given the stubbornness of the daughters-in-law. So the most precious lives of the grandchildren will be irreparably damaged, like the children in Ukraine and Japan, because their mothers will not want to leave the city where they have lived since childhood and because the deadly harm coming their way cannot be seen or heard.
An even more frightening prospect is “the government” not letting them get out. To understand “government think” in a nuclear crisis, some day read “Chernobyl Murders” a novel in English by Michael Beres, about the attempt of a pregnant nuclear plant worker to flee when her dosimeter went off, and the attempts of the Soviets to stop her from fleeing to relative safety.
As a thinking society, we are so much smarter than we were in 1979, when the Three Mile Island nuclear accident happened 36 years ago. Today, talk to your family and close friends about making an evacuation plan, and get them to intellectually and emotionally commit to leaving quickly. Think through what to do if the “way out” is blocked by traffic, or by “government officials” because their mindset is little different than that of the Soviets in 1986.
Hemet, CA, exterior 10 min average: 46.4 cpm
5:35 pm INT RSSM *DRY TOWEL* PACIFIC OCEAN SAMPLE drawn at Sycamore Canyon Beach at at 3:10 pm March 21: 43.8 CPM^^ (background)
5:20 pm INT RSSM *DRY TOWEL* PACIFIC OCEAN SAMPLE drawn at beach at bottom of Latigo Canyon at 2:30 pm March 21: 39.1 CPM^^ (background)
5:05 pm INT RSSM *DRY TOWEL* PACIFIC OCEAN SAMPLE drawn at Topanga State Beach at 2:00 pm March 21: 37.2 CPM^^ (background)
4:50 pm INT RADIATION STATION SANTA MONICA BACKGROUND (BG): 39.6 CPM^^
2:25 pm EXT Carmel River State Beach Pacific Ocean water: 55.3 CPM^
2:10 pm EXT Carmel River State Beach background: 64.7 CPM^^
@vital1 et all: There is definitely a correlation between what a bunch of fracker North Dakotans are sitting on top of the huge Bakken “shale play” as it is referred to in a landmark 2013 Environment America report Fracking by the Numbers – Key Impacts of Dirty Drilling at the State and National Level. North Dakota, in the report’s latest numbers from 2012, was third in America, behind Colorado and Texas, with 1,713 fracking wells drilled that year. But it climbs to Number Two with Goo when it comes to wastewater generating a mind-boggling 1.2 billion gallons of radioactive wastewater in 2012.
That hot water has to go somewhere and now the North Dakota legislature has made sure that North Dakotans won’t know where or how much their land and groundwater is going get of this secret deadly goo. It’s clear that North Dakotans got exactly what they voted for as this decidedly ‘red’ (Republican Party) state isn’t about to let radioactive water ruin their cheap gas buzz. Future generations of North Dakotans may end up despising their ancestors for this grievous behavior but by then, it’ll be to late to do anything about it.
Frackie, I guarantee you, is delighted. The wastewater generated by her secret fracking chemical cocktails will remain just as secret, if not more.
USA
18th March 2015 – Shield North Dakota from radiation, not information
Extracts:
Do Herald readers know that the North Dakota Legislature is about to pass legislation making virtually any information about radioactive materials and radioactive waste in North Dakota confidential?
The proposed rule changes by the Health Department would let the level of radioactivity disposed of in North Dakota increase by a factor of 10. It also would let this disposal take place in special industrial waste sites.
http://www.grandforksherald.com/opinion/letters/3702199-letter-shield-north-dakota-radiation-not-information
HAZMAT in Poland on Friday, 20 March, 2015 at 06:29 (06:29 AM) UTC.
Extract:
On the 6th of March 2015 total of 22 containers with Co-60 category 4 and 5 (activity between 40 MBq and 500 MBq on 2015-03-06) radioactive sources were stolen from a storehouse in Poznan. Aggregated activity of the stolen sources equals about 7 GBq. An investigation to determine the course of events and the current location of stolen sources is carried out by the police. :
Comment:
These are really hot items. I hope they track down, and recover these items soon.
http://hisz.rsoe.hu/alertmap/site/index.php?pageid=event_desc&edis_id=HZ-20150320-47418-POL
20th March 2015 – Electronic scanners detected radioactive material in a shipment of sanitary pads at Rafik Hariri International Airport in Beirut.
Extracts:
The Lebanese Finance Ministry said the 30 crates of feminine hygiene products, weighing a total 1,221 pounds, were seized Friday at Rafik Hariri International Airport in Beirut after electronic scanners detected radioactivity in the shipment.
The discovery came amid a crackdown on radioactive goods being shipped into Lebanon. Officials said customs agents at the same airport detected radioactivity in a shipment of cellphone covers imported from China in February.
http://www.upi.com/Odd_News/2015/03/20/Lebanese-customs-agents-seize-radioactive-maxi-pads/8431426870991/?spt=mps&or=5
March 18, 2015
9:45 pm INT RSSM BG: 40.5 CPM^^
9:30 pm INT West Los Angeles Basin RAIN SAMPLE: 89.4 CPM^^ which is 2.2 TIMES BACKGROUND. Aberrent storm system came in over Radiation Station Santa Monica from the northeast, which was unusual. So is the significantly higher than normal reading.
East Los Angeles gamma dose ambient level at 5:15pm.
22uR/h. Normal levels
Hector
Wb Johnson DSM-500
calibrated 6/2014
I was sitting in the local coffee shop this morning when I read a National Geographic article about Superfund sites (like Hanford, WA) in the US.
I did not realize there are more than 1700 sites and that 95 sites are currently considered ‘out of control’. Only 360 are considered ‘cleaned up’ by the EPA. While more than 1160 are under construction.
Dec 2014
By Paul Voosen
‘Wasteland’
“No one talks much about toxic Superfund sites anymore. But 49 million Americans live close to one.”
http://ngm.nationalgeographic.com/2014/12/superfund/voosen-text
This article shows some astonishing points and charts. Yet, as I read it, I see ‘blips’ of irrational logic.
Such as…
“No one talks about the dump anymore. …House prices are up again”, he said, “and most residents have stayed put”. His wife got breast cancer, but he doesn’t blame the landfill. He’s come to respect it since the EPA intervened: It’s so heavily managed that, unlike people in neighboring towns, he doesn’t worry about mudslides. – from article
“We don’t have any regrets,” Apostol said. “Where else can you go?” He could have moved, he admitted, but the commute from Montebello was too good. Living next to a waste site may not be ideal. But neither is bad traffic. – from article
Comparing toxic contamination to mudslides and freeway traffic is a clear misdirection. The resident not placing blame on the landfill causing his wife’s cancer also seems odd to me and probably very shortsighted. (What about future offspring?)
“Forty percent of Americans will be diagnosed with cancer during their lifetime, mainly the result of random errors in their DNA that arise as cells divide. As a risk factor, pollution in general ranks below smoking, obesity, diet, alcohol, and several viruses.” – from article
Maybe, if people could breath and swim they might not smoke, overeat or drink too much. Then, they could also build up their immune system to fight off viruses like we’re supposed to.
So… IMO – The POLLUTION IS the FACTOR!
🙄 😐
When I interviewed Sinn Féin president Gerry Adams for the Pasadena Weekly, I was accompanied by EnviroReporter.com‘s editor Denise Anne Duffield. I’d known Gerry since 1986 when I first interviewed him in Belfast in the six counties of northern Ireland. When it came time for photos, Gerry said “Put Denise between us – she’ll make us look better!”
Indeed, Gerry was right as the following photo attests.
Gerry, Denise Anne and I don’t drink much alcohol, if any, but drink deep from the well of freedom. That is why we heartily wish all EnviroReporter.com readers a Happy St. Patricks Day and invite them to read my Pasadena Weekly interview with Gerry at Ourselves Together – Gerry Adams posits a peaceful picture for Northern Ireland with Unionists and Republicans working together.
Maniacs indeed, Chase. Why let simple facts get in the way of fatal assumptions? The only antidote to the blizzard of hooey that surrounds the industry is to look at the hard facts. That’s why EnviroReporter.com‘s 7,322+ special tests and reports count so much – You’ve got to be able to trust the numbers.
Look at how the numbers literally add up to nothing in this March 16, 2015 New Zealand Herald story called Fukushima battles food fear factor – Region synonymous with nuclear catastrophe faces uphill battle to convince consumers its produce is safe. In this amazingly naive puff piece, which shows Prince William quaffing Fukushima food to *prove* it’s safe, there is this line:
“Last year, 10.7 million bags of rice were checked for traces of contamination. Zero point zero per cent tested positive. To fulfil this task, Fukushima’s officials had to invent a machine which could mass-measure products for radiation, similar to a Geiger counter on a conveyor belt.”
That doesn’t sound very plausible to us considering, for example, vital1’s latest comment which says:
12th March 2015 – Hong Kong Finds Radioactive Contamination in Sample of Japanese Tea
Extract:
A sample of powdered tea imported from the Japanese prefecture of Chiba, just southeast of Tokyo, had 9.3 times the legal maximum level of radioactive cesium 137 allowed in food, the Hong Kong government announced late Thursday evening.
http://www.nytimes.com/2015/03/13/world/asia/hong-kong-finds-radioactive-contamination-in-sample-of-japanese-tea.html
Those numbers add up but you won’t read that in the NZ Herald. According to the paper, there was zero radiation in tons of Fukushima rice but a place to the southeast of Tokyo, about 150 miles from the triple meltdowns, has tea hot enough to heat itself. Yes, Chase, that is maniacal.
Indeed, of the 7,322 tests and reports we count, this vital information wasn’t even included the hundreds of food tests vital1 details in our Radiation Food Lab!
These examples of pure ‘everything is okay’ baloney versus stellar radiation detection are part of the reason why we emphasize the numbers – how many detections, how many of what and how much radiation.
Waste Isolation Pilot Plant – Update
March 13, 2015
WIPP Begins Underground Decontamination Activities
“Activities are underway in WIPP’s underground facility to address the radioactive contamination that remains as a result of the February 14, 2014 event. Employees are using a MODIFIED piece of agricultural spraying equipment that allows them to apply a fine water mist to the walls and floor. The water dissolves the salt and washes it down to the floor. When the salt recrystallizes, it encapsulates the contamination and prevents any re-suspension of radioactive particles.”
“Employees performing these tasks are taking all necessary precautions, including wearing appropriate personal protective equipment.”
http://www.wipp.energy.gov/wipprecovery/recovery.html
The recovery plan.
“Recovery Plan outlines the necessary steps to resume LIMITED waste disposal operations in the first quarter of calendar year 2016.”
“Key elements of the recovery plan include strengthening safety programs, regulatory compliance, decontamination of the underground, increasing ventilation, mine stability and underground habitability, and additional workforce retraining. Additionally, findings and recommendations from the investigations of both the truck fire and the radiological release will be incorporated into WIPP actions moving forward.”
http://www.wipp.energy.gov/wipprecovery/path_forward.html
So… it’s obvious that the experts never planned for even a single canister accident in the first place.
It’s almost funny to me that they state that the findings of the radiological release will be incorporated into WIPP actions ‘moving forward’. I am guessing, but the findings will be ‘they don’t have a clue’ and the recommendation will be, to close the door. I wonder how much it cost to determine that? 🙄
One canister takes out a facility for over 2 years. Is it just me or is every nook and cranny of the Nuclear Industry a money sucking machine controlled by maniacs? 😐
@Chase et al;
We marked the fourth anniversary by wrapping up an investigative run up the central coast of California as part of three different investigations including Diablo Canyon and the Sea of Fuku Goo let loose by the triple meltdowns. Negative Pacific Ocean water radiation findings near Morro Bay and just south of Carmel. This area encompasses Big Sur. Last year we showed in Fukushima – The Perfect Crime? that there were indications of this goo as far south as Santa Cruz Bay up the coast from Carmel. This is welcome news. So was the fact that none of the food we tested show heightened radiation as we document in Eat Me!
Last year we also showed the abysmal state of media coverage of Fukushima and we’re delighted today to see a good piece in the Los Angeles Times, of all places, about the unhinged multi-billion “cleanup” going on in Fukushima today. We’d like to think the paper was influenced by our coverage to kick with it and sure enough they have.
On out trip, EnviroReporter.com editor Denise Anne Duffield and I met Dr. Helen Caldicott in Santa Barbara before her lecture on “Preserving the Future” and attended the San Luis Obispo opening of REDACTED: Transparency, Democracy & Nuclear Power which bills itself with this intriguing riddle:
They say: The truth isn’t always black or white….but what if it was, and you still couldn’t tell?
As we mark the fourth anniversary of the ongoing nuclear disaster at Fukushima, we reflect on the Japanese government’s final verdict: The tragedy was a product of collusion and lack of transparency by the nuclear industry and its regulators. We ask, “could that happen here?”
One of the lessons of Fukushima has long been lost on the American people, especially those in Southern California, is that it can happen here, especially in earthquake country. Now with fracking nearly coast to coast, the entire nation is turning into earthquake country.
Note that the following numbers of our reporting foray include our latest HEPA filter tests which show Los Angeles air surging even higher in beta radiation than in the previous period tested:
March 8, 2015
2:25 pm EXT Carmel River State Beach Pacific Ocean water: 55.3 CPM^
2:10 pm EXT Carmel River State Beach background: 64.7 CPM^^
Bubble of Fear: Surreal Photo Series Highlights Fukushima
“… a jarring reminder that all is not well in Fukushima. French photographers Carlos Ayesta and Guillame Bression (collaborating as Trois 8) present ‘Bad Dreams?’, a series of photographs calling attention to the eerie continued desolation of the Fukushima Daiichi power plant and surrounding areas that were contaminated with radiation following the earthquake, tsunami and nuclear disaster of 2011.”
🙄 We’ve passed the 4 year mark for 3 Nuclear Meltdowns that nobody knows what to do with. That’s 1462 DAYS!
http://www.wolframalpha.com/input/?i=march+11%2C+2011
March 7, 2015 – Estimation of Radionuclides in Sand and Soil Samples in the United States
Extract:
The 2012-2013 soil study consisted of 48 samples, 22 Cs137 detections, 6 of which (or 12.5%) had Cs137 activity ranging from 4.9 – 19.1 Bq/kg with Cs134 activity ranging from 3.4 – 5.8 Bq/kg. The Cs134/137 ratio ranged from 0.27-0.84 with an average of 0.49 and a median of 0.52. This 2014 study consists of 60 samples, 30 Cs137 detections, 10 of which (or 16.7%) had Cs137 activity ranging from 5.7 – 10.2 Bq/kg with Cs134 activity ranging from 1.2 – 3.4 Bq/kg. The Cs134/137 ratio ranged from from 0.21-0.46 with an average of 0.34 and a median of 0.3.
Comment:
This would have to be one of the largest privately conducted, publicly available radiological surveys, I have seen conducted in the USA since Fukushima.
This more than just a survey of Cesium, it also includes the Uranium and Actinium Series, Thorium Series, Neptunium Series, Cobalt-60 and more.
http://eagerlabassistants.com/soilproject2014.html
7th March 2015 – Discovery of radioactive tritium in snow and ice outside a Hope Creek building at levels 500 times higher than federal water quality standards.
Extract:
The latest cold snap has delivered a troubling surprise at PSEG Nuclear’s Salem/Hope Creek reactor complex: Discovery of radioactive tritium in snow and ice outside a Hope Creek building at levels 500 times higher than federal water quality standards. At an estimated 10 million picocuries per liter in a confined area, it was the second-highest concentration reported in any tritium leak and pollution incident nationwide.
http://hisz.rsoe.hu/alertmap/site/index.php?pageid=event_desc&edis_id=ED-20150307-47226-USA
Southern Hemisphere February 2015 Background Radiation Report.
Station location
http://sccc.org.au/monitoring/Australian-Map.jpg
This short animation of Northern, and Southern Hemisphere air circulation, shows why we can get detections so far south.
February 2015 Background Summary
Pretty much the same as last month. We see a drop in the month average background level for February 2015, and the rain water test shows manly Beryllium Be-7, and Lead Pb-210. The traces Iodine I-129 and Uranium U-235 showing up in the previous years rain water tests, are now below the reliable detection levels of the equipment here.
The good news is that background levels here have stabilized, at least at this location in the Southern Hemisphere. I still detect the occasional event. These detection events are generally not as large, or as frequent as previous years.
February 2015 monthly average background radiation level was 30% above the pre-Fukushima average.
February average for 2014 was 40% above the pre-Fukushima average.
February average for 2013 was 39% above the pre-Fukushima average.
February average for 2012 was 37% above the pre-Fukushima average.
Technical details:
(Note: The 4yr average referred to in the charts, is the 4yr pre-Fukushima
average.)
What the coloured alert levels, in the bar charts indicate.
http://sccc.org.au/what-does-each-step-in-the-alert-level-colour-code-mean
February 2015 (30% above month average)
http://sccc.org.au/wp-content/uploads/2015/02/Caloundra-local-average-background-radiation-levels-February-2015.jpg
February 2014 (40% above month average)
http://sccc.org.au/wp-content/uploads/2014/02/Caloundra-local-average-background-radiation-levels-February-2014.jpg
February 2013 (39% above month average)
http://sccc.org.au/wp-content/uploads/2013/02/Caloundra-local-average-background-radiation-levels-February-2013.jpg
February 2012 (37% above month average)
http://sccc.org.au/wp-content/uploads/2012/04/Caloundra-local-average-background-radiation-levels-February-2012.jpg
February 2015 Rain Water Test Report
Summary:
February rainfall was 426.6mm.
Beryllium Be-7 can be made by spallation in the upper atmosphere, during solar events, and takes around two weeks to reach the surface. Lead Pb-210 is a decay daughter of Radon Rn-222. Both these isotopes can also be released from a
Nuclear accident.
Roof down pipe filter design for rain water testing.
http://sccc.org.au/down-pipe-filter-design
Rain Filter Test Chart (The chart is minus background.)
In this chart I have CPS on the Y axis to show activity, and have turned off Y log to show linear scaling. This is only a test chart of the polyester part of the rain water filter system design. The Polyester filter actually captured more than the carbon filter.
Chart
http://sccc.org.au/wp-content/uploads/2015/03/Down-pipe-February-polyester-filter-test-030315-TV67-26c-86029-B-text.jpg
Previous rain water and soil tests can be found here.
http://sccc.org.au/pages/The-Food-Lab.html#Soil%20Testing%20Results
Glendale rain activity measures near normal March 2nd, 2015
44.2 CPM sample from brief but intense shower
40.2 CPM background
Even though the rain shower was briefly intense and produced 1/8″ of rain in about 30 minutes, there was no thunderstorm activity. The radiation measurement was only about 10% above background, well withing normal variation of background levels. This is good news!
23th February 2015 report from a contact located near Cairns, in North Queensland Australia.
“I had the alarms set at 0.400 uSv nearly going continuously from about 13:00 till about 17:00 with peaks close to 0.700 uSv. We had a local thunderstorm around 16:30 with about 4mm of rain.
The rain seemed to have replaced the lower air, with air from higher altitudes and stopped the frequency of the alarms to close to zero after 18:00.The readings are still well above of what I have recorded as background before, which was around the 0.130 uSv level for the recent months without any events. The daily average increased again to 0.177 uSv. Keep watching, how it develops further.”
Here is a chart comparing February day background averages of Caloundra (yellow) and near Cairns (red) Queensland Australia. Ignore the red line peak at the beginning of the February, as the Cairns Geiger counter was being used to test an imported food item at the time. The monitoring station near Cairns is a lot closer to the tropics, than the Caloundra Queensland monitoring station.
Two cyclones hit Northern Australia at that time, and it is suggested that these weather events created this uptick in background detections.
Comparison chart, (Thanks to the Cairn’s monitoring station operator for creating this chart.)
http://sccc.org.au/wp-content/uploads/2015/03/Near-Cairns-February-2015.jpg
Queensland Map
http://www.mapsofworld.com/australia/states/queensland/road-map.htm
March 1, 2015
2:45 pm INT RSSMC BG: 42.3 CPM^^
2:30 pm INT RSSMC rain sample: 48.6 CPM^^ or 14.9% above subsequent background which is within the Inspector nuclear radiation monitor’s +/- 15% conservative margin of error.
11:15 am INT RSSMC BG: 41.0 CPM^^
11:00 am INT RSSMC rain sample: 42.3 CPM^^ or background with no radon daughters per usual.
February 22, 2015
12:05 pm INT RSSMC BG: 41.0 CPM^^
11:40 am INT RSSMC RAIN SAMPLE: 50.4 CPM^^ or 22.9% above subsequent background
Hemet, CA rain. Soaked a paper towel, tested it when it was dry. Came out at 44.5 cpm, which is bg.
Watch LIVE now! – day two of Dr. Caldicott’s symposium
http://totalwebcasting.com/view/?id=hcf
Here’s an IAEA video about Fukushima’s decommissioning.
Juan Carlos Lentijo, Director of the IAEA Division of Nuclear Fuel Cycle and Waste Technology speaking.
Fukushima Decommissioning Mission:
A Report from the Team Leader
Published on Feb 17, 2015 3 min
My general observations:
Maybe I look at things differently, but when I watch this video I noticed…
1. The heavy lead suits worn by the workers.
2. The lack of ‘eye protection’ in many cases.
3. Almost no females involved in these groups.
4. Everybody looks over the age of 50.
5. None of the TEPCO workers are smiling.
Video states that are 70 new Nuclear Reactors planned. 🙁
Personally I don’t think ‘decommissioning’ is a good word to describe what is occurring around the ongoing TRIPLE MELTDOWNS. I am not sure what word could even come close to describing it. (?) I don’t think there is a word that covers working in a man made Hell. 😐
@vital1: I heartily concur. According to the “Prepared Remarks of NRC Chairman Stephen G. Burns, Platts 11th Annual Nuclear Energy Conference, February 17, 2015 – Washington, D.C.,” sent to us by the U.S. Nuclear Regulatory Commission, the NRC is going to do even less than it has already.
Even though the NRC is overseeing five new reactors being built, “the NRC is being scrutinized by its stakeholders for its responsible use of resources,” according to Burns. That means the nuclear power industry wants the NRC to pare back its already woeful oversight of America’s aging and increasingly dangerous reactors.
“The agency’s FY 2016 proposed budget reflects the NRC’s efforts to demonstrate its responsiveness to the new context in which we find ourselves,” Burns said of the NRC happily caving in. “The proffered budget reflects a proposed reduction of 140 full time equivalent employees, and a reduction of $27.3 million from the FY 2015 submission. I also expect that the NRC’s FY 2015 fee rule, which will be published in the coming months, will reflect a reduction in licensee annual and hourly fees that are a result of decreases to account for lower than anticipated staffing needs.”
Burns bragged of “right-sizing the agency” and “streamlining” it which just must make those government-subsidized atomic titans of industry rub their gooey hands together with joy. Craven, outrageous and criminal does not begin to describe what added dangers this potentially puts us in.
Feeling safer, America? Or should I put that ‘the world’ as what melts down goes around the globe as Fukushima readily shows.
@ Michael,
In my opinion Industry self regulation doesn’t work. There is to much self interest to take short cuts to save money. The regulator gets squeezed to cut costs, which means public and worker safety are placed at risk. I have seen this so many times across multiple industries.
The problem with the Nuclear industry is one major accident can contaminate half a country, and leave its land and water contaminated for centuries!
Do cyclones draw Fukushima radioactive air contamination through the equatorial barrier, into the Southern Hemisphere?
Caloundra (Queensland Australia) 22th February 2015 – The remnants of Tropical Cyclone Marcia came and went, the day average background here actually dropped then rose.
http://sccc.org.au/wp-content/uploads/2015/02/Caloundra-local-average-background-radiation-levels-February-2015.jpg
The dip in the day average occurred a day before the degraded Cyclone Marcia was closest to here. We had around 330 mm rain over a few days. This suggests whatever was in the air was being washed out.
Geiger counter testing of a car bonnet rain swab collected on the 20th, 630 cpm or ~1.0 uSv/hr. Not nearly as high as other rain event tests.
When placed in the scintillator there was very little Radon-222 present, again not nearly as high as previous rain swab tests. The rain swab is also not showing any significant Be-7 or Pb-210, as recent rain test have shown. Radon levels were low averaging around ~ 0.5 pCi/l over that period. As the tail of Cyclone Marcia left the area we had a wave of radiation pass through. Haven’t seen this type of radioactive cloud stand out event since late 2011, 2012, and 2013.
Here is the 24 hour chart.
http://sccc.org.au/wp-content/uploads/2015/02/Caloundra-Australia-24-hour-local-radiation-background-chart-210215.jpg
—————
(Caloundra is in Southern Queensland and Cairns is in Northern Queensland Australia.)
Report from a contact near Cairns in North Queensland, 20th February 2015
“I would like to report an unusual event yesterday. Yesterday 20. Feb 15 between 17:00 and 18:00 the alarm set at 0.400 uSv on my Gamma Scout kept sounding continuously. The daily average reading after midnight was 0.167 uSv, a value, that I have never had that high since I started using the instrument about a year ago. As per this morning, the readings still persist around the 0.150 to 0.160 uSv mark. There does not appear to have been any serious solar events. The weather here has been sunny, up to 33 C hot and humid.”
Chart
http://sccc.org.au/wp-content/uploads/2015/02/Cairns-February-2015.jpg
Category 4 cyclone Lam also hit the Northern Territory of Australia, as category 5 Tropical Cyclone Marcia hit Queensland Australia. For two cyclones to hit Australia at the same time is very unusual.
Light rain in Hemet, CA.
Interior bg: 43.9
paper towel rain sample: 60.6
[Editor: 38.0% above background]
😐
I wonder what it must be like to work for the NRC. I can imagine a TYPICAL EVENING going home to the wife and kids and giving the lowdown on what happened at work that day.
“Yes, honey… I assisted in stopping a Nuclear Core Meltdown today that may have saved every living thing on the planet from having it’s DNA damaged. Only a ‘tiny’ amount of radiation was released, we averaged out the RISK so it was low enough for Federal standards to be met yet again. I am hoping for an even better day tomorrow. I feel Nuclear Power is now even safer knowing we have chainsaws and axes at the ready too… don’t you? Could you be so kind as to bring me a glass of wine dear, oh… just bring the whole bottle.”
– NRC worker (anonymous)
😉
@vital1 et al: What would be the new chairman of the U.S. Nuclear Regulatory’s take on all this be? Look at a couple of snips from what NRC Chairman Stephen G. Burns Platts said at the 11th Annual Nuclear Energy Conference February 17, 2015 in Washington, D.C.
“The agency’s FY 2016 proposed budget reflects the NRC’s efforts to demonstrate its responsiveness to the new context in which we find ourselves,” said Burns. “The proffered budget reflects a proposed reduction of 140 full time equivalent employees, and a reduction of $27.3 million from the FY 2015 submission.”
So increased challenges means cut the NRC by 140 positions? Wow. They aren’t paid for by the taxpayer but by the nuke power industry, folks.
“Although the agency’s workload in many areas is getting smaller, I would be remiss if I did not mention that the agency and industry have expended a significant amount of effort to address the lessons learned from the accident in Japan,” Burns continued. “For instance, I recently visited the North Anna nuclear plant in Virginia, and focused on looking at that licensee’s post-Fukushima modifications, particularly those designed to address beyond-design-basis accidents. I thought it remarkable the level of planning that has gone into considering what might go wrong, from the color coding of emergency electrical connections, to the stockpiling of extra equipment, and even the acquisition of axes and chainsaws to remove debris that might hamper plant staff in responding to plant conditions.” [Our emphasis]
That’s it then, folks! Reduce staff hugely and get those axes and chainsaws handy. This is your NRC. Feeling safer?
Thanks again, vital1.
18th February 2015 – More cracks found in Belgian nuclear reactors
Extracts:
“What we are seeing in Belgium is potentially devastating for nuclear reactors globally due to the increased risk of a catastrophic failure. Nuclear regulators worldwide must require reactor inspections as soon as possible, and no later than the next scheduled maintenance shutdown. If damage is discovered, the reactors must remain shut down until and unless safety and pressure vessel integrity can be guaranteed. The nuclear industry, already in crisis, is faced with an ageing nuclear reactor fleet at increasing risk of severe disaster.”
In reaction to the findings, the Director-General of the Belgian nuclear regulator of the Federal Agency for Nuclear Control (FANC), Jan Bens, has said that this could be a problem for the entire nuclear industry globally. He added that the solution is to begin the careful inspection of 430 nuclear power plants worldwide [1].
http://www.scoop.co.nz/stories/WO1502/S00170/more-cracks-found-in-belgian-nuclear-reactors.htm
2012 – Large list of nuclear accidents, “Let The Facts Speak, An Indictment Of The Nuclear Industry.”
Extracts:
“In introducing a document of this kind, the first thing to note is that the text speaks for itself. This is not a work of analysis or opinion, but a straightforward chronology of accident, incompetence and disaster spanning seven decades.”
“We owe a debt of gratitude to all those who have documented the accidents and crimes committed within these pages, those who came before, took a hard look at the reality of the nuclear industry, and chose not to look away.”
Comment:
Thanks to Australian Greens Senator for Western Australia Fremantle, and his researchers for updating this large list of nuclear accidents. Also thanks to Kevin Blanch for pointing to this document, in one of his recent Youtube videos.
I suggest everyone download, and save a copy.
http://scott-ludlam.greensmps.org.au/sites/default/files/ltfs-full.pdf
9th February 2015 – State Finds Radioactive Material In Vermont Yankee Groundwater
Extracts:
The Vermont Health Department says for the first time it has found the radioactive isotope Strontium-90 in ground water at the Vermont Yankee nuclear plant in Vernon.
“This is more or less not surprising for a nuclear plant that’s operated for 42 years, not surprising given the fact that there have been leaks and Strontium found in the soil,” he said.
http://digital.vpr.net/post/state-finds-radioactive-material-vermont-yankee-groundwater
On 2/1/2015 I detected hot rain in Glendale, CA, along with a similar detection by Michael Collins in Santa Monica, CA. Our two locations are separated by about 15 miles. My reading of 121 CPM rain was surprising since I had not seen anthing this active in our area for some time. I wondered if this was just a fluke, or was something different happening now. I commented how surprising the storm was since it moved in quickly, and was even accompanied by lightning. However, 3.3 times background was even more surprising once Michael and I had checked our samples.
Unfortunately, we don’t see a lot of rain in the Los Angeles area during the ongoing California drought. However, I was traveling to the San Francisco area this past weekend and had an opportunity to check the rain in Union City, CA. Union City is located in the San Francisco Bay area about 350 miles NW of Los Angeles.
There were two storms in the Bay area last weekend. I was a little late arriving to the Bay area on Saturday and I did not sample the first storm. Sunday morning at 9:00 AM, I sampled the second storm which was moving very rapidly and was accompanied by 45 mph winds. It was heavy rainfall at 7:00 AM, and at 9:00 AM it was easing quite a bit so I took two samples which were slightly active, measuring 43.3 CPM, and 42.9 CPM compared to background radiation at 29.3 CPM. Later in the day there was clearing followed by a light shower. I took another sample at 3:00 PM and found that it was right at background, 28.0 CPM.
I’m thinking that the more vigorous the storm, the more vertical mixing there is in the atmosphere. Strong updrafts and downdrafts may be bringing radidoactive particles down from higher aloft where the can be washed out to the ground by the rain. It’s a just a theory, but what we really need to know is, where is it coming from and what, exactly, are the radioactive particles involved. I doubt they are radon daughters, since these storms sweep in from the Pacific. Santa Monica in particular is literally right on the coast, Union City, too, is right off San Francisco Bay, and the wind and rain had been moving in rapidly for hours before I took my samples.
09 February 2015 – No cause for concern over nuclear explosion in ‘closed city’, say officials
http://siberiantimes.com/other/others/news/n0114-no-cause-for-concern-over-nuclear-explosion-in-closed-city-say-officials/
Extract:
‘Liquidators and workers insist [it is] nothing serious but just to be on the safe side it is not recommended to open doors and windows and to stay outside for long.’
Comment:
That builds confidence doesn’t it!
@Chase.
The pre-Fukushima four year recorded average here was ~ 0.1 uSv/hour. The recorded low background levels have allowed the detection of any changes in background levels since Fukushima.
The GammaScouter Geiger counter 2007 to 2011 data recording was once a week from 2007 to early 2011. It doesn’t show much seasonal variation. Statistically the 2007 to 2011 data is not as accurate as the GammaScout recorded 2012 to 2015 data, as it is now recording local background levels every 60 seconds.
Pre-Fukushima 2007 to 2011 local background level chart.
http://sccc.org.au/wp-content/uploads/2012/04/Caloundra-local-average-background-radiation-levels-2007-to-2011.jpg
The peak in the pre-Fukushima background level chart around September 2008 was probably an experiment being carried out at the time.
After Fukushima a seasonal variation showed up in the year average charts. Northerly winds tend to come from the equator in the warmer months. In the cooler months, it tends to come from the Southern Ocean. The station location is on a headland, so there can be significant changes in background levels as the wind changes from North to South.
After you average out the season differences here, the yearly increase since Fukushima has averaged around 21%.
The 2012 year average was 21% above the pre-Fukushima 4 year average.
http://sccc.org.au/wp-content/uploads/2012/09/Caloundra-monthly-average-background-radiation-levels-for-2012.jpg
The 2013 year average was 22% above the pre-Fukushima 4 year average.
http://sccc.org.au/wp-content/uploads/2013/02/Caloundra-monthly-average-background-radiation-levels-for-2013.jpg
The 2014 year average was 20% above the pre-Fukushima 4 year average.
http://sccc.org.au/wp-content/uploads/2014/02/Caloundra-monthly-average-background-radiation-levels-for-2014.jpg
———————
This type of dynamic in 24 hour data charts where common in late 2011 and 2012.
Example 1:
http://sccc.org.au/wp-content/uploads/2012/01/24-hour-background-radiation-chart-27012012.jpg
Example 2:
http://sccc.org.au/wp-content/uploads/2012/04/24-hour-background-radiation-chart-20042012-1024×460.jpg
It showed significant waves coming through. When it was from a Northerly direction, background went up. When wind direction was from the Southern Ocean, background tended to go down.
Now the increases showing on the 24 hour charts are much more averaged, and no where near as dynamic. This suggests that what ever was in the air in 2011 and 2012 that crossed the equatorial barrier, has had time become more evenly distributed into the southern hemisphere air mass.
http://sccc.org.au/wp-content/uploads/2015/02/Caloundra-Australia-24-hour-local-radiation-background-chart-221114.jpg
It would be nice if other locations had pre and post Fukushima long term publicly available background data. This would
make a lot easier to see accurately what is happening worldwide.
As radiation fallout does not fall evenly, there will be areas that have seen significant background increases, and other areas that only seen small increases.
@vital1 @Anybody
The sccc charts for the location in the Southern Hemisphere are saying that ‘basically’ you’ve been at 40% or greater from pre-fuku background for the fourth consecutive year.
Common sense would suggest that the Northern Hemisphere must be much higher. And certain parts, like the west coast from Alaska to Mexico, should be even higher yet.
Are there any data charts anywhere that would accurately and clearly show our [USA] average background increase?
Known FACT: It has increased because of ongoing TRIPLE NUCLEAR PLANT MELTDOWNS.
Unknown: By ‘how much’?
Are we, or have we, been getting a consistent low dose or ‘uh oh’ doses of radioactive contamination? …or both?
IMO – Both!
__________
Side note:
A general observation, but perhaps worth noting for historical purposes. Over the last 2 weeks I have met 6 people who have within the last 4 years had THYROID nodules or issues. Only 1 was over 50. That seemed VERY odd to me. Many people do not speak of their medical issues. How many more are there hiding in a radioactive thyroid closet? Is it here and even though we see it in front of us we still all hang on to the notion that ‘this just can’t be true’?
Dang! 😐
Thanks Michael,
————————–
Southern Hemisphere January 2015 Rain Water Test Report
Summary:
As you can see there was more Beryllium Be-7 detected than Lead Pb-210 this month. January rainfall was 149.2 mm.
Beryllium Be-7 can be made by spallation in the upper atmosphere, during solar events, and takes around two weeks to reach the surface. Lead Pb-210 is a decay daughter of Radon Rn-222. Both these isotopes can also be released from a Nuclear accident.
My view is that because of the upper atmosphere damage caused by the Fukushima nuclear catastrophe, and a weaker magnetosphere, smaller solar events are now having a greater impact on the Earth’s upper atmosphere. This is a possible explanation for the increased Beryllium-7 detections in rain water washouts here.
I have provided two test charts, one is the normal minus background. The other uses a new SuperDeconvoluzione feature in Theremino 6.7 that provides results that are very similar to those obtained with the expensive high purity Germanium detectors.
Station location,
http://sccc.org.au/monitoring/Australian-Map.jpg
Roof down pipe filter design for rain water testing.
http://sccc.org.au/down-pipe-filter-design
Rain Filter Test Chart (The chart is minus background.)
In this chart I have CPS on the Y axis to show activity, and have turned off Y log to show linear scaling. This is only a test chart of the polyester part of the rain water filter system design.
Chart normal view minus Background
http://sccc.org.au/wp-content/uploads/2015/02/Down-pipe-Caloundra-January-polyester-filter-test-030215-TV63-26c-84645-B-text.png
Chart using the new SuperDeconvoluzione feature
http://sccc.org.au/wp-content/uploads/2015/02/Down-pipe-Caloundra-January-polyester-filter-test-030215-TV63-26c-84645-B-DC.png
Disclaimer: This is an amateur volunteer run service. Human error can provide incorrect information, and equipment malfunction can produce false readings. Do not rely on, or take action upon information presented here, without further research.
@vital1: Excellent report showing how much hotter things have gotten in the Southern Hemisphere, in the most ancient land on Earth, Australia. Your reports and authoritative and essential Radiation Food Lab on EnviroReporter.com make us all richer in knowledge, knowledge that can protect lives. Thank you.
@All: More number crunching but at least today’s rain in the western Los Angeles Basin seems cool for radiation, unlike the last storm:
Southern Hemisphere January 2015 Background Radiation Report.
Station location
http://sccc.org.au/monitoring/Australian-Map.jpg
This short animation of Northern, and Southern Hemisphere air circulation, shows why we can get detections so far south.
January 2015 Summary
There as been a small decrease in January background. This is good news, and means that background levels are not increasing at present, and have stabilized. At least at this location in the Southern Hemisphere.
January 2015 monthly average background radiation level was 40% above the pre-Fukushima average.
January average for 2014 was 41% above the pre-Fukushima average.
January average for 2013 was 52% above the pre-Fukushima average.
January average for 2012 was 43% above the pre-Fukushima average.
Technical details:
(Note: The 4yr average referred to in the charts, is the 4yr pre-Fukushima average.)
On the 26th January 2015 it was 80% above pre-Fukushima average levels on the 26th January. This put the monitoring station into it’s second alert level. It was a hot, humid, fine day.
What the coloured alert levels, in the bar charts indicate.
http://sccc.org.au/what-does-each-step-in-the-alert-level-colour-code-mean
Background radiation charts for January, from 2012 to 2015.
January 2015 (40% above month average)
http://sccc.org.au/wp-content/uploads/2015/01/Caloundra-local-average-background-radiation-levels-January-2015.jpg
January 2014 (41% above month average)
http://sccc.org.au/wp-content/uploads/2014/01/Caloundra-local-average-background-radiation-levels-January-2014.jpg
January 2013 (52% above month average)
http://sccc.org.au/wp-content/uploads/2013/01/Caloundra-local-average-background-radiation-levels-January-2013.jpg
January 2012 (43% above month average)
http://sccc.org.au/wp-content/uploads/2012/03/Caloundra-local-average-background-radiation-levels-January-2012.jpg
NATIONWIDE RADIATION REPORT
2015/02/02 at 12:01 am
The system that brought hot rain to Southern California January 30, covered in High radiation detected in L.A. rain, chugged east through the American southwest and southeastward over Mexico.
Dale Ramicone of Radiation Station Glendale California had virtually the same amount of beta-emitting radiation in his rain sample, 3.2 times background coming in at 121.2 Counts Per Minute (CPM) that we did at Radiation Station Santa Monica California. Our results were 3.3 times background at 131.7 CPM.
We noticed several interesting phenomena with the storm’s advance over Arizona. During the rains, beta radiation levels in Phoenix and Tuscon actually went down. This may be due to the fact that the storm system could have washed out the high airborne radiation while it was raining. The EPA RadNet stations are air sensors, after all, and seemed to pick up less beta during the precipitation.
The object of our attention is beta radiation. Once again, several significant beta stations have gone offline while a couple of crucial ones are sputtering to life.
Since November 23, 2014 (below in archives), Montgomery AL hit ~170 CPM December 16 but has settled down around 50 CPM in the last few days; Anchorage AK also hit a four month high reaching ~165 CPM December 13 which is the first time it has reached that dubious milestone since EnviroReporter.com began tracking its beta radiation totals in this increasingly active area; Fairbanks AK also hit a four-month high inching past the previous ~245 CPM October 31, topping ~255 CPM Christmas Day 2014; Phoenix AZ in the Grand Canyon State is getting hammered with beta rads and hit a four-month high November 27 with ~735 CPM; Tuscon AZ, which nearly topped 450 CPM October 31 also hit the beta jackpot November 27 with a solid 700 CPM in an area where folks move to breath the clean and dry desert air; Little Rock AR has been settling down and hovered just under 100 CPM February 1; Fort Smith AR hit 250 CPM December 1; Anaheim CA‘s beta graph started working August 7 then went dead completely August 15, and now has been back since November 25 showing three 300 CPM days in this latest period; Fresno CA smashed through previous highs hitting ~970 CPM November 11 and then the graph died December 2 leaving a huge hole in California airborne beta monitoring; Bakersfield CA has gone off the charts – in excess of 1,000 CPM – half a dozen times in early to mid-November, and then blazed though 1,000 CPM again in this latest period seven times; Los Angeles CA‘s beta graph stopped in March 2014 but the gamma seemed quite jumpy in late December through mid-January 2015. A January 10 RSSMC triple HEPA filter debris test found hot dust coming in at 10.1 times background; Riverside CA‘s graph gave out September 15 after repeatedly slamming through the ‘Oh NO!’ threshold of 250 CPM and has stayed out leaving Southern California in the dark about a basic need-to-know environmental concern; San Bernardino County CA hit a four month high of ~345 CPM January 21; San Diego no longer has a working beta graph because it died January 15 after months of erratic fits and starts; Hartford CT is back to humming along at low numbers with ~22 CPM February 1; Washington DC was just ~35 CPM yesterday but hit 150 CPM twice December 17 and 26; still not one beta monitor out of five works in Florida which is why EnviroReporter.com editor Denise Anne Duffield and I don’t buy Sunshine State citrus; Augusta GA no longer has a working beta graph in a very active environment, unfortunately, giving out August 25, 2014 never to return; Ft. Wayne IN has exceeded 200 CPM twice for this reporting period which is actually an improvement; Baton Rouge LA‘s four-month high was hit November 10-11 with ~290 CPM but it has settled down registering ~35 CPM February 1; Orono ME is the farthest functioning beta station away from the triple meltdowns at Fukushima Dai-ichi, Japan, and this lovely town has the lowest readings sometimes down into the single digits for days at a time; Baltimore MD‘s beta and gamma graphs are now ‘on’ and functioning properly which is great news and shows that the New Year is getting busy with four days over 100 CPM; Worcester MA blew through ~320 CPM September 28 and has spiked three times in November over 200 CPM and then its beta station died December 9 and then briefly be reborn Christmas Day only to die, for good, the next day; Grand Rapids MI got up to ~315 CPM December 1; St. Paul MN was blowing through 300-350 CPM regularly before its beta station died October 16 not to return in a place where beta has soared since the triple meltdowns began according EnviroReporter.com’s extensive archive of beta readings for this important upper Midwest center; St. Louis tested ~310 CPM December 16, a four month high; Lincoln NE hit a four-month high January 3 soaring to ~460 CPM; Concord NH hit ~195 CPM December 17; Albuquerque NM also hit a four-month high December 17 with a whopping ~860 CPM; Buffalo NY tested at ~210 CPM November 18 and jumped around going over 100 CPM half a dozen times in the latest period; New York City NY is not functioning as it hasn’t for years but its gamma gross count is sort of jumping around like LA’s gamma is – just one difference, NYC’s gamma is much more active which is one thing New Yorkers can brag about: they’re hotter than Los Angelenos; Syracuse NY showed ~160 CPM November 26 and then the beta graph died December 1; Charlotte NC topped 220 CPM Christmas Eve bringing with it the gift of a four month high though the graph died January 13 so who knows now; Raleigh NC hit ~170 CPM July 24 and cut out and still hasn’t come back on, a real loss in the South but we do have Radiation Station Harrisburg North Carolina for occasional rain radiation tests including one November 17 which showed hot rain radiating at 9.9 times background; holy Toledo OH was ~210 CPM December 17; Corvalis OR is trending higher in 2015 with ~205 CPM January 9Pittsburgh PA was ~215 CPM December 16; Puerto Rico‘s beta graph doesn’t work but the gamma remains low and steady; Amarillo TX hit 1,000 CPM January 7 and 15 at one of the hottest sites in the country for reasons not fully understood; Dallas TX goes Texas-big topping 350 CPM twice in the period before the monitor mysteriously began registering in the single digits January 20 until now; Ft. Worth hit a four month high with 360 CPM January 20; Salt Lake City UT‘s beta station is still down since a huge beta increase over 200 CPM in early May 2014 and remains offline in a state that could use the now-available Mitt Romney’s guiding hand to get that beta station up and atom; and Madison WI hit a four-month high November 25 charting ~460 CPM and was only ~40 CPM February 1.
@Chase: Excellent observations from someone who really knows what he’s talking about. Our hot Los Angeles rain was tested, videotaped and written about in a new post soon to go up later today. Don’t miss it, Chase and fellow raddies.
Live Fukushima Webcam observation.
When I see a significantly higher reading, like EnviroReporter.com #2 rain sample Jan 30, I usually go back about 5 days to see what was happening on the Fukushima webcam live recording.
When I took a look to the morning videos for the 25th of January webcam archives on youtube, I find several recordings that have been ‘clipped’ short. (?) To me this is usually an indication that issues were happening that ‘they’ don’t want anyone to see. Sometimes people record there observations as they see it, knowing that the archive footage may disappear. Normally the archive recording is compressed at 20x speed to be 1 hour in 3 minutes.
😐 – ONLY 7 seconds here, but it’s obvious things are not going well.
Morning January 25th
yt user – Fuku1live
2015.01.25 09:00-10:00 jst
Hmm…? 😉
January 30, 2015
4:00 pm: RSSMC INT RAIN SAMPLE #2: 131.7 CPM^^ which is 3.3 times BACKGROUND which is HAZARDOUS. As previously reported, California Highway Patrol considers anything over 3 times background to be a tripwire for a HazMat (hazardous materials) situation necessitating appropriate protective protocols. Keep children and pregnant women from directly being exposed to this rain shower. Wet clothes should be taken off once at home and washed normally. This is the first really hot rain in Los Angeles in a while. Act appropriately.
3:40 pm: RSSMC INT RAIN SAMPLE: 107.7 CPM^^ which is 2.7 times BACKGROUND. Radiation Station Santa Monica California is not impacted by radon progeny/daughters as we have noted, shown and proved multiple times since March 15, 2011 when our Fukushima fallout-oriented multi-media radiation testing began.
3:25 pm: RSSMC INT BG: 39.9 CPM^^
@ Michael, “That is a remarkable repeating pattern”
Here are some theories that have been put forward so far.
1. At this time every year the earth is positioned to be irradiated by the a cosmic source from space.
2. A weather related cyclical break through of the equatorial barrier, occurs around the same time every year.
3. An annual release from the Lucas Heights Nuclear facility in Sydney.
Wind direction at the time, tends to rule out two, and three.
@vital1: That is a remarkable repeating pattern, too remarkable to seem random. Yet the only nuclear site we could find near the Sunshine Coast, Australia, is the Narangba food irradiation plant which seems unlikely as a source. This is a stumper.
@All:
Note: This alert code system here, is not based on any official government alert system. It is one set up by the station operator to indicate significant local increases.
http://sccc.org.au/what-does-each-step-in-the-alert-level-colour-code-mean
Caloundra (Queensland Australia) 26th January 2015 – It was 80% above pre-Fukushima average levels on the 26th January. This put the monitoring station into it’s second alert level. It was a hot, humid, fine day.
http://sccc.org.au/wp-content/uploads/2015/01/Caloundra-local-average-background-radiation-levels-January-2015.jpg
Almost to the day, background levels also went into the stations second alert level in,
January 2012
http://sccc.org.au/wp-content/uploads/2012/03/Caloundra-local-average-background-radiation-levels-January-2012.jpg
and
January 2013,
http://sccc.org.au/wp-content/uploads/2013/01/Caloundra-local-average-background-radiation-levels-January-2013.jpg
The spread sheet I use, also has a formula set up to calculate average background from 12 midnight to 8 am. The 12 midnight to 8am average on the 26th was greater than the whole day average.
This is very unusual, for these elevated background events to be so precisely cyclical.
The only thing I can think of at present, is a weather related cyclical break through of the equatorial barrier.
I am open to suggestions.
Same scam, different country.
India, US reach nuclear deal; Obama uses executive powers to waive intrusive checks
Sachin Parashar,TNN
Jan 26, 2015, 01.54 AM IST
“The US has agreed to India’s proposal to build a risk-management insurance pool of Rs 1,500 crore to provide cover to suppliers who shunned the civil nuclear agreement because it made them liable to pay compensation in the event of a nuclear accident.”
http://timesofindia.indiatimes.com/india/India-US-reach-nuclear-deal-Obama-uses-executive-powers-to-waive-intrusive-checks/articleshow/46015682.cms
Sound familiar? 😐
There was no mention of Fukushima by the POTUS during the State of the Union Address, yet within a week he’s peddling Nuclear Power. Don’t these leaders realize that there are ongoing TRIPLE out of control NUCLEAR MELTDOWNS that are not even approachable by humans or robots.
Sometimes I get the feeling that the Nuclear Proponents are themselves ‘out of control’. Where’s the point counter point public discussion on such issues. Oh… there is none.
@Another Simi Mom: These chilling events, reported here by you so eloquently, belies the lethality of set in place nuclear bombs called reactors. Putin’s see-saw behavior makes this likely to go very wrong as his arrogance, along with stupid strategic moves, blind him to the consequences of destroying the plant. His ‘land bridge’ would be a very hot one indeed. Please keep these updates coming.
On January 19, 2015 I commented about the fighting between Ukrainian and Russian forces creating the risk of accident at the Zaphorizia Nuclear Power Plant, the largest in Europe with 5 reactors. The risk could come from armed attack or rocket bombardment.
(Note that there are English spellings of Zaphorizia, phonetic spellings of the Ukrainian word for Zaphorizia, and phonetic spellings of the Russian word for Zaphorizia. I am using the shortest English spelling. It’s all the same nuclear plant and the same territory, no matter how you spell it.)
In essence, it’s clear that the goal of the Russians, having invaded and held both Crimea and much of Ukraine’s Donetsk Oblast (a province), is that the Russians will want to control the land between Crimea and SW Russia. That land bridge is Ukraine’s Zaphorizia Oblast and Donetsk Oblast.
Today (1/24/15) the New York Times reports that Russian military operatives have announced that they are moving to take Mariupol, a city of 400,000 ethnic Ukrainians swollen with even more refugees from Crimea and Donetsk. The Russians launched a Grad rocket attack, which killed 27 people and wounded 97 so far. http://www.nytimes.com/2015/01/25/world/europe/at-least-10-killed-in-rocket-attack-in-eastern-ukraine-port-city.html?hp&action=click&pgtype=Homepage&module=first-column-region®ion=top-news&WT.nav=top-news&_r=0
Mariupol is 185 kilometers from the Zaphorizia Nuclear Power Plant.
Grad rockets are notoriously hard to precisely target, which is an important point to be made as to the Zaphorizia Nuclear Power Plant, because the likely route the Russian military operatives choose to take, to seize a wide land bridge between SW Russia and Crimea, will put the nuclear plant even closer to the rocket fire.
Vladimir Putin has bragged that if he wanted to, he could have his tanks and troops in Warsaw in 2 weeks. Instead, it appears the Russians’ current plan is to use ethnic Russian lunatics who have lived in Donetsk and Zaphorizia Oblasts as their mouth pieces, and the Russian equivalent of navy seals and green berets leading regular Russian forces, to slowly move towards Crimea and take the land bridge territory they desire, with the Zaphorizia Nuclear Power Plant in the way.
Today, in another context, someone quoted Winston Churchill’s 1938 book “While England Slept”. I see no sign that any European country has any interest in protecting the Zaphorizia Nuclear Power Plant from Grad rockets fired by lunatics or faux separatists. Will one of us be the one to write the nuclear version of “While NATO Slept”?
Every now and then I come across tidbits of information that might be important to file in ones back brain.
Such as…
The time factor when taking KI Pills after a Nuclear Accident. The warning TIME FRAME, which we had, was never officially issued. 😐
I did not realize how critical the KI TIME FACTOR was!
The KI Pill – TIME FACTOR –
Time (Hours) of KI prophylaxis —– Effectiveness
96 h before radioiodine exposure — 5%
72 h before radioiodine exposure — 32%
48 h before radioiodine exposure — 75%
24 h before radioiodine exposure — 93%
At time of radioiodine exposure —- 99%
1–2 h after radioiodine exposure — 85% – 90%
3–4 h after radioiodine exposure — 50%
8 h after radioiodine exposure —– 40%
24 h after radioiodine exposure —- 7%
Source: modified from Sternthal et al;
WHO – World Health Organization
The NRC mentions ‘time’, but leaves out the important part.
“When potassium iodide is ingested, it is taken up by the thyroid gland. In the proper dosage, and taken at THE APPROPRIATE TIME, it will effectively saturate the thyroid gland in such a way that inhaled or ingested radioactive iodines will not be accumulated in the thyroid gland. The RISK of thyroid effects is REDUCED.”
– NRC
http://www.nrc.gov/about-nrc/emerg-preparedness/about-emerg-preparedness/potassium-iodide/ki-faq.html
http://en.wikipedia.org/wiki/Potassium_iodide#Thyroid_protection_due_to_nuclear_accidents_and_emergencies
__________
A look back in history: Here’s an excerpt from a comment I left here on May 13th 2011. (radiation-station/#comment-42478)
The comment: May 2011
“What will be the first affects or signs of illness in people and/or “other” life forms that will be noticeable as a result of Fukushima? I understand the long term affects such as cancers, but what are we going to see first and how long if not already will it be? What are doctors currently seeing from those who have entered the no go zone?
I asked this because over the last week I have had 3 people, who know little to nothing about what’s going on make a statement that seemed down right odd to me. It really seemed strange because a couple of days prior to the first person’s statement I felt the same thing, but I “sluffed” it off as allergies or psychological. (or both)
Each of these people, independently, and at separate times said “Wow, it feels like my thyroid is vibrating!”. They were almost word for word. I did not say anything because I am not a Medical Professional and I would not want anyone to panic or give someone false information. My reply was, it’s probably just allergies. But, I have to admit it, I was silently thinking, this is VERY weird. Especially since I’ve never heard anyone say that before in my life and then, 3 times in one week. hmmm… I thought? So I came here to ask.
I know this sounds a bit silly, but I would like to know.”
– Chase
___________
>> I am certain now (Jan 2015) that my thyroid and many others got dosed in the days and weeks following the meltdowns at Fukushima.
Coming up on 4 years later and some of these questions have been answered.
Amazing what one can learn in just a minute.
Two Ways Ionizing Radiation Damages DNA
– One Minute Medical School
😉
Here are some of the radiation monitoring networks closest to the conflict area in the Ukraine. If the situation does deteriorate, these may help keep track of any major radiation releases.
Global Radiation Monitoring Network Drag and zoom World map to see Romanian, and other European monitoring stations stations (P)
Black Cat systems Drag world map to see European stations (P)
http://www.blackcatsystems.com/RadMap/map.html
Radiation Monitor Click geographical location buttons, or drag world map to see European stations (P)
http://radmon.org/
Ukraine Nuclear Power Plants Place mouse cursor over NPP location to see its background level, and mouse click onto the NPP location see more monitoring stations. (G)
http://www.energoatom.kiev.ua/en/map_aes/
Russian Atom Russian monitoring stations (G)
http://www.russianatom.ru/
EURDEP European Radiological Data Exchange Platform (G)
http://eurdep.jrc.ec.europa.eu/Basic/Pages/Public/Home/Default.aspx
1/19/15 6:30PM Pacific Time: We just got home from dinner, where my son’s twitter was blowing up with news about very intense fighting between Russian and Ukrainian troops in South Eastern Ukraine.
BBC America is running a tag line at the bottom of their TV screen saying there is heavy fighting in South Eastern Ukraine in Donetsk and Luhansk. They’ve now put up a story online as well. http://www.bbc.com/news/world-europe-30878406
We are digging for more information about security at the Zaphorizia Nuclear Power Plant and its 5 reactors.
Right now kyivpost.com has a story saying that 382 Russian soldiers have been killed in Ukraine in the past 3 days.
kyivpost.com also has a story saying the fighting between the Russians and Ukrainians is intense.
kyivpost.com also re-reports CNN story from 10AMish Ukraine time 1/20 that Ukrainian Prime Minister Yatsenyuk admitted that more Russian troops and supplies came into Ukraine from Russia yesterday (1/19).
I am concerned that in closing the gap between Russia’s old SW border and Crimea, that the Russians will take all of the Oblasts along the Sea of Azov including the Zaporizhia and its Zaphorizia Nuclear Power Plant which is on the Dnieper River. Zaporizhia Oblast is NE of Crimea and on the coast route from SE Russia to Crimea. See map at:
http://en.wikipedia.org/wiki/Zaporizhia_Oblast#mediaviewer/File:Zaporizhia_in_Ukraine_%28claims_hatched%29.svg
The Zaporizhia Nuclear Power Plant is on the south side of the big lake shown on the map at the northern border of Zaporizhia.
(Link to a photo of the 5 reactors by typing “Zaporizhia Nuclear Power Plant” into Wikipedia English, and when the article comes up on the left click on the word Русский and the Russian version of the article will come up with the good photo of the nuclear plant.)
FYI In Anglicized Russian word for Zaporizhia is spelled “Zaporozhye” and you may see it written that way in some news stories or on some maps.
(Link to a photo of the 5 reactors by typing “Zaporizhia Nuclear Power Plant” into Wikipedia English, and when the article comes up on the left click on the word Русский and the Russian version of the article will come up with the good photo of the nuclear plant.)
The population of Zaporizhia Oblast is approximately 75% Ukrainian and 20% Russian, so it certainly looks like there would be a significant fight right near the Nuclear power plant.
It will not be wonderful for the world if fighting, rocketing and sabotage occurs around the Zaporizhia Nuclear Power Plant.
This shows the human side of a Nuclear Catastrophe.
CBS TV 60 Minutes
Bob Simon reports on the aftermath of the disaster in Fukushima, Japan, and finds toxic ghost towns frozen in time.
( August 24, 2014, 7:23 PM – 14 minute segment)
http://www.cbsnews.com/videos/fukushima-three-years-later-2/
Some items of note:
> Inside some buildings workers can only stay for 2 1/2 hours at a time in FULL protective outfits.
> One former resident is allowed back to the site of his home 10 times a years for ONLY 5 hours. That’s with wearing protective gear.
> Children can no longer visit their ancestors graves. It’s too radioactive. 🙁
IMO – Nuclear Power is NOT SAFE. The RISK to everything is not calculable or insurable.
rain in socal… hemet, ca, wet paper towel test. int bg: 45.1 wet towel 50.9
Ukraine Zaporizhzhya Nuclear Plant Accident Cover Up?
by Peter Daley
11 January 2015
The Ukrainian civil war greatly increases the chances of a major nuclear event occurring in Europe! Ukraine has four nuclear power plants operating, and Zaporizhzhya is Ukraine’s and Europe’s largest. A number of independent Internet news sources, provide evidence that a serious nuclear accident occurred at the Zaporizhzhya nuclear plant, in the Ukraine in late November 2014.
Here is a summary of circumstantial evidence gathered from separate reports.
1. An alleged hacked conversation between two Ukrainian Officials, discussing a very serious and deteriorating situation at the Zaporizhzhya nuclear plant.
2. Leaked official report of the incident, indicating significant radioactive releases. At present, there is no confirmation that this document is genuine.
3. Romanian report of a Radioactive cloud being present in Romania after a recent nuclear accident in Ukraine.
4. Large Romanian background radiation detections from different Romanian private radiation monitoring stations, occurring around the same time the news reports of problems at the Zaporizhzhya nuclear plant surfaced.
Example:
Ukraine denies radioactive leak on Zaporizhzhya nuclear plant 30th December 2014
Extract:
Life News newswire published documents which it said came from Ukraine’s emergencies ministry, and showed that a leak at the power plant had led to a spike in radiation over the past two days, exceeding permitted norms by 16 times.
Three officials from Ukraine’s emergencies ministry, energy ministry and the plant itself told Reuters there had been no leak.
http://www.reuters.com/article/2014/12/30/us-ukraine-crisis-nuclear-idUSKBN0K81GO20141230
The circumstantial evidence in detail.
The Alleged Conversation Hack
This recent OpEdnews article refers a hacked conversation, that is alleged to have taken place between two Ukrainian officials.
General News 1/2/2015 – Zaporozhye Nuclear Problem may be even Scarier
Conversation Extract from page 3, 4 and 5
[caption id="attachment_16332" align="alignleft" width="300"]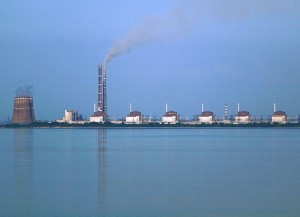 Zaporizhzhya Nuclear Plant in Ukraine[/caption]Zaporozhye Leaked Accident Conversation-
The following leaked conversation took place during the Zaporozhye incident is between Tyshenko (General Director of Nuclear Power Plant) and Torbayevsky ( Head of Emergency Readiness). The questions this should raise because the information coming to light reflect a possible situation like this are enormous.
November 28th
Tyshenko 8:12 PM- Vasili what the hell is going on over there?
8:24 – Tyshenko – Why aren’t you answering?
8:58 – Torbayevsky – Vacheslav Alexaivich, forgive me for not answering. We have an emergency. The Third Unit shut down. I am already there. Ignatchencho is with me. Krasnogorov is coming.
Tyshenko – fuck! Why the hell didn’t you tell me immediately? Do you understand the danger this will mean for us? We will be thrown in prison, you as well. Leaving now, will be there in hour.
Torbayevsky – Need to contact Chech specialists from Skoda. Its their equipment.
November 29th
Tyshenko and Krasnogorov, head engineer at plant ZGD
20:34 Tyshenko – Fiador, how are things?
Krasnagorov – Things are not good. The casket on the upper unit cannot take the pressure. Seems we screwed around with this improper material long enough.
Tyshenko – Don’t whine. You need to understand that no one asked me about any of it.
Krasnagorov – Even back then I was saying that this is not going to end well. We needed to do testing first. Its not just the caskets that are the problem. Its with the fuel as well.
Tyshenko – I said don’t whine! These are the orders the ministry gave. They warmed their hands on it already (they made their money) and let this fuck them now (let them deal with the fallout).
Krasnagorov – Understood.
December 2nd
7:48 Tyshenko and Stefansky (Assistant Plant manager)
Stefansky – Vacheslav Alexaivich as soon as you left, journalists flooded us. They are hanging out at the security checkpoint. What do I say to them?
Tyshenko 8:01 am – Listen, I am fucking barely able to stay on my feet (tired). Can’t you come up with something? Say that it is an electrical short circuit or some other shit like that, but about the reactor not a word! Blab, and I will turn you inside out (skin you)! Thats it, out, I’m getting a few hours sleep and will be back.
December 2nd
8:53 Tyshenko and Torbayevsky
Torbayevsky – Vacheslav Alexaivich, we have a leak.
Tyshenko – fuck! Where are you?
Torbayevsky – I’m at the station with the personnel, trying to fix it, but its a dead number (no use).
9:31 am Tyshenko – Ok, I called to the top. We need to be quiet now or we’ll be sent to Donbass as volunteers. Do You understand?
Torbayevsky – Understood.
12:17 Tyshenko – Vasili, I’ve been called to Kiev immediately. Figure this out without me.
Torbayevsky – What do we do with the personnel? We need to evacuate people, radiation is off the charts! And locals need to be warned. We already started dumping into the water supply from the cooling system. Very soon we will have a second Chernobyl.
Tyshenko – Don’t panic! We were told to be quiet. We’ll be quiet!
Torbayevsky – Vacheslav Alexaivich! Do you understand we can no longer keep silent? This is a catastrophe! Here in a 100 kilometer radius, nothing will be left alive! fucking sky is already glowing! (inside joke about radiation)
Tyshenko – Listen! I am flying to Kiev. Wait for a call. For now don’t answer any questions and don’t talk to anyone.
Article:
http://www.opednews.com/articles/1/Zaporozhye-Nuclear-Problem-by-George-Eliason-Chernobyl_Nuclear-Containment_Nuclear-Cover-up_Nuclear-Meltdown-150102-762.html
Leaked official report
Zero Hedge – Is Ukraine Hiding A Huge Radiation Leak At The Largest Nuclear Power Plant In Europe?
Extract:
Today, we get information of a leaked report sourced from three different place unconfirmed for now (but RT is trying to verify) that Ukrainian nuclear scientists misled the public and a radioactive leak has been detected citing the country€™s emergency services claiming that levels of radiation are 16.3 times the legally permitted norm.
Report:
http://www.zerohedge.com/sites/default/files/images/user3303/imageroot/2014/12-overflow/Ukraine%20NPP%20Image.jpg
Article:
http://www.zerohedge.com/news/2014-12-30/ukraine-hiding-huge-radiation-leak-largest-nuclear-power-plant-europe
Romanian report of a Radioactive cloud
Romania borders the Ukraine. This article if translated correctly, presents the possibility of radiation from a Ukrainian nuclear accident being detected around the northern border area of Romania. The northern border area of Romania is where the private Romanian monitoring stations detected large spikes in radiation in late November and December 2014.
Extract: (I used the Google translate service.)
Translate
06/12/2014 EVENT INFORMATION USEFUL No comments radioactive
Translation Extract:
From the first data announced by the National Meteorological administration, pollutant cloud will remain in the next 24 hours and northern border of Romania. In the first analysis, before all environmental factors values were within the natural limits. This might change, however, in the following days.
Article:
http://flamanzi.ro/nor-radioactiv-in-romania-dupa-accidentul-nuclear-din-ucraina/
High Romanian background radiation detections
These large spikes in background radiation were recorded in late November, and December 2014, on two different private Romanian monitoring stations, located in northern Romania. They are listed here in chronological order. The first Romanian detection occurred a couple of days before news reports of operational problems at the Zaporizhzhya nuclear plant surfaced.
First detection
Alert level for Timisoara Romania 26th November 2014 peak 4.48 uSv/hr.
No stations near by to confirm if it is a genuine detection, still could be equipment malfunction or a very localized event. If it is genuine, this is a very large detection.
Here is a screen shot of the chart detection.
http://sccc.org.au/wp-content/uploads/2014/11/Timisoara-Romania-261114.jpg
Global Radiation Monitoring Network
http://www.uradmonitor.com/
Second detection
Alert level Carei Northern Romania 27th November 2014.
The alert detection in Timisoara Romania on the 26th and now Carei on the 27th, would appear to be confirmation of a major radioactive release somewhere in Europe in the last couple days. Carei is north of Timisoara in Romania.
More investigation would be needed to try and pinpoint the source, and it may not be from Romania.
Screen Shot:
http://sccc.org.au/wp-content/uploads/2014/11/Carei-Northern-Romania-271114.jpg
Third detection
Another Alert level for Timisoara Romania 1st December 2014, peak 2.41 uSv/hr.
Screen Shot:
http://sccc.org.au/wp-content/uploads/2014/12/Timisoara-Romania-011214.jpg
These detections suggest there have been recent major releases, from a nuclear facility in Europe.
Forth detection
Another significant detection at Timisoara Romania on the 7th December 2014, peak 0.38 uSv/hr.
It is not nearly as large as the other recent detections of 4.8 uSv/hr, 1.81 uSv/hr, 1.17uSv/hr and 2.41 uSv/hr. These were very large free air Gamma detections from two different private Romanian monitoring stations.
Screen Shot:
http://sccc.org.au/wp-content/uploads/2014/12/Timisoara-Romania-071214.jpg
Conclusion
Yes, there is the possibility that these high detections have nothing to do with the Ukraine Zaporozhye NPP. These detections could also be equipment malfunctions, or be from local sources. I have considered these possibilities. All monitoring systems are subject to malfunctions at times. Two or more monitoring stations in proximity to each other, indicating a significant increase in background levels, are more statistically likely to be an indication of a genuine event.
All this circumstantial evidence points to a serious nuclear accident having occurred at the Zaporizhzhya nuclear plant in the Ukraine in late November 2014. Nuclear and government officials are renowned for denying any nuclear accident has occurred for as long as they can. They then play down the seriousness of the accident, once they have to admit there has been a nuclear accident. Three Mile Island, Fukushima and Chernobyl Nuclear disasters, are just a few of numerous examples. In my opinion, at this point, it would be wise to keep a close eye on the situation. Civil war and Nuclear power plants are not a good mix!
This is a free resource, listing International radiation monitoring stations. It could provide helpful information in an emergency.
http://sccc.org.au/international-radiation-monitoring-station
EnergoAtom Ukrainian Nuclear power plant monitoring web site.
http://www.energoatom.kiev.ua/en/map_aes/
@george: The rainstorm hitting Los Angeles may have been at background but the L.A. air beta readings were really high. So it’s better to compare air to air it seems, in this case. That said, the closest nuclear reactor to Bakersfield and Fresno is Diablo Canyon on the California south-central coast. We are looking closely at this controversial facility with our findings coming soon.
What might cause the beta readings around Bakersfield and Fresno to rise so dramatically? Rain samples around Los Angeles and environs apparently do not show such a dramatic escalation.
@Peter Daley, Chase, Dale Ramicone and our vigilant crew that keeps our numbers coming accurately, thank you!
December 28, 2014
12:40 pm EST SOUTHWEST MICHIGAN ROOM PACKED SNOW SAMPLE: 41.7 CPM^^ which is background
12:25 pm EST INT SOUTHWEST MICHIGAN ROOM: 42.9 CPM^^
December 23, 2014
8:45 pm EST Michael’s airline MASK: 35.4 CPM^^ or background
8:30 pm EST Denise Anne’s airline MASK: 39.6 CPM^^ or background
8:15 pm EST INT SOUTHWEST MICHIGAN ROOM: 39.6 CPM^^
9:18-9:28 am PST INT JET AIRLINER @ 36,995 feet @ 541 MPH with -52 degrees F outside jet over Missouri River from Nebraska to Missouri north of St. Joseph: 837.5 CPM^^ which is 25.5 TIMES PRIOR LAX INT BACKGROUND HIGHER
7:10 am PST INT JET AIRLINER @ 34,993 feet altitude at beginning of 10-minute test and 36,047 feet at end – east of Barstow CA heading over Mojave Desert: 778.0 CPM^^ or 23.7 TIMES PRIOR LAX INT BACKGROUND HIGHER which is why Denise Anne and Michael always wear effective masks in flight
5:40 am PST INT LAX AIRPORT TERMINAL: 32.9 CPM^^
@Michael,
“You could write this up as an article for us and I will edit it.”
Thank you Michael.
@vital1: I admit to using the leading “if true” to get even more amazing, sourced information from you. You’ve pieced together this potential catastrophe unlike anywhere else I’ve seen (unless there’s some missing sourcing, which I doubt). You could write this up as an article for us and I’ll edit it. That’s if you’d like to. And when you’re ready, or the story is ready. Our plate is full now but you’ve got a real important story here that should first live on EnviroReporter.com.
@Michael,
“if true, shocking information”
Here is a summary of the present circumstantial evidence, that points to a serious event having occurred at the Ukrainian Zaporizhzhya nuclear plant.
1. An official report of the incident indicating significant radioactive releases. At present, there is no confirmation that this document is genuine.
http://www.zerohedge.com/sites/default/files/images/user3303/imageroot/2014/12-overflow/Ukraine%20NPP%20Image.jpg
2. An alleged hacked conversation between two Ukrainian Officials, discussing a very serious and deteriorating situation at the Zaporizhzhya nuclear plant.
3. High detections reports on 3 different private live monitoring stations, on two different European monitoring networks. These detections occurred around the same time the reports of problems at the Zaporizhzhya nuclear plant came in.
Here is a new report of a very large European detection.
Information and screen shot provided by poster bo on enenews.com, “12/29 monitor station says APR but it looks like – Sicily, Italy on map”
December 28th and 30th 2014, on the netc.com private monitoring system ~45,000cpm, and 65,474 cpm.
https://www.dropbox.com/s/gcex5hx53j9m1tm/Screenshot_2015-01-03-22-34-40.png?dl=0
4. Extract: (I used the google translate service.)
Translate
Radioactive cloud in Romania, after the nuclear accident in Ukraine
06/12/2014 EVENT INFORMATION USEFUL No comments
radioactive
Translation Extract:
From the first data announced by the National Meteorological administration, pollutant cloud will remain in the next 24 hours and northern border of Romania. In the first analysis, before all environmental factors values were within the natural limits. This might change, however, in the following days.
Article:
http://flamanzi.ro/nor-radioactiv-in-romania-dupa-accidentul-nuclear-din-ucraina/
This article if translated correctly, presents the possibility of radiation from a Ukrainian nuclear accident being detected in on the northern border of Romania. The northern border area of Romania is where the private Romanian monitoring stations detected large spikes in radiation in late November and December.
The evidence above is weighted against reports stating everything is fine.
Ukraine denies radioactive leak on Zaporizhzhya nuclear plant – 30th December 2014
Extract:
Life News newswire published documents which it said came from Ukraine’s emergencies ministry and showed that a leak at the power plant had led to a spike in radiation over the past two days exceeding permitted norms by 16 times.
Three officials from Ukraine’s emergencies ministry, energy ministry and the plant itself told Reuters there had been no leak.
http://www.reuters.com/article/2014/12/30/us-ukraine-crisis-nuclear-idUSKBN0K81GO20141230
————————————————
“Timisoara Romania is no where near Zaporozhye, Ukraine so there may be 2 different things going on.”
Yes, there is the possibility that these high detections have nothing to do with the Ukraine Zaporozhye NPP. These detections could also be equipment malfunctions, or be from local sources. I have considered these possibilities.
All monitoring systems are subject to malfunctions at times. Two or more monitoring stations in proximity to each other, indicating a significant increase in background levels, are more statistically likely to be an indication of a genuine event.
In my opinion at this point, it would be wise to keep a close eye on the situation. Civil war and Nuclear power plants are not a good mix! If there is a serious deteriorating situation at the Ukraine Zaporozhye NPP, it may eventually be impossible to hide it.
@vital1: This is superb and, if true, shocking information. The descriptions of the “coffins” with some kind of fracked up fuel is horrifying. One interesting point to an ER reader who wrote to me is that “Timisoara Romania is no where near Zaporozhye, Ukraine so there may be 2 different things going on. If there is no plant near Timisoara perhaps a spill of fuel rods off a truck, spent or not? As to the Zap Plant the key question is what number on the International Scale and how much Ukrainian Blarney is being peddled.”
If it wasn’t for vital1, our very own Peter Daley (who operates Radiation Food Lab, Radiation Station Sunshine Coast Australia and his awesome website, we wouldn’t even know about this emerging crisis. Thank you, Peter.
More large detections 2.21 uSv/hr and 0.46 uSv/hr at Timisoara Romania, on the 3rd January 2015, on the http://www.uradmonitor.com/ private monitoring network.
Romania is next to the Ukraine.
Screen Shot:
http://sccc.org.au/wp-content/uploads/2015/01/Timisoara-Romania-030115.jpg
A number of independent Internet news sources are suggesting that a serious nuclear accident occurred in the Ukraine in late November 2014.
Note: There is now a lot of circumstantial evidence, but no official confirmation.
To get more background on the unfolding Ukrainian situation read my previous December 30th 2014 EnviroReporter.com post on this subject.
This recent article refers a hacked conversation, that is alleged to have taken place between two Ukrainian nuclear officials.
General News 1/2/2015 at 08:27:33
Zaporozhye Nuclear Problem may be even Scarier
Conversation Extract from page 3,4 and 5
Zaporozhye Leaked Accident Conversation-
The following leaked conversation took place during the Zaporozhye incident is between Tyshenko (General Director of Nuclear Power Plant) and Torbayevsky ( Head of Emergency Readiness). The questions this should raise because the information coming to light reflect a possible situation like this are enormous.
November 28th
Tyshenko 8:12 PM- Vasili what the hell is going on over there?
8:24- Tyshenko- Why aren’t you answering?
8:58- Torbayevsky- Vacheslav Alexaivich, forgive me for not answering. We have an emergency. The Third Unit shut down. I am already there. Ignatchencho is with me. Krasnogorov is coming.
Tyshenko- f*ck! Why the hell didn’t you tell me immediately? Do you understand the danger this will mean for us? We will be thrown in prison, you as well. Leaving now, will be there in hour.
Torbayevsky- Need to contact Chech specialists from Skoda. Its their equipment.
November 29th
Tyshenko and Krasnogorov, head engineer at plant ZGD
20:34 Tyshenko- Fiador, how are things?
Krasnagorov- Things are not good. The casket on the upper unit cannot take the pressure. Seems we screwed around with this improper material long enough.
Tyshenko- Don’t whine. You need to understand that no one asked me about any of it.
Krasnagorov- Even back then I was saying that this is not going to end well. We needed to do testing first. Its not just the caskets that are the problem. Its with the fuel as well.
Tyshenko- I said don’t whine! These are the orders the ministry gave. They warmed their hands on it already (they made their money) and let this f*ck them now (let them deal with the fallout).
Krasnagorov- Understood.
December 2nd
7:48 Tyshenko and Stefansky (Assistant Plant manager)
Stefansky- Vacheslav Alexaivich as soon as you left, journalists flooded us. They are hanging out at the security checkpoint. What do I say to them?
Tyshenko 8:01 am- Listen, I am f*cking barely able to stay on my feet (tired). Can’t you come up with something? Say that it is an electrical short circuit or some other sh*t like that, but about the reactor not a word! Blab, and I will turn you inside out (skin you)! Thats it, out, I’m getting a few hours sleep and will be back.
December 2nd
8:53 Tyshenko and Torbayevsky
Torbayevsky- Vacheslav Alexaivich, we have a leak.
Tyshenko- f*ck! Where are you?
Torbayevsky- I’m at the station with the personnel, trying to fix it, but its a dead number (no use).
9:31 am Tyshenko- Ok, I called to the top. We need to be quiet now or we’ll be sent to Donbass as volunteers. Do You understand?
Torbayevsky- Understood.
12:17 Tyshenko- Vasili, I’ve been called to Kiev immediately. Figure this out without me.
Torbayevsky- What do we do with the personnel? We need to evacuate people, radiation is off the charts! And locals need to be warned. We already started dumping into the water supply from the cooling system. Very soon we will have a second Chernobyl.
Tyshenko- Don’t panic! We were told to be quiet. We’ll be quiet!
Torbayevsky- Vacheslav Alexaivich! Do you understand we can no longer keep silent? This is a catastrophe! Here in a 100 kilometer radius, nothing will be left alive! f*cking sky is already glowing! (inside joke about radiation)
Tyshenko- Listen! I am flying to Kiev. Wait for a call. For now don’t answer any questions and don’t talk to anyone. ”
Article:
http://www.opednews.com/articles/1/Zaporozhye-Nuclear-Problem-by-George-Eliason-Chernobyl_Nuclear-Containment_Nuclear-Cover-up_Nuclear-Meltdown-150102-762.html
😐 It’s now the year 2015. We are coming up on 4 years of FALLOUT from the ongoing TRIPLE MELTDOWNS on the coast of Japan.
I clearly remember ‘the moment’ that I first realized that the earthquake in Japan was going to have global implications, when I understood that Nuclear Plants had most likely been damaged.
I was watching KTTV Los Angeles 10 pm News with anchors Carlos Amezcua and Christine Devine. Fox news decided to run ‘live’ video coverage direct from Japan.
I could see the cars and vans, with people in them, being swept away in real time. The tsunami waves were moving quickly across the fields and one could see the ‘concern’ in the faces of the newscasters. Carlos is a profesional anchor, but it was easy to see that he had a ‘pit’ in his stomach from what he knew he was witnessing that night.
In the days to follow, I started researching the possible different scenarios should one of the Nuclear Plants along Japan’s coast fail. As most of us now know, it wasn’t long until the Nuclear Facility exploded multiple times.
That’s when I stumbled upon an Inspector Detector showing readings from Santa Monica, CA via UStream. That led me to EnviroReporter.com. 🙂
I can remember watching President Obama say,
“Let me repeat… We do not expect harmful levels of radiation to reach the west coast…”
“That is the judgement of our Nuclear Regulatory Commission and
many other EXPERTS.”
President Obama 3 17 11 Fukushima
The things I have learned, in partial thanks to EnviroReporter.com, over these last 4 years have astounded me in many ways. For better or for worse, I feel I know more than the average guy about radiation mitigation and for that I am sincerely grateful.
I now have a better understanding of the history and the lies behind Nuclear Power. (That’s important.)
I can also clearly see the media ‘blackout’ regarding anything NUCLEAR MELTDOWN releated and the lack of thorough testing while getting a constant barage of misinformation about bananas and cosmic rays from the industry ‘paid’ experts.
On a positive note: It’s been almost 4 years and Japan has not restarted their 50+ reactors. 😉 That says a lot to me. Let’s hope it stays that way.
Dear EnviroReporter.com reader,
This year end appeal for your support is not for your tax deduction purposes. EnviroReporter.com is not a non-profit.
We don’t get government grants, corporate or private foundation support or even a board of directors telling us what to do as we investigate and expose huge environmental stories that other media either can’t or won’t cover.
What we are is an independent online journalism organization that delivers big news with a lot of wallop, all of which is backed up by a bevy of facts. That’s why you’ve supported us.
We punch above our own weight. Your continued support helps us keeps us in the fight finding the truth of some of the most important issues of our time.
Your backing produced big dividends in 2014. Here’s a sampling of what we accomplished together:
China Syndrome Town, a five-part investigative series, was published in March. This exposé of greed, corruption, and malfeasance blew the lid off schemes to shortchange the cleanup of the Santa Susana Field Laboratory at the headwaters of the Los Angeles River. The lab, also known as Rocketdyne, experienced three partial nuclear meltdowns since it opened over half a century ago.
That same month saw Fukushima – The Perfect Crime? hit our virtual newsstand on the third anniversary of the triple meltdowns in Japan. The in-depth article laid out the growing extent of radioactive contamination in the Pacific Ocean and North American continent. We also debunked meltdown deniers and even showed how California’s number one cash crop – marijuana – was threatened by Fukushima radiation in the soil it’s grown in.
October’s Lights Out revealed the threat of massive coronal mass ejections taking out America’s electrical grid for months, if not years, precipitating chaos that would include hundreds of nuclear reactors and spent nuclear reactor fuel rod melting down and catching fire. Yet, as EnviroReporter.com showed, the problem could be remedied at a relatively scant cost of two billion dollars.
Over the year we reported on rising radiation readings in the United States including U.S. air radiation surges higher and Sky high radiation readings across the U.S. Not surprisingly, these pieces garnered worldwide attention.
All this, and more, was in addition to our nine Radiation Stations, US EPA RadNet Data for the entire country organized for easy navigation and understanding, and the most comprehensive food testing results in the world, Radiation Food Lab.
We need your support to continue doing this work. Please consider donating to EnviroReporter.com so we can together take on the big environmental stories of 2015.
Happy New Year!
Michael Collins & Denise Anne Duffield
EnviroReporter.com
Is Ukraine Hiding A Huge Radiation Leak At The Largest Nuclear Power Plant In Europe?
Extract:
Today, we get information of a leaked report sourced from three different place – unconfirmed for now (but RT is trying to verify) – that Ukrainian nuclear scientists misled the public and a radioactive leak has been detected – citing the country’s emergency services claiming that levels of radiation are 16.3 times the legally permitted norm.
report:
http://www.zerohedge.com/sites/default/files/images/user3303/imageroot/2014/12-overflow/Ukraine%20NPP%20Image.jpg
Article:
http://www.zerohedge.com/news/2014-12-30/ukraine-hiding-huge-radiation-leak-largest-nuclear-power-plant-europe
—————-
Romania is next to the Ukraine.
Here are re-posts of reports by me, of very high detections from private Romania radiation monitoring stations. These detections occurred in late November, and early December 2014.
The Zero Hedge article, and these detections, suggest there has been a recent serious radiation incident in the Ukraine, that is being covered up.
—————-
Another significant detection at Timisoara Romania, on the 7th December 2014, peak 0.38 uSv/hr.
It is not nearly as large as the other recent detections of 4.8 uSv/hr, 1.81 uSv/hr, 1.17uSv/hr and 2.41 uSv/hr. These were very large free air Gamma detections from two different private Romanian monitoring stations.
Screen Shot:
http://sccc.org.au/wp-content/uploads/2014/12/Timisoara-Romania-071214.jpg
This Romanian news article when translated indicates if a nuclear release did occur at the Ukrainian Zaporozhye NPP, it would stay no longer than a day over Northern Romania.
Extract: (I used the google translate service.)
Translate
Radioactive cloud in Romania, after the nuclear accident in Ukraine
06/12/2014 EVENT INFORMATION USEFUL No comments
radioactive
From the first data announced by the National Meteorological administration, pollutant cloud will remain in the next 24 hours and northern border of Romania. In the first analysis, before all environmental factors values were within the natural limits. This might change, however, in the following days.
Article:
http://flamanzi.ro/nor-radioactiv-in-romania-dupa-accidentul-nuclear-din-ucraina/
Comment:
Still a lot of unanswered questions remain with these high detections occurring in Romania on two of the privately run Global Radiation Monitoring Network stations at the time.
————
Alert level Carei Northern Romania – 27th November 2014.
The alert detection in Timisoara Romania on the 26th and now Carei on the 27th, would appear to be confirmation of a major adioactive release somewhere in Europe in the last couple days. Carei is north of Timisoara in Romania.
More investigation would be needed to try and pinpoint the source, and it may not be from Romania.
Screen Shot:
http://sccc.org.au/wp-content/uploads/2014/11/Carei-Northern-Romania-271114.jpg
These detections where on the private Global Radiation Monitoring Network, Drag and zoom World map to see Australia stations.
————
Alert level for Timisoara Romania 26th November 2014 peak 4.48 uSv/hr.
Another Alert level for Timisoara Romania 1st December 2014, peak 2.41 uSv/hr.
Screen Shot:
http://sccc.org.au/wp-content/uploads/2014/12/Timisoara-Romania-011214.jpg
These detections suggest there have been recent major releases, from a nuclear facility in Europe.
The gem of the week:
http://www.csmonitor.com/Environment/2014/1229/Fukushima-radiation-US-West-Coast-will-likely-see-peak-by-end-of-2015
I find the unsupported commentary in this article very interesting, given the Japanese government’s total clamp-down on current data or current news about Fukushima.
As to this report, then there’s a bridge near my home I’d like to sell you.
RADIATION STATION HARRISBURG NC
obama-increases-allowable-levels-radiation-drinking-water-dramatically
Saw this on the news tonight.
KABC News Los Angeles
“Thyroid cancer on the rise among children”
(1:48 seconds)
http://news.yahoo.com/video/thyroid-cancer-rise-among-children-022846088.html
😐 EXPERTS aren’t sure why there has been an increase in thyroid cancer amongst children.
No direct mention of Fukushima fallout, of course. However, I was amazed, they did actually say…
“[Experts] say exposure to radiation is a RISK factor”.
– Newscaster
I had to shake my head and say “wow!” on that one. 😉
They said 5 children per million is normal in the USA. I have recently read that of approximately 340,000 children tested in Fukushima over 100 have thyroid cancer. That’s a BIG difference in comparison. We may see kids numbers rising even more soon.
Think of ‘how many’ have been affected and how much suffering could have been prevented if proper mitigation warnings had been issued early on. (March through June of 2011 at least) Thanks to Nuclear Proponents decisions to downplay this catastrophic global event KIDS have become regrettable collateral damage.
🙁
Wishing everyone in this community a very Merry Christmas and a healthy and happy New Year. Thanks for all that you do.
Greetings from East Los Angeles,CA
External gamma dose at 2:55pm
13uR/h-normal range for this area
Hector
WB Johnson DSM 500
Calibrated 6/14
This new status report/news story popped up concerning the current state of affairs at Fukushima. Since I’m not familiar with this news service, read it for what it’s worth. If you think this news service is not TEPCO/Japanese government manipulated, let all of us know:
http://www.japantimes.co.jp/news/2014/12/18/national/six-tons-of-tainted-water-leak-at-fukushima-no-1-during-korean-safety-tour/#.VJgmD14D54
CANADA
8th December 2014 – 地衣-カナダBC州ビクトリア Lichen – Victoria, BC
Test Results:
Victoria B.C. Canada Cs-137 51.7 Bq/kg, Cs-134 0.332 Bq/kg
http://2.bp.blogspot.com/-6y8I4Dt2loc/VIaJD2Y-b6I/AAAAAAAABbo/0BNIqeJ5eU4/s1600/vic%2Blichen%2Bresult.jpg
JAPAN
Lichen Test Results for Hachioji Tokyo Japan November 14th 2014,
Cs-137 280 Bq/kg, Cs-134 107 Bq/kg
http://3.bp.blogspot.com/-u-H2cyWuV6I/VJJUV9bc8MI/AAAAAAAABfA/mcsu5SMkJQs/s1600/koke.jpg
Big swings in day average background levels here this month. Already in first level alert for a few days.
Station Location
http://sccc.org.au/monitoring/Australian-Map.jpg
December 2014 day average chart,
http://sccc.org.au/wp-content/uploads/2014/12/Caloundra-local-average-background-radiation-levels-December-2014.jpg
Day averages have reached our first alert level here in early December 2014. The alert code system here, is not based on any official government alert system. It is one set up by the station operator, to indicate significant local background increases.
What the monitoring station alert codes mean.
http://sccc.org.au/what-does-each-step-in-the-alert-level-colour-code-mean
December 16, 2014
12:10 am 17 DEC INT BG: 41.7 CPM^^
11:55 pm INT WESTERN LOS ANGELES BASIN RAIN SAMPLE (SECOND STORM): 50.0 CPM^^ WHICH IS 19.9% ABOVE SUBSEQUENT BACKGROUND
10:45 pm INT WESTERN LOS ANGELES BASIN RAIN SAMPLE (SECOND STORM): 56.0 CPM^^ WHICH IS 30.1% ABOVE BACKGROUND
10:30 pm INT BG: 43.2 CPM ^^
12:15 pm INT BG: 42.9 CPM^^
Noon INT WESTERN LOS ANGELES BASIN RAIN SAMPLE (FIRST STORM): 41.3 CPM^^ (BACKGROUND WITH NO RADON PROGENY)
@Chase: It looks like a rainbow, alright, shooting straight up out of the complex where The Glowed at the End of the Rainbow may be (give or take a containment vessel or three).
@Los Angelenos:
December 16, 2014
12:10 am 17 DEC INT BG: 41.7 CPM^^
11:55 pm INT WESTERN LOS ANGELES BASIN RAIN SAMPLE (SECOND STORM): 50.0 CPM^^ WHICH IS 19.9% ABOVE SUBSEQUENT BACKGROUND
10:45 pm INT WESTERN LOS ANGELES BASIN RAIN SAMPLE (SECOND STORM): 56.0 CPM^^ WHICH IS 30.1% ABOVE BACKGROUND
10:30 pm INT BG: 43.2 CPM ^^
12:15 pm INT BG: 42.9 CPM^^
Noon INT WESTERN LOS ANGELES BASIN RAIN SAMPLE (FIRST STORM): 41.3 CPM^^ (BACKGROUND WITH NO RADON PROGENY)
I do not know what this anomaly is.
I know I’ve never seen a phenomenon like it before. 😯
An almost volcanic looking rainbow-spout spewing emissions over Fukushima.
Screenshot taken by me on 12/11/2015 16:15 jst via the Futuba web cam located at an intersection several miles away from the facility.
>> 12/11/2015
https://dl.dropboxusercontent.com/u/2099954/20141211%20Fuku%20futuba%20cam%20%20001.jpg
IMO – We may be witnessing what a China Syndrome looks like.
Maybe somebody could leave their theories as to what we may actually be seeing here. 😉
Is this a moment?
“It’s not the days in life we remember, rather the moments.”
– Walt Disney
@george: This is the nicest comment, George. It makes us so happy that we could be of service to you today (and all days). Denise Anne and I were marveling at the scarcity of such rain testing this morning when I asked “Are we the only ones testing the rain on the West Coast today?” We very well may be.
To extrapolate these readings perhaps farther than we should, it would seem to us that finding nothing in our rains of late means that the Pineapple Express delivered a nice clean drenching to the Glowdon State free of (hot) charge! It means for folks like you, who are smart and work outside (lucky fella), there is nothing but nice clean H2O dropping from the heavens. Great news for the snow pack too.
We failed to answer your Nov. 24 question about where such a surge of the recent radiation we reported on in Sky high radiation readings across the U.S. is coming from. It could be from be from renewed, sharp catastrophe at the Fukushima nuke plant or, if we can extrapolate from the incensed and misleading comments sent in by anonymous pro-nukers who work in the nuclear industrial complex, it could be from plants here domestically as well. Forget getting an answer out of our government.
Thank you again for the kind words. It really makes our day, George! We know now that when we test rain here in lovely So Cal and it contains zip/zilch/nada, our raddie friend George is safe and sound.
Michael thank you for the report on rain water in the LA basin. I have to work outside and I was very concerned about it. Appreciate all that you do.
December 12, 2014
8:50 am INT MAJOR STORM RAINS SAMPLE: 49.3 CPM^^ (13.6% above background = background because Inspector’s conservative margin of error is a careful +/- 15%)
8:30 am INT BG: 43.4 CPM^^
@Jolly Farmer: The site you asked this question of is run by a former TV weatherman who appears to be a climate change denier and anti-United Nations crusader.
[Only after we replied to your question did we see that you got your response from yet another anonymous commenter on this site, not the site operator.]
Shooting the breeze about the high beta readings that the U.S. EPA detected by saying “it is probably due to the sun” and the result of radon ignores several important facts.
One, for example, is that if the Sun were responsible, why doesn’t it affect all the graphs generally in the same manner? If it did, then we’d see similar upticks across the spectrum of sites. The Sun doesn’t, that’s why.
Another fact is a map of radon distribution in the United States that we included in Beta Watch which shows that many of the places where the beta is going sky high (San Diego, Fresno, Bakersfield, Amarillo, etc.) don’t have much, if any, radon at all. Radon variations are not the primary reason for these readings as our archive of EPA RadNet readings shows, and as we noted in this piece comparing 2013 to 2014 readings for several sites.
This doesn’t mean that beta radiation caused by the Sun is not measured and discounted. It is part of the background hence why EnviroReporter.com, and its associates, have conducted over 7,000 radiation tests since Fukushima began March 11, 2011, the vast majority of which have come in at background. Extensive experience doing this helps us know what’s hot and what’s not. That experience and knowledge, easily explored on this website, has been invaluable interpreting and reporting these EPA RadNet readings.
The reply ended with these falsehoods: “I know for a fact that the cited measuring stations analyze for the nuclides. The article made no attempt to include this information. Deception by omission.”
The EPA RadNet beta stations test for beta radiation and do not run gamma spectrometry at these stations to determine isotope concentrations in this online streaming testing. If they did, you can darn well bet EnviroReporter.com would include this information. But EPA doesn’t so the author of this reply who knows “for a fact” that they supposedly do means the oracle who responded to you is straight up lying and/or doesn’t know squat.
This isn’t a ‘he said, she said’ issue open for opinions. We report facts based on facts. Pro-nuclear apologists, some of which appear to have taken a sharp blow to the head, toss facts out the window because the facts don’t fit their implausible agendas.
You were right to ask us what our reaction to this nonsense is. Stick to the facts, Jolly Farmer, and the answers lay themselves out clearly.
I left this comment on wattsupwiththat.com :
“Are these readings from “natural radiation”?
I received this reply :
“Jolly Farmer: Re “skyrocketing” beta measurements. Beta emitters are created in our atmosphere as the result of cosmic radiation and high energy particles interacting with the earth’s atmospheric molecules. The predominant beta emitter is carbon-14 and other beta emitting nuclides include H-3 and Be-10. A nice blast from the sun will increase the number of beta emitters in the atmosphere. Just saying that there is an uptick in atmospheric beta measurements doesn’t mean squat without an analysis of the nuclide(s) causing the uptick. If an analysis shows an uptick in these natural radionuclides, it is probably due to the sun. Other natural air borne beta emitters includes Radon daughter products which are and can be released via a number of mechanisms including man stirring up the earth, a volcano or a forest fire. The article you cite is just another alarmist, Chicken Little article. I know for a fact that the cited measuring stations analyze for the nuclides. The article made no attempt to include this information. Deception by omission.”
Would you like to respond to this?
Southern Hemisphere November 2014 rain water test results.
Station location
http://sccc.org.au/monitoring/Australian-Map.jpg
This short animation of Northern, and Southern Hemisphere air circulation,
Summary:
Traces of Lead Pb-210 and Beryllium Be-7 were detected in the rain water. The rain fall for the month was very low at 5.2 mm.
This is only a test of the polyester part of the rain water filter system design. Tested both the charcoal and polyester components and there was not much difference in the isotope signatures captured. There was a slight difference in amounts detected in each filter type.
Roof down pipe filter design for rainwater testing.
http://sccc.org.au/down-pipe-filter-design
Test Chart (The chart is minus background.)
In this chart I have CPS on the Y axis to show activity, and have turned off Y log to show linear scaling. It is on a scale at less than one decay detection every 1000+ seconds, near the bottom of the chart.
Chart link:
http://sccc.org.au/wp-content/uploads/2014/12/Down-pipe-Caloundra-November-polyester-filter-test-031214-TV63-22c-85096-B.jpg
No room by 2015 in USA for Spent Fuel. 😯
“The Nuclear Regulatory Commission estimates that many of the nuclear power plants in the United States will be out of room in their spent fuel pools by 2015, most likely requiring the use of temporary storage of some kind.”
– wiki
http://en.wikipedia.org/wiki/Spent_fuel_pool
NRC Graph:
http://www.nrc.gov/waste/spent-fuel-storage/nuc-fuel-pool.html
😐 Storage…? Of some Kind…???
Proper planning can be critical. Thank you Nuclear Industry for thinking of our future safety.
[sarc]
Why would ‘anybody’ continue to use a power source who’s temporary waste storage solution has surpassed limits with no long term solution? I would call that crazy or criminal. (Also, I wonder what their definition of ‘temporary’ is?)
“The future relies on the citizen scientist… instead of relying on the national establishment to protect public health. The citizens have got to get involved.”
– Dr. Keith Baverstock former WHO Radiation Expert
(He’s now a whistle-blower of sorts on the politics of science.)
@Vital1: I too have read about the accident at the Zaporizhye/Zaporizhia Nuclear Power Plant, which is the largest one in Europe, with 6 reactors. Supposedly, there was a short circuit in the power outlet system, not causing any risk to the public.
The interesting point to note is that the plant is about 100 miles west of Donetsk, where the fighting has been going on between the Ukrainian Military and the Russian/Ukrainian “Separatists”. In August 2014 a European Greenpeace member Tobias Munchmeyer expressed to German publications his concern that the Soviet-era design of the reactors, covered by approximately 4′ thick reinforced concrete shells, could be pierced by armor-piercing weapons. Munchmeyer claimed that even a small aircraft crashing into one of the concrete shells could break them open.
Having lived through the severe public health crisis created by the Chernobyl accident, the ordinary people of Ukraine, Belarus and southwest Russia, including those living in the areas where the fighting is going on, are well aware of the catastrophic effects of airborne releases of radiation from the Chernobyl plant.
So lets all hope that common sense will prevail and that both sides of the fight will take care to protect the “Zap Reactors” and the people who live in Europe, since the effects of Chernobyl’s radiation are still being found in Sweden and Germany, for example.
Sky high radiation readings across the U.S.Government and private radiation stations pick up coast to coast climb surpassing summer surge
News and Analysis
U.S. Environmental Protection Agency RadNet radiation monitors have detected renewed surges in atmospheric readings of dangerous beta radiation across the country. Over a dozen metropolitan test sites have registered four-month highs inEnviroReporter.com’s most recent comprehensive assessment.
3rd December 2014 – Ukraine nuclear accident ‘no threat’: Minister
Extract:
“I know that an accident has occurred at the Zaporizhye NPP,” Yatseniuk said, asking Demchyshyn to make clear when the problem would be resolved and what steps would be taken to restore normal power supply across Ukraine.”
http://www.cnbc.com/id/102234807
Hemet, CA rainstorm.
Interior background, 10 min average: 44.6 cpm
Wet, rain-soaked paper towel, 10 min test indoors: 49.7
Another Alert level for Timisoara Romania 1st December 2014, peak 2.41 uSv/hr.
Screen Shot:
http://sccc.org.au/wp-content/uploads/2014/12/Timisoara-Romania-011214.jpg
These detections suggest there have been recent major releases, from a nuclear facility in Europe.
Read my previous post below on the alert level detections in Romania, at Timisoara on the 26th and Carei on the 27th.
Southern Hemisphere November 2014, and Background Radiation Report.
Station location
http://sccc.org.au/monitoring/Australian-Map.jpg
This short animation of Northern, and Southern Hemisphere air circulation, shows why we can get detections so far south.
Summary
November 2014 monthly average background radiation level was 29% above the pre-Fukushima average. The November average for 2012 was 31% above and 2013 was 30% above the pre-Fukushima average.
Technical details:
(Note: The 4yr average referred to in the charts, is the 4yr pre-Fukushima average.)
Day average chart for November 2014 (29% above average)
http://sccc.org.au/wp-content/uploads/2014/11/Caloundra-local-average-background-radiation-levels-November-2014.jpg
2012 Day Average chart (31% above average)
http://sccc.org.au/wp-content/uploads/2012/11/Caloundra-local-average-background-radiation-levels-November-20121.jpg
2013 Day Average chart (30% above average)
http://sccc.org.au/wp-content/uploads/2013/11/Caloundra-local-average-background-radiation-levels-November-2013.jpg
2014 Month Average chart
http://sccc.org.au/wp-content/uploads/2014/02/Caloundra-monthly-average-background-radiation-levels-for-2014.jpg
UV radiation reached extreme levels here for most of November 2014.
Why you should now also monitor local UV levels in spring and Summer in both the Northern and Southern Hemispheres.
http://www.sccc.org.au/extreme-uv-levels-in-summer
Disclaimer: This is an amateur volunteer run service. Human error can provide incorrect information, and equipment malfunction can produce false readings. Do not rely on, or take action upon information presented here, without further research.
No time to do an average in this moment, but a quick cpm check shows our rain in HEMET, CA just a little above background. Could be radon. Is not reading super hot preliminarily. Will recheck and report soon.
Here’s one of the mainstream media’s current takes on the situation at Fukushima.
Tour the Fukushima disaster zone.
CNN | Added on December 1, 2014
“Almost four years after the Fukushima meltdown, tour guides are now taking people through the abandoned neighborhoods.”
“The deadliest place on earth…”
– CNN’s Will Ripley reporting
To CNN video: http://tinyurl.com/ppop82p
IMO – The reporter is incorrect, the piano will never be played again. 😐
Observation of tour participants… no masks… ? 🙁
@Michael, Yes, I was also shocked by the “Tritium in Tucson” report, just posted into the Enviroreporter’s “Radiation Food Lab”. It was the first I had heard about this event.
Large numbers of American children would have been potentially affected by this, plus no one responsible for the large amount of radioactive contamination seems to have gone to jail.
We know that children are very sensitive to the effects of radioactive isotope ingestion.
Alert level Carei Northern Romania – 27th November 2014.
The alert detection in Timisoara Romania on the 26th and now Carei on the 27th, would appear to be confirmation of a major radioactive release somewhere in Europe in the last couple days. Carei is north of Timisoara in Romania.
More investigation would be needed to try and pinpoint the source, and it may not be from Romania.
Screen Shot:
http://sccc.org.au/wp-content/uploads/2014/11/Carei-Northern-Romania-271114.jpg
Alert level for Timisoara Romania 26th November 2014 peak 4.48 uSv/hr.
Screen Shot:
http://sccc.org.au/wp-content/uploads/2014/11/Timisoara-Romania-261114.jpg
These detections where on the private Global Radiation Monitoring Network, Drag and zoom World map to see European stations.
International monitoring station list
http://sccc.org.au/international-radiation-monitoring-stations
@george: Remember the strength of the press blackout on Fukushima, like we documented in Fukushima – The Perfect Crime?, and know the power of this silence. Yet word gets out like TEPCO saying in the last two days that the triple meltdowns were totally out of control, like we didn’t know that for over 3.5 years. The amount of radiation continuously being released into the environment just from that is getting in the Pacific and being made airborne through water to sea spray/air to water/land and to evaporation/dust in a cycle we’ve described in Beta Watch. In a nutshell, meltdowns are the only mega-disasters that get worse as time goes by, way worse. And the genetic-mutating and cancer-causing effects keep rising as do the rads. That said, we have plenty of radiation sources near some of the highest readings in the country that could also be responsible for these epic readings.
@vital1: Thank you for these stellar readings. We’ll be discussing them in a piece we’re about to publish about this latest slate of skyrocketing readings. Our gut feeling looking at the San Leandro, based on years of looking at such graphs including the NETC’s (just like we know you have), is that the equipment is functioning properly and that the recovering property market isn’t the only thing hot in San Leandro. Astonishing data.
@Chase: Among the positive things that has come out of Fukushima is getting to know folks like you and Peter, the Vital One. It is understandable that people can’t wrap their heads around the immensity of the disaster that is Fukushima because the lethal-when-it-fails technology behind it is so new to the human experience. Just 100 years ago, Madame Curie was hauling a the first X-ray machine around in a horse drawn carriage taking X-rays with the bulky thing. Today, we’re killing the Pacific yet everyday Denise Anne and I see people still stuffing their faces with sushi. And it’s only getting worse as the Sea of Goo concentrates off of Northern California and the Bay Area as it slowly oozes down towards Southern California where EnviroReporter.com will be waiting for it.
I can’t help but remember 3 1/2 years ago when I first came to EnviroReporter.com, learning about Fukushima and wondering what rad detections would be telling us come 2015.
I guess now we know.
I am surprised, at this point, with all of the evidence at hand, that more people are not involved, aware or even seem to care about Fukushima or rising rad detections.
IMO – The lack of response from government officials and academia is as frightening as it is criminal. (39 active EPA detectors seems like a joke, but it’s not)
Q: Will rad detections continue to rise over the next 3 years, decades or longer?
A: I don’t see how they could not, considering the ongoing triple meltdowns at Fukushima.
The China Syndrome explained in the movie The China Syndrome.
I think we’re there, times 3. 😐
@ Michael,
More significant spikes in radiation detected on the 24th November 2014, at the San Leandro CA monitoring station on http://www.netc.com, ~12,000 cpm, ~14,000 cpm and ~ 19,000 cpm.
Latest San Leandro chart screen shot sent to me.
http://technologypals.com.au/wp-content/uploads/2014/11/San-Leandro-24th-November-2014.jpg
These are very large detections at the San Leandro monitoring station, and it should be investigated to clarify if it is equipment malfunction, or not.
My opinion, if it is a genuine detection and not equipment malfunction, the San Leandro source is most likely local, because the detections are just so large.
These readings seem astronomically high. What could be the cause of such a surge in radioactivity? I find it hard to believe that it is all from Fukushima unless something there has changed dramatically, such as a collapse of one of the pools used to store and cool spent fuel rods. Any ideas? This could have a very severe impact on our health and the health of our environment. I’m very concerned.
@All: Here’s the video of our new U.S. Radiation Report 23 Nov. 2014
@vital1: These exceptionally high NETC readings seem to be confirmed by EPA’s RadNet system as we just reported in RadNet Air Monitoring:
2014/11/23 at 5:40 pm
Only 39 out of 124 USEPA beta monitors are functional as of this date. That is success rate of just 31.5 percent for America’s front line defense against airborne beta radiation like cesium-134 & 137, strontium-90 and plutonium-239. The failure of this taxpayer-funded program to maintain anything near a success rate approaching acceptable is extraordinary. Nevertheless, these radiation stations are invaluable, producing the best data in the United States.
Manmade beta emitters, the kind of radiation pouring out of the ongoing triple meltdowns at Fukushima Dai-ichi, Japan, are the most dangerous to the health and genetic integrity of flora and fauna in both sea and on land. That includes humans. That’s what these stations are monitoring for, stations that by in large have operating gamma radiation sensors which are far less effective in detecting the kind of radiation we’re looking for.
Again, several significant beta stations have gone offline while a couple of crucial ones are sputtering to life. There have been a number of startling developments since our last report, some of which have been also detected by the Nuclear Emergency Tracing Centre and reported by Peter Dailey who also runs Radiation Food Lab and Radiation Station Sunshine Coast Australia.
Since October 1, 2014 (below in archives), Montgomery AL hit a four-month high reaching 400 CPM October 17; Anchorage AK also hit a four month high reaching 100 CPM November 1 which is the first time it has reached that dubious milestone since EnviroReporter.com began tracking its beta radiation totals; Fairbanks AK hit a four-month high smashing through the previous ~190 CPM September 28, topping ~245 CPM October 31; Phoenix AZ blew through its previous ~210 CPM four-month high hitting over 650 CPM November 23 in a state where most voters probably would support funding these radiation stations that bring the harsh, and hot, reality home that the Grand Canyon State is getting hammered with beta rads; Tuscon AZ nearly topped 450 CPM October 31 which was over 25% higher than its last period high; Little Rock AR rocketed to 450 CPM October 27 exceeding past records; Fort Smith AR calmed down a bit to ‘just’ 300 CPM October 27; Anaheim CA‘s beta graph started working August 7 then went dead completely August 15; Fresno CA smashed through previous highs hitting ~970 CPM November 11; Bakersfield CA has gone off the charts – in excess of 1,000 CPM – half a dozen times in early to mid-November; Los Angeles CA‘s beta graph stopped in March but the gamma seemed quite jumpy in November so EnviroReporter.com relied on its HEPA filters dust sampling and detection and found that autumn dust in Los Angeles was eight times higher in beta radiation than late summer dust; Riverside CA‘s graph gave out September 15 after repeatedly slamming through the ‘Oh NO!’ threshold of 250 CPM and has stayed out; San Bernardino County CA hit a four month high October 18 pegging ~335 CPM; San Diego remains extremely active hitting ~580 CPM September 20 and then hit 650 CPM October 1 as this once ‘cool’ city has turned beta ‘hot’ though the last week has settled down a bit to around 150 CPM; Hartford CT is trending upward tying a four-month high September 28 of ~215 CPM which is over ten times its normal background but was about ~60 CPM yesterday; Washington DC was just ~35 CPM yesterday; still not one beta monitor out of five works in Florida; Augusta GA no longer has a working beta graph in a very active environment, unfortunately, giving out August 25 never to return, yet; Ft. Wayne IN has dropped a bit with a ~280 CPM high November 13 for this reporting period; Baton Rouge LA‘s four-month high was hit November 10-11 with ~290 CPM; Orono ME hit a whopping 55 CPM October 6 which is high for this usually down in the teens community; Baltimore MD‘s beta and gamma graphs are now ‘on’ and functioning properly which is great news and promptly soared to ~210 CPM October 1, went offline for two weeks and now is back registering just 55 CPM yesterday; Worcester MA blew through ~320 CPM September 28 and has spiked three times in November over 200 CPM; Grand Rapids MI got up to ~260 CPM November 5; St. Paul MN was blowing through 300-350 CPM regularly before its beta station died October 16 not to return so far; St. Louis tested ~235 CPM October 14; Lincoln NE hit a four-month high August 3 with ~360 CPM and then its graph died but came back October 23 with 350 CPM being exceeded November 23; Concord NH hit ~245 CPM October 7 then the graph literally flatlined until November 14 but at nicely lower readings around 130 CPM; Albuquerque NM also hit a four-month high October 19 with a sizzling ~540 CPM; Buffalo NY tested at ~210 CPM November 18 before the massive snowstorm dropped seven feet on the city; New York City NY is not functioning as it hasn’t for years but its gamma gross count is sort of jumping around like LA’s gamma is – just one difference, NYC’s gamma is much more active all through the summer into the fall; Syracuse NY showed ~240 CPM November 6; Charlotte NC topped 200 CPM November 13; Raleigh NC hit ~170 CPM July 24 and cut out and still hasn’t come back on, a real loss in the South but we do have Radiation Station Harrisburg North Carolina for occasional rain radiation tests including one November 17 which showed hot rain radiating at 9.9 times background; holy Toledo OH has calmed down somewhat and was 50 CPM today; Corvalis OR hit 375 CPM October 9 and over 200 yesterday before plunging to ~20 CPM today; Pittsburgh PA was ~165 CPM today; Puerto Rico‘s beta graph doesn’t work but the gamma remains low and steady; Amarillo TX hit 1,000 CPM October 20-21 then died November 1 which is truly a shame since it has been the most inexplicably active beta graph in the nation, certainly a dubious honor; Dallas TX goes Texas-big topping 400 CPM October 15, a four-month high; Ft. Worth nearly hit 250 CPM November 20; Salt Lake City UT‘s beta station is still down since a huge beta increase over 200 CPM in early May and remains offline in a state that prides itself on efficiency; and Madison WI hit a four-month high September 30 charting an astounding ~555 CPM and was ‘just’ 300 CPM last night.
Thanks to Nuclear Emergency Tracing Centre
http://www.netc.com/ for these charts.
San Leandro CA 243468 CPM 16th October 2014 chart
http://sccc.org.au/wp-content/uploads/2014/11/San-Leandro-CA-243468-CPM-16th-October-2014.jpg
Saint Charles IL detection 22th November 2014 chart
http://sccc.org.au/wp-content/uploads/2014/11/Another-Saint-Charles-Il-detection-22th-November-2014.jpg
Bakersfield Ca 1600 cpm 1700cpm a few days before the 12th and 1800
http://sccc.org.au/wp-content/uploads/2014/11/Bakersfield-Ca-1600-cpm-1700cpm-a-few-days-before-the-12th-and-1800.jpg
Reports from a contact who has been keeping a close eye on these locations.
San Leandro CA 243468 CPM 16th October 2014, (Average here 191 cpm) This is a huge detection!
Another Saint Charles Il, detection, 2729CPM – Tuesday, November 18, 2014, and 22th November 2014 twin peak at ~6,000 cpm (Average here 19 cpm)
Bakersfield Ca, ~1,600 cpm, ~1700cpm a few days before the 12th, and ~1,800 on the 12th November 2014, plus another ~1,000 cpm detection on around 21st November 2014 (Average here 277 cpm)
These detections are so large, it suggests these are releases from local NPP’s or other nuclear facilities nearby.
Sometimes I stumble upon a video or piece of information that I feel may be historically significant.
A Mike Wallace interview with Dr. Ralph Lapp, Nuclear Physicist
Relative vs Absolute
Mike Wallace interview 1957
http://www.c-span.org/video/?c4506958/mike-wallace-interview-ralph-lapp
Dr. Lapp coined the term “China Syndrome”.
More info:
http://en.wikipedia.org/wiki/Ralph_Lapp
His words stand strong, even today. 😉
Caloundra (Queensland Australia) 16th November 2014 –
There has been a general increase in background levels here over the last few days. It was 43% above pre-Fukushima average levels on the 16th. No rain, it was a clear fine day, so this was a free air increase. Most of the day increase occurred when the wind direction was NNE. Here that meant the wind was coming off the Pacific Ocean.
For the majority of the day the Radon monitor was below 1 pCi/l.
http://sccc.org.au/wp-content/uploads/2014/11/Caloundra-local-average-background-radiation-levels-November-2014.jpg
This is the first time since March 2014 that background levels have reached this monitoring stations first Alert Level.
http://sccc.org.au/what-does-each-step-in-the-alert-level-colour-code-mean
Background levels so far this November are still less volatile than November 2012.
http://sccc.org.au/wp-content/uploads/2012/11/Caloundra-local-average-background-radiation-levels-November-20121.jpg
and November 2013.
http://sccc.org.au/wp-content/uploads/2013/11/Caloundra-local-average-background-radiation-levels-November-2013.jpg
RADIATION STATION HARRISBURG NC 11/17/2014
Total overcast. Showers started around 1 a.m. Moderate to light off/on coming from s west to n east. Once again all tests unless otherwise stated are from my car windows/windshield… Note: On my YouTube I used a digital watch and forgot to setback 1 hour so exact time is 1 hr less.
1… 291.7 cpm @ 10:56 am
2…. 29.6 cpm background
3… 9.854 x background
@Schoenborn Wes: Could you send us some photos of the site and what you describe? And please identify yourself as we’ve never had the pleasure of meeting you since EnviroReporter.com‘s reporting on neighboring Rocketdyne began in 1998.
Alert:
Dayton Canyon developer breaking ground, please visit site. There are several new construction and dust mitigation signs newly erected from AQMD along fenceline near Valley Circle and Roscoe Blvds., West Hills area. There are numerous employee instruction signs from the developer inside near security trailer describing construction rules.
October 23, 2014
1:50 pm EXT Death Valley BG at 689′ elevation (in shade and not direct Sun where the temperature hit 128 degrees Fahrenheit): 75.2 CPM. This was in the northern main valley in Death Valley called Mesquite Flat. Spot checks revealed that background in Mesquite Flat was nearly double that of the southern main valley in Badwater Basin. Our speculation is that the northern valley was impacted more by fallout from the Nevada Test Site less than 100 miles due east.
October 19, 2014
11:05 pm INT BG Lone Pine CA at 3,748′ elevation: 62.7 CPM^^
Southern Hemisphere October 2014 UV, and Background Radiation Report.
Station location
http://sccc.org.au/monitoring/Australian-Map.jpg
This short animation of Northern, and Southern Hemisphere air circulation, shows why we can get detections so far south.
Summary
The good news is that the air borne contamination reaching this location, appears to have stabilized for the time being.
October’s 2014 monthly average background radiation level was the lowest October monthly average since pre-Fukushima, at 14% above the pre-Fukushima October average. 2012 was 19% above and 2013 was 25% above the pre-Fukushima average. 2012 had the most dynamic swings in background levels.
Over the last few months we have been getting a lot of low pressure systems develop between Australia and new Zealand, pumping cleaner Southern Ocean air up along our east coast. In previous years at this time of the year, the air flows here came mainly from the tropics.
Technical details:
(Note: The 4yr average referred to in the charts, is the 4yr pre-Fukushima average.)
Day average chart for October 2014 (14% above average)
http://sccc.org.au/wp-content/uploads/2014/10/Caloundra-local-average-background-radiation-levels-October-2014.jpg
2013 Day Average chart (25% above average)
http://sccc.org.au/wp-content/uploads/2013/10/Caloundra-local-average-background-radiation-levels-October-2013.jpg
2012 Day Average chart (19% above average)
http://sccc.org.au/wp-content/uploads/2012/11/Caloundra-local-average-background-radiation-levels-October-20121.jpg
2014 Month Average chart
http://sccc.org.au/wp-content/uploads/2014/02/Caloundra-monthly-average-background-radiation-levels-for-2014.jpg
October 2014 Rain Water Test Report
Summary:
Traces of Lead Pb-210 and Beryllium Be-7 were detected in the rain water. This is surprising since the rain fall was only 30mm in October.
The Be-7 peak should be at 477 Kev. The Be-7peak in this test chart with calibration is slightly to the left of the ideal at around 470 Kev. This suggests the presence of another unidentified isotope. At these trace levels their peaks are too close for this equipment to separate the peaks enough to identify the other isotope. A second test was done a couple days later. Whatever was present had decayed away, and the Be-7 peak was where it should be in the chart.
So far we have not been able to qualify what the possible isotope maybe.
Roof down pipe filter design for rainwater testing, http://sccc.org.au/down-pipe-filter-design
Test Chart
In this chart I have CPS on the Y axis to show activity, and have turned off Y log to show linear scaling.
http://sccc.org.au/wp-content/uploads/2014/11/Down-pipe-Caloundra-November-filter-test-021114-TV63-22c-84600-text-1024×846.jpg
Previous Rain water and soil tests can be found here.
http://sccc.org.au/pages/The-Food-Lab.html#Soil%20Testing%20Results
UV Report
Keep and eye on Northern and Southern Hemisphere UV levels in spring and summer. Here, we are already into extreme UV levels. During these events it is important to put in place protective UV Radiation measures.
http://sccc.org.au/wp-content/uploads/2014/11/Caloundra-UV-levels-4th-7th-November-2014.jpg
New Live Radon Monitoring System
Have recently set up an experimental live Radon monitoring system here.
This live Radon monitor has been set up to establish if Radon, or other Alpha emitting radioactive isotopes are significantly affecting local background radiation levels, at the Caloundra monitoring station location.
It is set up in a room in a wooden building on stumps, near the Pacific Ocean, so Radon levels should be low. Anything above 4 pCi/l for an extended period of time would be of concern.
Significant Radon increases have been detected when storms have passed over the area. Also, significant increases have been detected on clear fine days. Still assessing what it all means.
http://sccc.org.au/monitoring/sunshinecoast-monitoring-station.html
Technical Details of Live Radon monitor.
Caloundra Central 24 hour Radon Level Chart, (Live Chart)
http://liveradiationmonitoring.org/monitoringCAradon/PLOT_LOG.PNG
Information on Radon levels, and why it is of concern.
http://sccc.org.au/wp-content/uploads/2014/10/Radon_Info_ENG.pdf
Equipment used to set up the Caloundra live monitoring Radon station.
http://www.theremino.com/en/hardware/inputs/radioactivity-sensors/
Disclaimer: This is an amateur volunteer run service. Human error can provide incorrect information, and equipment malfunction can produce false readings. Do not rely on, or take action upon information presented here, without further research.
@Chase, I agree, there are more possibilities than just the sewer source for the radioactive Iodine-131.
@vital1
The iodine is coming from somewhere, that much is certain.
This should be a Top Priority Story, especially for local news.
Possibilities:
1. As most of us who have delved into the issues of Nuclear Power now know, the ‘dumping’ of radioactive contamination is just part of the overall ‘collateral’ damage of an industry built on deception and the denial of human fallibility.
Note: I saw a news report on the issue of dumped trash in Los Angeles the other day. Couches, garbage, you name it. Now imagine some ‘idiot’ being paid well to transport radioactive waste from a hospital, but instead, dumps it into the LA river or the ocean. The damage and suffering from such a thing would be horrendous.
2. To think that it may be terrorist related is beyond imagination too, but that’s probably coming at some point, if it hasn’t already. I am sure we would not be told by official agencies. The Nuclear Industry’s logic is that the ‘damage’ has been done so ‘say nothing’ order to avoid further panic. That will be one excuse.
3. Fukushima…? I don’t know.
IMO – There’s not been enough ongoing thorough testing to say with any certainty. The way I see rad readings from Bakersfield and Fresno fluctuate makes me wonder. 😯
I should also note that as an observer of the Fukushima webcam, I can tell you, without a doubt, that ongoing visible emissions have increased dramatically over the last 60 days and especially since the double typhoon strikes.
Iodine Showing Up In Water Near Ports Of LA, Long Beach – 30th October 2014
This raises lots of questions, if the source is from the local sewer systems.
Iodine is commonly used to diagnose and treat thyroid cancers, so are far more people now being treated for Thyroid cancer?
http://losangeles.cbslocal.com/2014/10/30/iodine-showing-up-in-water-near-ports-of-la-long-beach/
ENGLAND
27th October 2014 – Leaked Sellafield photos reveal ‘massive radioactive release’ threat
Extracts:
Dilapidated nuclear waste storage ponds abandoned 40 years ago containing hundreds of tonnes of fuel rods pose an immediate danger to public safety, photographs sent to The Ecologist reveal. The fuel and sludge in the ponds could spontaneously ignite if exposed to air, spreading intense radiation over a wide area.
The photographs show cracked concrete tanks holding water contaminated with high levels of radiation, seagulls bathing on the water, broken equipment, a dangerous mess of discarded items on elevated walkways, and weeds growing around the tanks.
The ponds are now undergoing decommissioning in order to restore them to safe condition. But the process is fraught with danger – and nuclear expert John Large warns that massive and uncontrolled radioactive releases to the environment could occur.
http://www.theecologist.org/News/news_analysis/2611216/leaked_sellafield_photos_reveal_massive_radioactive_release_threat.html
Simi Valley, CA – 10 MIN AVG raining
6:40a INT 46.2 CPM
6:50a EXT 52.7 CPM – Inspector placed within a plastic bag
7:00a INT 65.3 CPM – Paper towel rain sample
NUCLEAR ACCIDENT ILLINOIS
Uranium hexafluoride release tonight at Honeywell Works, Metropolis, IL. – 26th October 2014
Extracts:
There was a confirmed uranium hexafluoride release at Honeywell Works in Metropolis, IL at 8pm tonight. Sirens have sounded and Honeywell guards have told people to shelter in place, close windows, and turn off A/C.
It was noted to be moving west from Metropolis. Wind maps indicate that the wind is from the southeast, so the plume would be moving northwest. Cape Girardeau MO and St Louis MO, or points in between, would seem to be where it is headed. And it won’t stop there.
http://optimalprediction.com/wp/uranium-hexafluoride-release-tonight-at-honeywell-works-metropolis-il/
This was just posted on Radchicks Facebook page an hour ago!
UPDATE/NUCLEAR ACCIDENT ILLINOIS: Found on #Honeywell Union Worker Lockout page, posted by Scott Posey: “I assume Honeywell let all the replacement workers know the company will pay for all their windshields that need to be replaced now as well as detailing all of their cars and trucks.”
**Anyone who lives in the area that had cars parked outside last night needs to check the windshields and the paint for pitting. If there is damage, even if it is very mild, DO NOT TOUCH THE CAR. Document with video and hi-resolution pics, email me asap @ christinax4@yahoo.com
“When we called the plant to ask why the Honeywell sirens were going off the guards said to shelter in place, turn off air, & close windows.”
https://www.facebook.com/pages/RadChick-Radiation-Research-Mitigation/260610960640885
Simi Valley, CA – 10 MIN AVG partly cloudy sky
6:50a INT 52.2 CPM
7:00a EXT 56.0 CPM
Britain’s nuclear test veterans ARE the victims of a genetic curse, new research reveals – 18th October 2014
Extracts:
Research – first reported by the Sunday Mirror in 2007 – which shows that their offspring have 10 times the normal rate of birth defects has finally been accepted by the scientific community.
The study proves:
Wives have THREE times the rate of miscarriage
Children are FIVE times more likely to die as infants
Babies are THREE times more likely to be stillborn
Veterans’ grandchildren EIGHT times more likely to have birth defects
Grandchildren of veterans TWICE as likely to get childhood cancer
And the most shocking finding of all is that the problems are likely to last at least 500 years, or 20 generations.
http://www.mirror.co.uk/news/uk-news/britains-nuclear-test-veterans-victims-4460976
@Chase et al: Bravo on your spirited debate over at that website with the ‘let’s build more nuke plants’ article by Joe Vitti. A little digging found that Vitti was a manager at Atomics International in Canoga Park way back in the day. AI brought us the most polluting meltdown in the history of the U.S. in 1959 just 30 miles northwest of downtown Los Angeles when the Sodium Reactor Experiment melted down with about a third of its rods melted. One of Vitti’s 95 Facebook friends is Chris Rowe, aka the Meltdown Denier.
That should give you a pretty good idea about this article and the nasty commenters who have tried to insult you, Chase, which is about all they can do as you have so eloquently addressed the real issues of nuclear power. I don’t marvel at nuclear proponents’ myriad false claims and denial of the obvious (revealed so terribly with Fukushima’s worsening triple meltdowns; I marvel at people like you, Chase, and the raddies commenting here who are willing to debate these issues with people like this.
Here’s some of what we’re up against.
This article appeared yesterday.
CityWatch is an online LA Newspaper.
That’s all I know about it.
Headline:
LA Needs to Think Nuclear … and Here’s Why
(Los Angeles, CA)
14 Oct 2014
Written by Joe Vitti
(credit user stock for this link)
http://www.citywatchla.com/lead-stories-hidden/7702-la-needs-to-think-nuclear-and-here-s-why
One commenter claimed he has “no patience for agenda-driven journalists” like Michael Collins of EnviroReporter.com.
Ha…! I gave ’em my 2 cents.
One of the worst written, lack of facts articles, I’ve ever read. It might be funny, if it wasn’t so sad. 🙁
11th October 2014 – Fukushima. Busby Bites Back
Comment:
Revelations on the use of an enriched uranium weapon. This weaponry is contaminating large areas, and causing large numbers of birth defects.
https://www.youtube.com/watch?v=h3Z41IC7qH4
Simi Valley, CA – 10 MIN AVG clear sky
6:30a INT 49.2 CPM
6:40a EXT 52.1 CPM
Simi Valley, CA – 10 MIN AVG clear sky
6:10a INT 46.1 CPM
6:20a EXT 51.7 CPM
Southern Hemisphere September 2014 UV and Background Radiation Report.
Station location
http://sccc.org.au/monitoring/Australian-Map.jpg
This short animation of Northern, and Southern Hemisphere air circulation, shows why we can get detections so far south.
Summary
September’s 2014 monthly average background radiation level was the lowest September monthly average since pre-Fukushima, at 6% above the pre-Fukushima September average. It was 7% below 2012 and 9% below 2013 monthly averages. This September saw a longer period of Southern Ocean air flows than previous years. Over the last few months, a number of low pressure systems have been siting between Australia and new Zealand, pumping cleaner Southern Ocean air up along our east coast.
Besides background levels of Ionizing radiation, it is now also important to closely watch UV levels, in both the Northern and Southern Hemisphere in spring and summer. Here, this week in early spring, we are already into extreme UV levels. During these events it is important to put in place protective UV Radiation measures.
http://sccc.org.au/wp-content/uploads/2014/10/Extreme-UV-October-2014.jpg
Technical details:
(Note: The 4yr average referred to in the charts, is the 4yr pre-Fukushima average.)
September 2014 was 6% above the 4 year pre-Fukushima average.
24 hour day average chart for September 2014
http://sccc.org.au/wp-content/uploads/2014/09/Caloundra-local-average-background-radiation-levels-September-2014.jpg
2014 Month Average chart
http://sccc.org.au/wp-content/uploads/2014/02/Caloundra-monthly-average-background-radiation-levels-for-2014.jpg
2013 Month Average chart
http://sccc.org.au/wp-content/uploads/2013/02/Caloundra-monthly-average-background-radiation-levels-for-2013.jpg
2012 Month Average chart
http://sccc.org.au/wp-content/uploads/2012/09/Caloundra-monthly-average-background-radiation-levels-for-2012.jpg
September 2014 Rain Water Test Report
Summary:
Significant traces of Lead Pb-210 and Beryllium Be-7 were detected in the rain water. Again this is surprising, considering the local background levels and rain fall were low for September. September 2014 had 63.2 mm of rain. There were a number of significant solar storms and CMEs which hit the Earth’s upper atmosphere in September.
Beryllium Be-7 can be made by spallation in the upper atmosphere, during solar events, and takes around two weeks to reach the surface. Lead Pb-210 is a decay daughter of Radon Rn-222. My view is that because of the upper atmosphere damage, and a weaker magnetosphere, smaller solar events are now having a greater impact on the Earth’s upper atmosphere. This is a possible explanation for the increased Beryllium-7 detections in rain water washouts here.
Roof down pipe filter design for rainwater testing, http://sccc.org.au/down-pipe-filter-design
Test Chart
In this chart I have CPS on the Y axis to show activity, and have turned off Y log to show linear scaling.
http://sccc.org.au/wp-content/uploads/2014/10/Down-pipe-Caloundra-September-filter-test-021014-TV63-21c-85318-B-text.jpg
Previous Rain water and soil tests can be found here.
Disclaimer: This is an amateur volunteer run service. Human error can provide incorrect information, and equipment malfunction can produce false readings. Do not rely on, or take action upon information presented here, without further research.
Simi Valley, CA – 10 MIN AVG clear sky
6:10a INT 45.1 CPM
6:20a EXT 53.0 CPM
Exterior 17.5% above interior
Simi Valley, CA – 10 MIN AVG clear sky
6:10a INT 46.9 CPM
6:20a EXT 51.8 CPM
Simi Valley, CA – 10 MIN AVG clear sky
6:10a INT 47.5 CPM
6:20a EXT 51.4 CPM
Re: The Tokyo Rad Test Videos
Those are some excellent videos from Tokyo. I am certainly not going to book a tour there that’s for certain.
I really don’t think the Nuclear proponents can hold the ‘no concern’ lie together long enough for the Olympics, but who knows.
I also wouldn’t have believed that Fukushima’s TRIPLE MELTDOWNS could be virtually ignored for over 3 1/2 years either. (shows what I know)
Re: The plant mutations photos from Japan.
It’s very sad. The insidious nature of radioactive contamination and the numerous ways in which it will spread and accumulate are incalculable. 😥
Simi Valley, CA – 10 MIN AVG clear sky
6:10a INT 47.6 CPM
6:20a EXT 51.6 CPM
Simi Valley, CA – 10 MIN AVG clear sky
8:20a EXT 49.9 CPM
8:30a INT 46.4 CPM
@All: In almost any disaster, things get better after a while. Fukushima’s meltdowns, like the spreading Ebola crisis, is not one of them. For instance, when we reported Mutated California Sunflowers July 2012, we knew that radiation-induced mutations would get worse. Far worse. Now we’ve got even more evidence of this damage that cannot be undone. You don’t need to be able to read Japanese to understand these horrifying mutation photos of flora and fauna: http://onodekita.sblo.jp/article/57510646.html
Simi Valley, CA – 10 MIN AVG clear sky
7:10a INT 44.2 CPM
7:20a EXT 51.4 CPM
[Exterior 16.3% above Interior]
Simi Valley, CA – 10 MIN AVG clear sky
6:10a INT 47.3 CPM
6:20a EXT 54.5 CPM
Simi Valley, CA – 10 MIN AVG clear sky
6:10a INT 47.3 CPM
6:20a EXT 53.1 CPM
@Michael Yes, he is a brave man. He actions should be praised. He is trying to inform people so they can take action, to limit the exposure of their families to this dangerous contamination.
He talks about a black substance in his videos. In March 2013 I was sent a resin encapsulated sample of this black substance like material for testing. It had reportedly come from somewhere in the Minamisoma area Japan. A contact in Japan sent it to a friend. Here is my test chart of it.
http://sccc.org.au/wp-content/uploads/2013/04/Minamisoma-Cesium-290313-TV45-23c-25040-MB-1024×574.jpg
This comment was posted on a forum discussing this test, because we didn’t know the weigh of the sample.
“I’m an expert on weighing objects (sell scales, use different ones daily, some precise to .01g). Fungus in that form does not appear to hold too much water weight and would likely weigh less than a gram given the scale. If it is thin and flakey type fungus, it may be under .25-.5g. Is it thick like a mushroom cap or more like lichen? I’ve only observed extremely thin fungi growing on concrete, and I would err on the very low side. My best guess is .3g.”
My reply
That means the black fungus sample from Japan is very, very, hot.
Test results 117 Bg Cs-137 and 58 Bq Cs-134
117 + 58 = 175 Bq x (1000 grams/0.3 grams) = 583,333 Bq/Kg of Cesium
Even if it was 10 times greater in weight 3 grams, it would still be 58,333 Bq/Kg of Cesium.
This radioactive black material has been reported collecting in hot spots on rocks, roads, plus around gutters and drains in central Japan. Other samples of this substance tested by other researchers were a lot more radioactive than the sample I tested. Other dangerous radioactive isotopes were detected in those samples.
It would be dangerous breathing in or ingesting this material as it blows around in the environment.
The person who supplied this sample to me, went to a lot of trouble and expense, to make this sample available to researches in Australia. I would like to thank him for that.
Simi Valley, CA – 10 MIN AVG clear sky
6:10a INT 47.0 CPM
6:20a EXT 49.0 CPM
@vital1: Those are outstanding videos made by a brave man who knows what he’s doing. I hope raddies pay attention to this gent’s videos. Mind blowing. Denise Anne and I are crossing off Tokyo on our frack-it list.
@All: VERY active, actually radioactive period since I last reported.
NATIONWIDE RADIATION REPORT
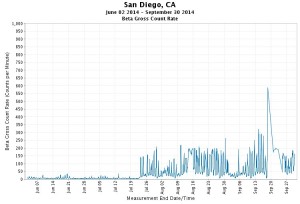
2014/10/01 at 1:00 am
40 out of 124 beta monitors are functional as of this date out of the 124 areas covered, the same number as last month but with a changing line-up: station stoppage combined with station start-up. Several significant beta stations have gone offline while a couple of crucial ones are sputtering to life. Many stations are measuring very high beta readings with four-month highs in what turned out to be a very “hot” period.
Since September 1, 2014 (below in archives), Montgomery AL topped 250 CPM twice before calming down in the last week; Anchorage AK‘s beta graph is getting more active going over 50 CPM in the last week but the last two days have eased off; Fairbanks AK hit a four-month high with ~190 CPM September 28, part of a continuing uptick in beta activity at the station; Phoenix AZ tied a three-month high ~August 25 with ~210 CPM hitting the same peak September 26 right during the rains – perhaps mist impacted these very high numbers; Tuscon AZ nearly hit 345 CPM Sept. 27 remaining quite active; Little Rock AR had two strong pulses, one hitting ~350 CPM Sept. 19 with the whole period hovering around 200 CPM in a place used to 20 CPM – an increase of ten times; Fort Smith AR suddenly went even nuttier ~August 22 after having been calmer in the second week of Sept. 30 hitting 450 CPM, the highest we have recorded in a long long time in an area used to readings in the teens; Anaheim CA‘s beta graph started working August 7 then went dead completely August 15 – your tax dollars at work because a private company is supposed to keep RadNet running and clearly isn’t; Fresno CA charted ~270 CPM Sept. 12 in a town with very active beta; Bakersfield CA went berserk right after we put the last report to bed and soared to ~820 CPM and then kept jumping around but tonight is about 90 CPM; Los Angeles CA‘s beta graph stopped in March but the gamma seemed quite jumpy in September; Riverside CA‘s graph gave out September 15 after repeatedly slamming through the ‘Oh NO!’ threshold of 250 CPM; San Bernardino County CA smashed through to a four-month high August 30 and went over 250 CPM three times in this latest period; San Diego remains extremely active hitting ~580 CPM September 20 which is over FIFTY times background for the city – look at the graph and see yourself: the background is on the left hand side of the graph and the radically-higher readings on the right; Hartford CT is trending upward tying a four-month high September 28 of ~215 CPM which is over ten times its normal background; Washington DC was not too bad with it hitting ~140 CPM yesterday; not one beta monitor out of five works in Florida even after us reporting it for months – Floridians are breathing beta blind; Augusta GA no longer has a working beta graph in a very active environment, unfortunately, giving out August 25 never to return, yet; Ft. Wayne IN continues a radical trend upward hitting a one-month high Sept. 24 of ~365 CPM which is over ten times background; Baton Rouge LA‘s four-month high was hit Sept. 14 with ~225 CPM; Orono ME looks nice and cool but is marginally more active with ~30 CPM August 30 but hit 50 CPM yesterday; Baltimore MD‘s beta and gamma graphs are now ‘on’ and functioning properly which is great news and promptly soared to ~210 CPM yesterday; Worcester MA blew through ~320 CPM September 28; Grand Rapids MI hit ~295 CPM September 30; St. Paul MN went up to ~360 CPM three times in the last few days but dropped off today; St. Louis is really moving up hitting ~335 CPM September 30; Lincoln NE hit a four-month high August 3 with ~360 CPM and then its graph died and hasn’t come back, a real loss since this station is in the middle of the country and the folks there are getting significant readings of beta radiation which is oft-times man-made; Concord NH hit ~275 CPM Sept. 18, a four-month high; Albuquerque NM also hit a four-month high Sept. 19 with a sizzling ~345 CPM; Buffalo NY is increasing active hitting ~305 CPM Sept. 29 – a four-month high – when its normal background is about 20-25 CPM; New York City NY is not functioning as it hasn’t for years but its gamma gross count is sort of jumping around like LA’s gamma is – just one difference, NYC’s gamma is much more active; Syracuse NY‘s beta graph hit a new record for the year – ~240 CPM today; Charlotte NC hit a four-month high Sept. 18 with ~215 CPM; Raleigh NC hit ~170 CPM July 24 and cut out and still hasn’t come back on, a real loss in the South but we do have Radiation Station Harrisburg North Carolina for occasional rain radiation tests; holy Toledo OH is dropping and was ‘just’ ~140 CPM today; Corvalis OR hit a four-month high Sept. 15 smashing past 450 CPM in a place that has a background of under 20 CPM; Pittsburgh PA is going up in active ionizing and has remained active hitting 300 CPM yesterday; Puerto Rico‘s beta graph doesn’t work but the gamma remains low and steady; Amarillo TX went literally off the chart August 3 blasting through 1,000 CPM and is the most active beta station in the country that functions topping 890 CPM September 25/26; Dallas TX was exactly 400 CPM Sept. 21, a four-month high CPM; Ft. Worth, is trending active hitting 350 CPM, the highest in memory; Salt Lake City UT‘s beta station is still down since a huge beta increase over 200 CPM in early May and it’s gamma bears watching as it has pulses of spikes; and Madison WI hit a four-month high September 30 charting an astounding ~555 CPM.
Posted by Uranium_Mountain on enenews.
This guy has done a great job exposing the radiation dangers in Tokyo and has taken great risks to his freedom to do so. Please watch these short video’s recently posted. I would hate to even visit Tokyo now much less live there.
Published on Sep 14, 2014 Horiba Radi PA1000 0.27uSv/h https://www.youtube.com/watch?v=bdc7Qbj69WI
Published on Sep 14, 2014 Downspout apprx 930cpm, 4.18uSv/h Kanamachi Katsushika Ward in Tokyo https://www.youtube.com/watch?v=LdELYIu4zw0
Published on Sep 14, 2014 There was a black substance Horiba Radi PA1000 0.9uSv/h Takasago Junior high school Katsushika Ward in Tokyo Inspector EXP+ 1.6uSv/h apprx 520cpm https://www.youtube.com/watch?v=Miljt_Mf36Q
Published on Sep 14, 2014 Micro hot spot 500cpm, 0.95uSv/h on the ground directly near Kanamachi station Katsushika Ward Tokyo https://www.youtube.com/watch?v=JEkIEhf5nHo
Simi Valley, CA – 10 MIN AVG clear sky
6:10a INT 50.3 CPM
6:20a EXT 50.8 CPM
Simi Valley, CA – 10 MIN AVG clear sky
6:10a INT 45.6 CPM
6:20a EXT 52.3 CPM
Simi Valley, CA – 10 MIN AVG clear sky
6:30a INT 44.5 CPM
6:40a EXT 52.2 CPM
[Exterior 17.3% above Interior]
Simi Valley, CA – 10 MIN AVG clear sky
6:10a INT 47.9 CPM
6:20a EXT 54.8 CPM
Simi Valley, CA – 10 MIN AVG clear sky
6:10a INT 50.3 CPM
6:20a EXT 51.6 CPM
26 times much radiation level detected from Japanese used car “Mitsubishi Pajero” in Russian customs. Report Fukushima Diary the 21st September 2014
http://fukushima-diary.com/2014/09/26-times-much-radiation-level-detected-japanese-used-car-mitsubishi-pajero-russian-customs/
Simi Valley, CA – 10 MIN AVG clear sky
6:10a INT 46.7 CPM
6:20a EXT 50.1 CPM
Simi Valley, CA – 10 MIN AVG clear sky
6:10a INT 48.6 CPM
6:20a EXT 50.7 CPM
Simi Valley, CA – 10 MIN AVG clear sky
6:10a INT 46.4 CPM
6:20a EXT 50.7 CPM
Simi Valley, CA – 10 MIN AVG overcast sky
8:05a INT 47.5 CPM
8:15a EXT 47.3 CPM
Simi Valley, CA – 10 MIN AVG clear sky
6:30a INT 46.5 CPM
6:40a EXT 51.1 CPM
Simi Valley, CA – 10 MIN AVG partly overcast sky
6:10a INT 48.1 CPM
6:20a EXT 50.7 CPM
Simi Valley, CA – 10 MIN AVG clear sky
6:10a INT 43.4 CPM
6:20a EXT 52.9 CPM
Exterior 21% above interior
Beautiful Skies with Devastating Repercussions, 11th September 2014
Extract:
Solar Storms: Sometimes the most beautiful natural phenomena can have devastating consequences. When the sun ejects hot charged particles into space, the Northern Lights are created here on Earth. Occasionally the sun erupts with huge quantities of particles (Coronal Mass Ejection) that can damage the earth’s electric systems. Renowned author Mat Stein and Arnie Gundersen discuss the dangers of a large coronal mass ejection on the electrical grid and on nuclear plants worldwide.
http://www.fairewinds.org/solarstorms-mat-stein/
Simi Valley, CA – 10 MIN AVG clear sky
6:45a INT 46.7 CPM
6:55a EXT 50.9 CPM
A little good news for once. Thanks to Senator Harry Reid, who is very parsimonious in allowing matters to come to the floor of the Senate for a vote, today the U.S. has 2 new Commissioners on the Nuclear Regulatory Commission, Jeffrey M. Baran and Stephen G. Burns. They are identified as Democrats, giving the forces for “better” a 3-2 voting majority on the Commission.
Even though “It may not be within the NRC’s purview” now is the time to start bombarding the new Commissioners with pleas to pay attention to the Fukushima related radiation statistics which have appeared on this website.
Simi Valley, CA – 10 MIN AVG clear sky
6:10a INT 43.7 CPM
6:20a EXT 52.9 CPM
Exterior 21% above interior
Simi Valley, CA – 10 MIN AVG clear sky
6:10a INT 51.1 CPM
6:20a EXT 54.4 CPM
Simi Valley, CA – 10 MIN AVG clear sky
8:20a EXT 51.3 CPM
8:30a INT 47.1 CPM
Simi Valley, CA – 10 MIN AVG clear sky
7:40a EXT 52.2 CPM
7:50a INT 48.1 CPM
Simi Valley, CA – 10 MIN AVG clear sky
8:30a EXT 53.2 CPM
8:40a INT 47.1 CPM
If Fukushima’s Triple Meltdowns have, so far, been equivalent to ‘thousands’ of nuclear bombs (estimates), then that means the amount of radioactive contamination is increasing on the average of ‘at least’ 1 NUCLEAR BOMB PER DAY.
It’s been 1280 days since -> 2011/03/11
http://www.wolframalpha.com/input/?i=2011%2F03%2F11
One does not need to be a math expert to figure this one out.
It’s ongoing. It’s the Nuclear Industry’s worst nightmare come true. (times three!)
A nightmare for all of us. 😥
Simi Valley, CA – 10 MIN AVG clear sky
6:25a EXT 54.4 CPM
6:35a INT 47.2 CPM
[Exterior 15.3% above Interior]
The two documents provided here present more evidence to support my view that the Fukushima Nuclear Disaster has, and is continuing to cause, upper atmosphere and ozone damage.
This damage to the atmosphere’s electric conductivity, ion current, and the Earth’s magnetic field is dramatically changing the world’s climate.
Climate threat from nuclear bombs – 12th December 2006
Extract:
“In addition, the ozone layer, which protects the surface of the Earth from harmful ultraviolet radiation, would be depleted by 40% over many inhabited areas and up to 70% at the poles.”
Article:
http://www.theguardian.com/environment/2006/dec/12/nuclearindustry.climatechange
Comment:
OZONE
Fukushima is releasing and has released, large amounts of atmospheric radiation, by some estimates equal to thousands of nuclear bombs. This is seriously damaging the ozone layer.
Fukushima is not generating as much soot as their simulation.
KRYPTON-85
There are ~1,000 Nuclear reactors around the world. This includes nuclear power plants, research and military reactors. All these reactors release krypton-85 as part of there normal operations. The the Fukushima nuclear disaster released enormous amounts of krypton-85.
NPP Krypton-85 releases change the atmospheric electric conductivity, ion current, and the Earth’s magnetic field!
WORLD METEOROLOGICAL ORGANIZATION GLOBAL ATMOSPHERE WATCH
Extract: (This extract is from the bottom of page numbered 56 in the document.)
Importance Krypton-85 (85 Kr) is a radioactive noble gas which decays with a half-life of 10.76 years, emitting mainly β -particles of mean energy 251 keV. The main sources of Krypton-85 are the nuclear fuel reprocessing plants and various nuclear reactors.
The nuclear weapons tests in 1945-1963 contributed about 5% of the total Krypton-85 in the atmosphere, whereas its natural sources can be neglected. Radioactive decay is practically the only mechanism of Krypton-85 removal from the atmosphere.
The present background concentrations of Krypton-85 in the atmosphere are about 1 Bq/m3 and are doubling every 20 years. At this level, Krypton-85 is not dangerous for human beings, but the air ionization caused by Krypton-85 decay will affect atmospheric electric properties.
If Krypton-85 continues to increase, changes in such atmospheric processes and properties as atmospheric electric conductivity, ion current, the Earth’s magnetic field, formation of cloud condensation nuclei and 57 aerosols, and frequency of lightning may result and thus disturb the Earth’s heat balance and precipitation patterns.
These Krypton-85 induced consequences call for Krypton-85 monitoring.
http://www.empa.ch/plugin/template/empa/*/7530
Read my previous post here, on the subject.
Simi Valley, CA – 10 MIN AVG clear sky
6:45a EXT 50.0 CPM
6:55a INT 49.8 CPM
Simi Valley, CA – 10 MIN AVG clear sky
6:20a EXT 50.9 CPM
6:30a INT 43.1 CPM
[Editor: Exterior 18.1% above Interior]
@Another Simi Mom: Excellent analysis. Thank you.
Even though the Los Angeles beta graph still doesn’t work, we do and have detected an uptick in Southern California dust beta readings:
September 8, 2014
5:55 pm INT HEPA DUST from two HEPA filters, one Ionizer/HEPA filter and an exhaust fan’s blade dust buildup: 59.9 CPM^^ which is 43.6% HIGHER than background over a 35 day period. The last 17-day period was less than 14% above background August 4.
5:40 pm INT BG: 41.7 CPM^^
I like facts. They form the basis of my political opinions, and form the basis for my black box intuition which often lets me read between the lines and figure things out.
Today 9/8/14, I’ve run across at least 2 news stories saying that both AP and a private environmental group have a copy of a new 42 page report on the Diablo Canyon nuclear complex which says the complex should be shut down because of newly found geologic and seismographic data. The report was supposedly written by Dr. Michael Peck, who was for 5 years the Nuclear Regulatory Commission’s principal inspector at Diablo Canyon. The report supposedly says that the NRC is not “applying” the safety rules it set for the plant’s operation. AP says the 42 page report is not available for the public to read. I have a problem with that secrecy for three reasons:
First, no reporter, no matter how talented, can summarize 42 pages of information into a few column inches and still convey to interested parties the full import of what the report-writer has disclosed in terms of facts and opinion.
Second, the U.S. is full of smart people experienced in a variety of professional disciplines who could read the report and lend their own expertise, through commentary, to enhance public knowledge and understanding about the report’s content.
Third, the hiding of all of the detail in a detailed report written by a professional frightens his/her peers into silence. Any professional in any public health and safety discipline is going to say “Why should I allow my name to be exposed, and my family’s safety and livelihood put at risk, if my message is going to be stifled?”
One of the stories I read today concerning Dr. Peck’s report said that the owner of Diablo Canyon, PG&E, is having financial problems. I can’t comment on whether that is true, because such a conclusion takes a whole lot of reading which I have not had time to do. PG&E was in a complicated Chapter 11 bankruptcy in the early 2000’s but supposedly emerged from bankruptcy as a financially viable company, thanks in large part to the California Public Utilities Commission (CPUC) approving a rate-hike for PG&E which would produce needed increased cash flow.
What I do know is that since that bankruptcy, PG&E’s high pressure natural gas line in San Bruno exploded, killing several people (ironically including a woman CPUC employee and her daughter, whose burned bodies were found in front of their home, in positions showing they were running away from the fire before the gas-fueled blow torch we all saw on TV fried them alive.
The CPUC was conducting a detailed investigation of that explosion, and PG&E’s failure to replace very old natural gas main pipelines even though CPUC had approved other rate increases for PG&E to allow them to replace the old pipelines…something that didn’t do before the San Bruno explosion. There was a lawyer on the CPUC staff, who had been with that agency for more than 20 years, who was heading up that investigation. However, PG&E apparently vehemently complained to Gov. Jerry Brown’s political minions about what the CPUC investigation was uncovering. As a result, CPUC got a new “safety director” and a new “head in-house lawyer”. Less than a year ago, all of the CPUC’s in-house lawyers and in-house administrative law judges were warned (aka threatened) by these two politically appointed clowns to lay-off PG&E. The working atmosphere was so frightening, lawyers from CPUC’s in-house legal department told many, many lawyers practicing in the regulated utility field that they had been threatened. The 20+ year CPUC lawyer who was running the investigation of the San Bruno explosion was specifically told to “stop it” and he refused. Once he refused, he was fired and his firing was reported in most of the major Northern California newspapers. The man’s firing shows all of us the “regulatory climate” at CPUC, inaction with respect to the San Bruno explosion and a reign of terror being conducted on PG&E’s behalf. Mind you, the CPUC has little to say about the actual nuclear safety issues at Diablo Canyon. However, PG&E’s lobbying muscle there speaks volumes to me, because that’s the profession I understand.
Nuclear safety issues at Diablo Canyon are the province of the U.S. Nuclear Regulatory Commission (NRC). You can bet your last dollar that PG&E’s lobbyists are camped out on the door steps of the NRC staff and commissioners on a daily basis. In 2009 President Obama appointed Greg Jaczko as Chairman of the NRC. The choice was blessed by Sen. Harry Reid, who is profoundly opposed to the nuclear industry using the NRC and its Commissioners and staff as puppets and his state as a nuclear dumping ground. The pro-nuclear industry Republicans on the NRC immediately began creating chaos at all levels of the NRC, and the nuclear industry ultimately found some cooperative women NRS staffers to make spurious sex-discrimination claims against Mr. Jaczko as a means of forcing him out. Republican troll Michelle Malkin crowed about Mr. Jaczko’s departure in a syndicated column which she entitled “Jaczko the Jerk” and which is still found on the internet. The NRC staff and the Commission itself has been in chaos ever since, dancing like marionettes whose strings are pulled by the nuclear industry.
As a result, given the fact that the full content this new 42 page report on the geology at Diablo Canyon is being hidden from the public is no surprise to me. If PG&E is exercising such profound muscle at the CPUC there’s no reason to expect that their lobbyists at the NRC are no less effective.
Simi Valley, CA – 10 MIN AVG cloudy sky
6:50a EXT 46.0 CPM
7:00a INT 49.0 CPM
Extreme UV Levels in Summer
It is early spring here, and UV levels are already predicted to be at very high levels by mid week.
http://sccc.org.au/wp-content/uploads/2014/09/weeks-uv-levels.jpg
Summary:
Extreme UV levels are now being detected in both Northern and Southern Hemisphere, spring and summer. I am suggesting that the increase in Northern hemisphere UV has been caused by atmosphere damage from the large amount of ionizing radiation released into the Northern Hemisphere upper atmosphere, by the Fukushima Nuclear Disaster.
This will potentially lead to significant increases in skin cancer rates and eye cataracts, in the both the human and animal populations. In my opinion, it is important to now monitor both local ionizing and daily UV radiation levels. During UV events, if possible, stay out of the Sun, or wear good UV rated wrap around sunglasses and protective clothing, plus research UV protection methods.
If you run a public available live radiation monitoring station, also consider providing links to local UV monitoring on your page. Do a search, and you will find sites that provide local, or regional daily UV level forecasts.
Technical details:
This article appeared in October 2011.
NASA Pinpoints Causes of 2011 Arctic Ozone Hole
http://www.nasa.gov/topics/earth/features/2011-ozone-hole.html
Extract:
“You can safely say that 2011 was very atypical: In over 30 years of satellite records, we hadn’t seen any time where it was this cold for this long,” said Susan E. Strahan, an atmospheric scientist at NASA Goddard Space Flight Center in Greenbelt, Md., and main author of the new paper, which was recently published in the Journal of Geophysical Research-Atmospheres.”
Comment: (My opinion)
“You can safely say that 2011 was very atypical”
I observed in 2011, that small solar storm events where producing Northern Light displays, way down into Southern states in the USA. I have been a sun watcher for many years, and know it was very unusual for such small solar events, to produce such Northern Light displays, so far south. Our atmosphere is an electrical system, and these unusual Northern lights displays indicated that the electrical dynamics of the upper atmosphere had been changed by the large radioactive releases from the Fukushima Nuclear Disaster.
Chlorofluorocarbons (CFC), the main cause of atmospheric Ozone destruction had been reduced significantly. Because of a worldwide ban on CFC’s, by 2010 the Southern Ozone hole was showing signs of repair. This 1994 research paper indicates a cause, upper atmosphere damage from the large Fukushima krypton-85 releases.
Article:
Climate risks by radioactive krypton-85 from nuclear fission Atmospheric-electrical and air-chemical effects of ionizing radiation in the atmosphere.
Extract:
“The study shows that krypton-85 from nuclear fission enhances air ionization and, thus, interferes with the atmospheric-electrical system and the water balance of the earth atmosphere.”
http://www.opengrey.eu/item/display/10068/255704
Krypton-85 and other ionizing isotope contamination in the upper atmosphere has changed the upper atmosphere dynamics, and is creating extreme seasonal Northern Hemisphere UV and weather events.
UV levels here can now frequently reach high to extreme levels in both the Northern and Southern Hemispheres, during spring and summer. During these events it is suggested, if possible, to stay out of the sun, or wear good UV rated sunglasses and protective clothing.
These extreme UV levels would also be damaging plants and animals, plus it also can potentially create virus and plant mutations. There is independent testing now, indicating that more damaging UVC is also now reaching the Earth’s surface. (The studies linked below don’t take into account UVC atmospheric penetration.)
The large number of Northern hemisphere multiple species die offs that are being reported, are possibly occurring because of a combination of ecosystem bio-accumulation of radioactive isotope contamination, chemical toxins, and from increase UV levels.
Out side of the radioactive contamination hot spots in Japan, increased oceanic and terrestrial UV radiation levels proportionally, may be causing more ecosystem damage than radioactive isotopes surface fallout. The resultant increased levels of UVB and UVC that are now reaching the Earth’s surface are directly damaging individual organisms, and significantly impacting the oceanic and terrestrial food supply.
Excessive UV effects on ecosystems
http://www.grida.no/publications/vg/ozone/page/1389.aspx
Extract:
“Aquatic wildlife is particularly vulnerable Phytoplankton are at the start of the aquatic food chain, which account for 30 per cent of the world’s intake of animal protein. Phytoplankton productivity is restricted to the upper layer of the water where sufficient light is available. However, even at current levels, solar UV-B radiation limits reproduction and growth. A small increase in UV-B exposure could significantly reduce the size of plankton populations, which affects the environment in two ways. With less organic matter in the upper layers of the water, UV radiation can penetrate deeper into the water and affect more complex plants and animals living there. Solar UV radiation directly damages fish, shrimp, crab, amphibians and other animals during their early development. Pollution of the water by toxic substances may heighten the adverse effects of UV radiation, working its way up the food chain. Furthermore less plankton means less food for the animals that prey on them and a reduction in fish stocks, already depleted by overfishing.”
Excessive UV effects plant growth
http://www.ehow.com/how-does_5525557_effects-radiation-plant-growth-development.html
Human health and ecological consequences of ozone depletion.
http://eesc.columbia.edu/courses/v1003/lectures/ozone_health/
Sites that provide daily UV level forecasts. (Lots more out there if you do a search.)
Canada
http://weather.gc.ca/forecast/public_bulletins_e.html?Bulletin=fpcn49.cwao
USA EPA Sun Wise UV Index
http://www2.epa.gov/sunwise/uv-index
UK and Ireland
http://www.weatheronline.co.uk/weather/maps/forecastmaps?CONT=ukuk&R=300
Europe
http://www.temis.nl/uvradiation/UVindex.html
Hong Kong
http://www.hko.gov.hk/wxinfo/uvindex/english/euvindex.htm
Australia, scroll down the page for an interactive map to search by state and location.
http://www.bom.gov.au/australia/uv/
Local UV level links for each Australian monitoring station are now provided.
http://sccc.org.au/monitoring/sunshinecoast-monitoring-station.html
Simi Valley, CA – 10 MIN AVG clear sky
8:10a EXT 55.9 CPM
8:20a INT 43.6 CPM
Exterior 28.2% above interior
Simi Valley, CA – 10 MIN AVG foggy conditions
6:45a INT 41.6 CPM
6:55a EXT 51.9 CPM
Exterior 24.7% above interior
Southern Hemisphere August 2014 rain water Report.
Station location
http://sccc.org.au/monitoring/Australian-Map.jpg
This short animation of Northern, and Southern Hemisphere air circulation, shows why we can get detections so far south.
Rain Water Test Report
Summary:
Significant traces of Lead Pb-210 and Beryllium Be-7 were detected in the rain water. This is surprising considering the local background levels were so low for August. August 2014 had 209.6 mm of rain compared to July’s rain fall of 14.5 mm, so a lot more rain flowed through the filter this month.
Beryllium Be-7 can be made by spallation in the upper atmosphere during solar evens, and takes around two weeks to reach the surface. Lead Pb-210 is a decay daughter of Radon Rn-222.
Roof down pipe filter design for rainwater testing, http://sccc.org.au/down-pipe-filter-design
Test Chart
In this chart I have CPS on the Y axis to show activity, and have turned off Y log to show linear scaling.
http://sccc.org.au/wp-content/uploads/2014/09/Down-pipe-Caloundra-August-filter-test-030914-TV63-20c-97699-B-+-text.jpg
Previous Rain water and soil tests can be found here.
http://sccc.org.au/pages/The-Food-Lab.html#Soil%20Testing%20Results
Simi Valley, CA – 10 MIN AVG clear sky
6:10a INT 41.0 CPM
6:20a EXT 51.1 CPM
Exterior 24.6% higher than interior
Southern Hemisphere August 2014 Background Radiation Report.
Station location
http://sccc.org.au/monitoring/Australian-Map.jpg
This short animation of Northern, and Southern Hemisphere air circulation, shows why we can get detections so far south.
Summary
August’s 2014 monthly average background level was the lowest August monthly average since pre-Fukushima at 4% above the pre-Fukushima month average. August 2014 background levels here have been very stable. This August saw a longer period of Southern Ocean air flows than previous years for August, It is still quite cold here even now considering the time of year.
Even thought the local background level for August 2014 is showing a drop, the August rain water test is showing an increases in Lead Pb-210 and Beryllium Be-7. I will post test chart of the August rainwater test, and a report soon.
Technical details:
(Note: The 4yr average referred to in the charts, is the 4yr pre-Fukushima average.)
August 2014 was 4% above the 4 year pre-Fukushima average.
24 hour day average chart for August 2014
http://sccc.org.au/wp-content/uploads/2014/08/Caloundra-local-average-background-radiation-levels-August-2014.jpg
2014 Month Average chart
http://sccc.org.au/wp-content/uploads/2014/02/Caloundra-monthly-average-background-radiation-levels-for-2014.jpg
2013 Month Average chart
http://sccc.org.au/wp-content/uploads/2013/02/Caloundra-monthly-average-background-radiation-levels-for-2013.jpg
2012 Month Average chart
http://sccc.org.au/wp-content/uploads/2012/09/Caloundra-monthly-average-background-radiation-levels-for-2012.jpg
Simi Valley, CA – 10 MIN AVG partly overcast sky
6:10a INT 48.7 CPM
6:20a EXT 49.0 CPM
Simi Valley, CA – 10 MIN AVG clear sky
6:10a INT 46.5 CPM
6:20a EXT 53.1 CPM
NATIONWIDE RADIATION REPORT
2014/09/01 at 4:00 pm
40 out of 124 beta monitors are functional as of this date out of the 124 areas covered, a drop of 10 percent. Several significant beta stations have gone offline while a couple of crucial ones are sputtering to life. There is a noticeable sharp beta radiation trend upwards at a number of stations across the country but not as bad as the last reporting period. The following three-week summation allows for a larger data set to apprise than the last weekly report.
Readings of 100 CPM or more indicate significant beta radiation activity. Three times background readings could mean a hazardous situation exists and protocols discussed and reported on in EnviroReporter.com since March 11, 2011 should be noted. See that below the tilde symbol (~) before some rad readings means mathematically approximate.
Since August 6 (below in archives), Montgomery AL hit its highest reading since May 26 with a ~270 CPM August 15; Anchorage AK‘s beta graph is still at under 20 CPM all three weeks but burped up into the 40 CPM area twice around August 20-25; Fairbanks AK hit a four-month high with ~150 CPM August 14, part of a continuing uptick in beta activity at the station; Phoenix AZ hit a three-month high ~August 25 with ~210 CPM; Tuscon AZ was over ~350 CPM August 28 remaining quite active; Little Rock AR hit over 380 CPM August 10 trending more active in pulses in an area used to ~20 CPM background; Fort Smith AR suddenly went nuts ~August 22 after having been calmer in the second week of August hitting ~265 CPM~August 24; Anaheim CA‘s beta graph started working August 7 then went dead completely August 15; Fresno CA charted ~270 CPM August 27; Bakersfield CA still coming back online with both beta and gamma in a most welcome development with the beta hitting ~545 CPM August 7; Los Angeles CA‘s beta graph stopped in March but the gamma remains normal and EnviroReporter.com‘s regular test of sea water at Manhattan Beach and Playa Del Rey in Southern California came back normal with no signs of the Sea of Fuku Goo having arrived yet; Riverside CA hit 300 CPM twice in the last period August 12 and August 30; San Bernardino County CA smashed through to a four-month high August 30; San Diego remains extremely active hitting ~200 CPM several times in the last three weeks which is a dozen times background for the city; Hartford CT is trending upward hitting a four-month high August 12 of ~215 CPM which is over ten times its normal background; Washington DC also notched a two-week high August 27 with ~145 CPM; not one beta monitor out of five works in Florida even after us reporting it three weeks in a row – Floridians are breathing beta blind; Augusta GA no longer has a working beta graph in a very active environment, unfortunately; Ft. Wayne IN continues a radical trend upward hitting a four-month high August 24 of 405 CPM which is over ten times background; Baton Rouge LA‘s four-month high was hit August 25 with ~145 CPM; Orono ME looks nice and cool but is marginally more active with ~30 CPM August 30; Baltimore MD‘s beta and gamma graphs are now ‘on’ and functioning properly which is great news; Worcester MA blew through ~235 CPM August 10; Grand Rapids MI hit ~260 CPM August 25; St. Paul MN went up to ~400 CPM August 20, a four-month high by far; St. Louis is trending active hitting ~230 CPM August 25; Lincoln NE hit a four-month high August 3 with ~360 CPM and then its graph died and hasn’t come back, a real loss since this station is in the middle of the country; Concord NH hit ~195 CPM August 27; Albuquerque NM spiked to ~350 CPM several times in the last three weeks with greatly heightened activity and frequency; Buffalo NY is increasing active hitting ~208 CPM August 21 when its normal background is about 20-25 CPM; New York City NY is not functioning as it hasn’t for years but its gamma gross count is sort of settling down; Syracuse NY‘s beta graph went out before hitting ~135 CPM July 27 but came back on going down to ~65 CPM the night of August 3 before stopping then coming on again only to totally die August 24; Charlotte NC hit a four-month high August 29 with ~180 CPM; Raleigh NC hit ~170 CPM July 24 and cut out and still hasn’t come back on, a real loss in the South; holy Toledo OH is going through the roof right at the same time as their drinking water crisis eases with the beta peaking at ~370 CPM August 5, a four-month high and stayed active while dropping off a bit; Corvalis OR hit ~200 CPM August 26 in a place that has a background of under 20 CPM; Pittsburgh PA‘s beta graph hit ~205 CPM August 5 in active ionizing and has remained active; Puerto Rico‘s beta graph doesn’t work but the gamma remains low and steady which makes it even cooler even with the one-day major hiccup August 25; Amarillo TX went literally off the chart August 3 blasting through 1,000 CPM and is the most active beta station in the country that functions; Dallas TX was ~300 CPM August 28; Ft. Worth, is trending active hitting ~150 CPM August 25; Salt Lake City UT‘s beta station is still down since a huge beta increase over 200 CPM in early May and it’s gamma bears watching as it has pulses of spikes; and Madison WI hit a four-month high August 22 charting an astounding 500 CPM.
Simi Valley, CA – 10 MIN AVG clear sky
8:00a INT 45.7 CPM
8:10a EXT 58.2 CPM
Exterior 27.3% higher that interior
Simi Valley, CA – 10 MIN AVG clear sky
8:05a INT 47.9 CPM
8:15a EXT 49.9 CPM
Simi Valley, CA – 10 MIN AVG clear sky
7:55a EXT 58.8 CPM
8:05a INT 48.9 CPM
Exterior 20.2% above interior
EnviroReporter.com‘s Michael Collins and Denise Anne Duffield will be testing another beach further north of Manhattan Beach today to continue keeping a close watch on Southern California waters monitoring for Fuku goo.
Simi Valley, CA – 10 MIN AVG clear sky
6:10a INT 49.0 CPM
6:20a EXT 51.1 CPM
Simi Valley, CA – 10 MIN AVG clear sky
6:10a INT 46.4 CPM
6:20a EXT 55.5 CPM
[Editor: Exterior 19.6% higher than Interior]
Simi Valley, CA – 10 MIN AVG clear sky
6:10a INT 43.5 CPM
6:20a EXT 54.3 CPM
[Editor: Exterior 24.8% higher than Interior]
Simi Valley, CA – 10 MIN AVG clear sky
6:10a INT 44.9 CPM
6:20a EXT 52.4 CPM
[Editor: Exterior is 16.7% above Interior]
Hot rain moving through US and Canada with levels similar to 2011. – 20th August 2014.
Extract:
The Fukushima activity increase that started in early July continues to increase. High radiation levels have been measured in rain in Wisconsin, Illinois, Michigan, Ohio, and Ontario for the last couple of days. Vegetation is being affected and damaged by this rain.
UPDATE: Diane Steele took these photos of her squash and bean plants after the hot rainstorm moved through her home in Minnesota. This damage was not there prior to this rain.
http://optimalprediction.com/wp/hot-rain-moving-through-us-and-canada-with-levels-similar-to-2011/
Simi Valley, CA – 10 MIN AVG clear sky
6:10a INT 46.6 CPM
6:20a EXT 52.3 CPM
Timothy A. Mousseau: Tokyo press conference August 2014,
“Fukushima Catastrophe and its Effects on Wildlife”
Simi Valley, CA – 10 MIN AVG clear sky
7:25a INT 44.3 CPM
7:35a EXT 52.8 CPM
[Editor: Exterior 19.2% above Interior]
Simi Valley, CA – 10 MIN AVG clear sky
6:10a INT 46.0 CPM
6:20a EXT 48.9 CPM
Simi Valley, CA – 10 MIN AVG clear sky
6:10a INT 50.4 CPM
6:20a EXT 51.5 CPM
Big summer thunder storm in Hemet, CA.
I threw a paper towel outside and tested it (still damp) about two hours after the rain ended.
Paper towel: 51.7
Background: 42
[Editor: rain-dampened paper towel 23.1% over background two hours after rain.]
Simi Valley, CA – 10 MIN AVG overcast sky
6:10a INT 46.3 CPM
6:20a EXT 56.0 CPM
[Editor: Exterior is 21.0% above Interior]
Simi Valley, CA – 10 MIN AVG mostly clear sky
6:10a INT 45.1 CPM
6:20a EXT 49.5 CPM
Simi Valley, CA – 10 MIN AVG overcast sky
6:50a INT 51.4 CPM
7:00a EXT 52.2 CPM
East Los Angeles,CA-10 min avg clear sky
10:40 am EXT 47.2 Counts Per Minute
10:55 am INT 42.4 counts per minute
Hector
Wb Johnson Instruments DSM-500/Johnson hp-265
Cal 4/14
Simi Valley, CA – 10 MIN AVG clear sky
8:20a EXT 53.0 CPM
8:30a INT 49.3 CPM
Simi Valley, CA – 10 MIN AVG clear sky
8:05a EXT 52.1 CPM
8:15a INT 47.3 CPM
Simi Valley, CA – 10 MIN AVG clear sky
6:10a INT 45.3 CPM
6:20a EXT 54.1 CPM
[Editor: Exterior is 19.4% above Interior]
@biggee: Thank you for this. I do not put much credence in the creator of this video or its murky conclusions. As for reporting ‘on the air’ on the threat of Fukushima to North America, nothing beats actually looking at the (usually) reliable numbers and talking about them as we already are doing. See U.S. air radiation surges higher with copy, data and video. You, biggee, need to keep those rain readings coming.
RADIATION STATION HARRISBURG NC
Surprised no one has put this ling up.THE NORTHERN PACIFIC IS PRETTY WELL DEAD!
Michael we need you reporting back on RENSE !
Email this to everyone you know
https://www.youtube.com/watch?v=-1FrscZBjhc&feature=youtu.be
Simi Valley, CA – 10 MIN AVG overcast sky
6:10a INT 46.4 CPM
6:20a EXT 52.9 CPM
Simi Valley, CA – 10 MIN AVG clear sky
6:10a INT 46.4 CPM
6:20a EXT 51.0 CPM
Simi Valley, CA – 10 MIN AVG partly cloudy sky
6:10a INT 43.2 CPM
6:20a EXT 52.6 CPM
[Editor: Exterior is 21.8% higher than Interior]
Simi Valley, CA – 10 MIN AVG clear sky
6:10a INT 43.8 CPM
6:20a EXT 55.3 CPM
[Editor: Exterior 26.3% above Interior]
Simi Valley, CA – 10 MIN AVG clear sky
8:10a EXT 54.5 CPM
8:20a INT 45.5 CPM
[Editor: Exterior 19.8% above Interior]
Southern Hemisphere July 2014 Rain Water Test Report
Station location
http://sccc.org.au/monitoring/Australian-Map.jpg
This short animation of Northern, and Southern Hemisphere air circulation, shows why we can get detections so far south.
Summary:
Even thought the roof rainwater water collection area that passed through the polyester filter has been nearly doubled this month, there were only been very small traces of I-129, Pb-210 and Be-7 detected. July rain fall was also low at 14.5 mm.
Test Chart
In this chart I have CPS on the Y axis to show activity, and have turned off Y log to show linear scaling.
http://sccc.org.au/wp-content/uploads/2014/08/Down-pipe-Caloundra-July-filter-test-020814-TV63-18c-84600-+-text.jpg
Previous Rain water and soil tests can be found here.
http://sccc.org.au/pages/The-Food-Lab.html#Soil%20Testing%20Results
Hemet, CA 10 min ext: 41.8
Simi Valley, CA – 10 MIN AVG overcast sky
7:50a INT 45.1 CPM
8:00a EXT 51.3 CPM
Ventura, CA 10 min exterior: 50.3
Simi Valley, CA – 10 MIN AVG clear sky
6:10a INT 45.6 CPM
6:20a EXT 50.9 CPM
Re: NATIONWIDE RADIATION REPORT
Amarillo, TX at 1,000 cpm
Fresno, CA at 540 cpm
Ft. Wayne, IN 450 cpm
😯 These readings seem very high to me.
What is the reason?
Shouldn’t the public who live in these areas (like me) be alerted in some way to readings like this? Isn’t that why we have ‘the system’ in the first place? Is somebody ‘dropping the ball’ at the EPA or just ‘passing the buck’ somehow?
Maybe in addition to amber and other alerts on people’s phones, we should also have Rad Alerts. Unfortunately, I have a feeling that day may be coming soon.
At least for now, thanks to EnviroReporter.com, we have the NATIONWIDE RADIATION REPORT’s easy to read summary and a video explanation.
Simi Valley, CA – 10 MIN AVG overcast sky
6:10a INT 45.2 CPM
6:20a EXT 52.7 CPM
Simi Valley, CA – 10 MIN AVG overcast sky
6:10a INT 44.5 CPM
6:20a EXT 49.0 CPM
Simi Valley, CA – 10 MIN AVG foggy
6:10a INT 46.2 CPM
6:20a EXT 53.1 CPM
Southern Hemisphere July 2014 Background Radiation Report.
Station location
http://sccc.org.au/monitoring/Australian-Map.jpg
This short animation of Northern, and Southern Hemisphere air circulation, shows why we can get detections so far south.
Summary
July’s 2014 monthly average background level is the same as July 2013, 5% above the pre-Fukushima average. This is less than the 9% above average for 2012.
July 2014 background levels here have been very stable. This generally occurs every winter, as we get increased Southern Ocean air flows.
Note:
The monitoring Geiger counter has been in the same room, and room location, data logging background radiation levels, over the years. This year we had to do much needed renovations to the room. If you saw the room before the renovations, you would understand why. : )
Since May, the room where the monitoring Geiger counter is located, has had the ceiling, roof over the room, and carpet replaced with new materials, plus the walls have been newly painted. The wooden furniture the GammaScout Geiger counter sits on has also been changed. It is still in the same location in the room.
Overall as far as I can tell, this has not significantly changed the ambient background. If it has, it is by a very small amount.
Technical details:
(Note: The 4yr average referred to in the charts, is the 4yr pre-Fukushima average.)
July 2014 was 5% above the 4 year pre-Fukushima average.
24 hour day average chart for July 2014
http://sccc.org.au/wp-content/uploads/2014/07/Caloundra-local-average-background-radiation-levels-July-2014.jpg
2014 Month Average chart
http://sccc.org.au/wp-content/uploads/2014/02/Caloundra-monthly-average-background-radiation-levels-for-2014.jpg
2013 Month Average chart
http://sccc.org.au/wp-content/uploads/2013/02/Caloundra-monthly-average-background-radiation-levels-for-2013.jpg
2012 Month Average chart
http://sccc.org.au/wp-content/uploads/2012/09/Caloundra-monthly-average-background-radiation-levels-for-2012.jpg
Disclaimer: This is an amateur volunteer run service. Human error can provide incorrect information, and equipment malfunction can produce false readings. Do not rely on, or take action upon information presented here, without further research.
Thanks, Michael! I also ran across this site, which is showing levels “below detection” across southern CA. Sounds to me like the worst of it isn’t here yet.
Simi Valley, CA – 10 MIN AVG clear sky
6:10a INT 47.2 CPM
6:20a EXT 51.2 CPM
@Kim et al: We sure do and here they are below and the results indicate that the Sea of Fuku Goo hasn’t hit Los Angeles, yet. Keep those Hemet rain measurements coming!
August 3, 2014
4:10 pm RAIN gathered 0.5 to 1.0 hours of deposition: 45.8 CPM^^^ or essentially background at 15.1% which is the conservative limit of the Inspector’s margin of error, =/-15%.
3:30 pm BG: 39.8 CPM^^^
11:30 am RAIN from overnight accumulation with on new rain for two hours: 38.4 CPM^^^
11:15 am BG: 39.3 CPM^^^
Michael, any update on the beach?
RADIATION STATION HARRISBURG NC
Heres the NANOBOTS/VACCINES I just mentioned below article
http://www.jimstonefreelance.com/phages.html
RADIATION STATION HARRISBURG NC
Just found this website.OPEN/DOWNLOAD All here…also check out his page on NANOBOTS and VACCINES..Your feedback appreciated
http://www.jimstonefreelance.com/fukushima1.html
East Los Angeles, CA
ambient dose rate 13uR/hr at 8:15am.
Hector
WB Johnston DSM-500 Geiger Counter
calibrated 4/14
East Los Angeles,ca 10 minute paper towel wipe test at 10:05 pm. Background internal 44 cpm.
The wet paper towel came in at 210cpm.
Radon in the rain. Now raining heavier.
Hector
Moderate showers in East Los Angeles,ca at 9:35pm. Dose rate 24uR/hr external. Typical external dose for this are is 11-13uR/hr.
Hector
WB Johnson DSM-500+energy compensated gm probe.
Cal 4/2014
Update: rain sample tested 53.7 after approx 90 minutes.
Has anyone been testing at/near the beach lately?
[Editor: Denise Anne and I will be testing at Playa Del Rey this evening, Kim!]
HOT RAIN!
Hemet, CA rain storm.
We soaked a paper towel and brought it inside to test.
Background: 51.9
rain sample: 84.4
Will retest in an hour to see if it decays much and report back.
[Editor: Rain reads 62.6% higher than background]
Thank you for your rapid and gracious response, Michael.
@Craig Daniels: Thank you for this astute comment and the excellent, detailed work that you have done – check Craig’s work out, folks. I’m aware of your view that this may not be the most valid comparison but do note that I call reaching the 100 Counts Per Minute (CPM) level informally as the “uh-oh” zone. Indeed, it really becomes the uh-oh zone when there is a level of triple background (BG). This is very conservative (meaning, for the readers, we consider 3 x BG to get into the Hot Zone) when, in fact, I am looking solely at beta emissions as the determinate divided by the background. Yes, our ground/roof accumulation based gamma/beta background counts do not directly associate with the beta readings in the EPA beta graphs, but I make sure to make clear that the beta BG levels can be teased out of the different beta graphs through analysis of long trends. I’ve done this by ‘saving’ such graphs for a long time, much longer than the four month time periods in the US EPA RadNet graphs raddies see in the graphs online at EnviroReporter.com.
So, Craig, it would be more accurate to do what you will hear more of in our next video – going up right now – where I discuss beta readings versus beta background. Three times background is considered “significant” by the federal EPA Region 9 and is a threshold for considering a material and/or environment to trip a hazardous materials response by the California Highway Patrol according to Nuclear Regulatory Commission documents. As you will see/hear in our Radiation Report July 30, 2014, if you look at a site like San Diego with a normal beta range of ~15 to ~20 CPM and the beta graph is spiking to 90 CPM, that is over four times background, and definitely troublesome, even though the spike hasn’t hit 100 CPM.
Yours is an excellent comment, Craig, and I hope you find our second video more explanatory and “oranges to oranges.” We look forward to more discussion of these crucial subjects with you and the folks on Enenews with whom you’ve been discussing this with. Thank you.
Dear Mr. Collins,
* Thanks for your easy access to EPA-RadNet graphs.
* Concerning your 7/24 US Radiation Report video, when (at 2 minutes in) you cite volatile air filter based RadNet beta counts/min –in comparison to (essentially) ground/roof accumulation based gamma background counts/min –well: how can there be a valid comparison?
This strikes me as being “Apples to oranges”. (You might want to ask a trusted rad guy like Fairewinds’ Marco Kaltofen for an opinion on that.)
Craig
Hemet, CA, 10 minute exterior: 42.8
Report from FukushiMan, 26th July 214
Comment:
Park has very hot spots, and children play there, criminal.
http://vancouvermonitoring.blogspot.ca/2014/07/report-from-fukushiman.html?m=1
East Los Angeles,ca 10 minute average at 7:15am
External-46 cpm.
Internal-43 cpm
Hector
WB Johnson Instruments DSM-500
Calibrated April 2014
Hello everyone!
As a reminder, there are only 5 days left to submit your comment to the EPA telling them no thank you to increasing radioactive release limits of radioactive emissions from nuclear power plants.
At present levels, studies already show higher incidences of childhood leukemia in children living near/downwind of nuclear power plants:
Won’t you please submit a comment and let your voice be heard? The commenting process is quick, easy and anonymous, if you want.
Here is the link to submit a comment:
http://www.regulations.gov/#!submitComment;D=EPA-HQ-OAR-2013-0689-0001
And here is a good breakdown explaining the EPA’s intentions:
http://enformable.com/2014/07/epa-wants-opinion-well/
Time is of the essence! Comments due by August 3rd.
Thank you!
Simi Valley, CA – 10 MIN AVG cloudy sky
6:45a INT 44.1 CPM
6:55a EXT 49.8 CPM
@Chase: Thank you so much. Very interesting advice but your optimal recommendation is to report on 10 locations in 30 seconds which sounds a little too fast for such an important subject. But we’re up for an experiment and want your raddie friends at the sites you habituate to participate. Share the link to this video, “U.S. Radiation Report 24 July 2014” at http://youtu.be/P6nf22rcPMY and ask them what they think. Perhaps making the report a short commercial-like video is the way to go but it just might be that raddies might want a little more meat on the bones. Please share any results.
Excellent video on ‘How To’ look at the graphs.
Very informative. Should be a mini segment on the NBC National News. (ha)
Suggestion:
Make a weekly NATIONWIDE Radiation Reports – TOP 10. Make the video less than 60 seconds. 30 seconds is optimal. The shorter and more like a commercial the video is, the more likely people will watch.
Amarillo has always been the worst from what I remember over the last couple of years.
Fort Wayne, IN has also had ongoing issues too.
Salt Lake City, UT really makes one wonder. They should at least post a note as to why a unit is offline and when it is supposed to be working again. How hard is that?
😯 This is so important. Thank you. 🙂
With our Radiation Stations kicking it up a notch with even more invaluable radiation readings, we thought we’d do the same thing by YouTubing our weekly Nationwide Radiation Report to give raddies a one-stop-shop to peruse the country’s beta and gamma readings. We hope you like it and welcome any comments you may have here or over on our YouTube channel.
Simi Valley, CA – 10 MIN AVG cloudy sky
8:45a EXT 52.4 CPM
8:55a INT 48.4 CPM
Simi Valley, CA – 10 MIN AVG clear sky
8:10a EXT 48.3 CPM
8:20a INT 46.1 CPM
Simi Valley, CA – 10 MIN AVG clear sky
6:10a INT 43.7 CPM
6:20a EXT 47.0 CPM
East Los Angeles, CA 97 degrees in the shade!! Gamma ambient dose reading at 12:44pm.
13uR/h- normal range
Hector
WB Johnston Instruments DSM-500
calibrated April 2014
Simi Valley, CA – 10 MIN AVG clear sky
6:10a INT 46.5 CPM
6:20a EXT 54.6 CPM
East Los Angeles gamma dose rate 14uR/h(microrems per hour) at 4:17pm. Normal range for this are.
Hector
WB Johnson Instruments DSM-500
I’m back! Here are my readings from this morning.
Simi Valley, CA – 10 MIN AVG clear sky
6:10a INT 46.5 CPM
6:20a EXT 51.5 CPM
@Chase, lester et al: Thank you so much! These weekly reports will also be coming out soon in videos so we can also walk you through the graphs describing what is hot and what is not. By having these Nationwide Radiation Reports archived online, along with daily readings of 124 sites nationwide available 24/7, 365 days a year at RadNet Air Monitoring, it allows us to keep you informed of the big picture as well as the hot spots. And is it hot this week? Oh yes and the latest report doesn’t even include the latest highly radioactive rain detected by Radiation Station Harrisburg, North Carolina, which poured in at nearly 7 times background!
Of course, EnviroReporter.com has another huge exposé in the works that we’ll be publishing soon that will blow your socks off.
I also like the NATIONWIDE RADIATION REPORTS. 🙂
Thanks for the effort.
Noting the number of operational vs nonoperational station monitors is an indicator of something. I’m just not sure what or why. (?)
RADIATION STATION HARRISBURG NC for 7/21/14 Monday
Humid/Gray/Damp moderate rain @ 10:00 AM
1… 226.1 cpm rain sample
2…. 40.0 cpm (outside background)
3…. 32.8 cpm (inside background)
[Editor: Rain was 6.9 times background indoors where it was measured.]
Thank you for Nationwide Radiation Report . It clearly shows We are exposed to low dose of radiation for many years to come .
No, it’s not a Fuku cloud; it’s just lightening. As we reported in Beta Watch, radiation impacted sea mist can travel over 100 miles inland. We also reported on March 11, 2014 in Fukushima – The Perfect Crime? that the Sea of Fuku Goo has been detected as far south as Capitola which is just up the coast from Salinas. Beware the lightening and play it safe by not eating any of the local seafood or any, for that matter, from the northeast Pacific.
Emergency Action Alert for San Benito County appeared on TV today starting around 2:55 pm 7/20/14. Advising everyone to go inside and stay away from the windows and doors. A severe lightening storm was stationary near Pinnacles National monument. Could this be a Fuku cloud?
Stay inside? Still not cancelled at 5:00 PM PST. I live in Salinas CA.
RADIATION STATION HARRISBURG NC
Here’s the actual test. Just uploaded it to my YouTube channel.
https://www.youtube.com/watch?v=_QoRMIuwbyc&feature=youtu.be
@biggee: Thank you for this latest and shockingly high rain radiation reading. As we have reported repeatedly based on a Nuclear Regulatory Commission obtained by EnviroReporter.com, the California Highway Patrol considers anything three times background to trigger a hazardous materials situation. Your readings, biggee, are triple this haz-mat trip wire. EnviroReporter.com maintains that rain this hot should be avoided by young women, pregnant women and children.
@All: The beta radiation in the western Los Angeles basin has risen considerably since we last tested it in June according to our monthly HEPA filters debris tests.
July 17, 2014
6:00pm INT HEPA DUST from two HEPA filters, one Ionizer/HEPA filter and an exhaust fan’s blade dust buildup: 74.6 CPM^^ which is 64.7% HIGHER than background over a 31 day period. This is over 25% higher per day as the previous period that ended June 16, 2014. Los Angeles RadNet beta station still not functioning after working for three years after the Fukushima triple meltdowns began.
5:30pm INT BG: 45.3 CPM^^
Thank you Deeann for that notice below. The more I read about the state of the nuclear power industry, the more I have to wonder about all those assumptions that are made at the outset of the building, expansion, and nuclear plant certification renewal programs. The existing rules, and policies it seems, turned out to be “outdated” based on assumptions that were wrong in many respects. Meaning, historically, the situation just didn’t turn out that way the way they expected. It never does, of course. But, that is the motivation for updating the rules.
Now, it seems, the stakeholders want to release even more radiation during normal operations. If you read through the link to the EPA document, you will see that part of what they are doing is balancing costs against risks.
Are the stakeholders intending to increase safety for people and the environment? It seems more likely that they wish the EPA to change the rules to reduce their costs and potential liability. More radiation released into the environment cannot produce greater safety. Can a case be made to state what level of expense is required to produce acceptably low levels of radiation that cannot harm us or the environment? Will the EPA be able to make such a judgement? Will their determination be based on facts, or additional assumptions? How much additional radiation would you like to breathe, eat, or sprinkle on your garden?
The EPA is asking for public comments on their new attempt to raise the amount of radiation emitted from nuclear power plants.
This summary explains what they want to do:
“This Advance Notice of Proposed Rulemaking (ANPR) requests public comment and information on potential approaches to updating the Environmental Protection Agency’s “Environmental Radiation Protection Standards for Nuclear Power Operations” (40 CFR part 190). These standards, originally issued in 1977, limit radiation releases and doses to the public from normal operation of nuclear power plants and other uranium fuel cycle facilities—that is, facilities involved in the milling, conversion, fabrication, use and reprocessing of uranium fuel for generating commercial electrical power. These standards were the earliest radiation rules developed by EPA and are based on nuclear power technology and the understanding of radiation biology current at that time. The Nuclear Regulatory Commission (NRC) is responsible for implementing and enforcing these standards.”
http://www.regulations.gov/#!documentDetail;D=EPA-HQ-OAR-2013-0689-0001
Comment here. It’s anonymous:
http://www.regulations.gov/#!submitComment;D=EPA-HQ-OAR-2013-0689-0001
East Los Angeles external gamma ambient dose at 1:05pm. 12 microrems per hour. Normal for this area.
Hector
Wb Johnson Instruments GSM-500 with energy compensated probe.
Sophisticated radiation detector designed for broad public use. The system is a miniaturized gamma ray spectrometer, which means it can measure not only the intensity of radiation but also identify the type of radionuclide that is creating it. Such a system is far more sophisticated than old-fashioned “Geiger counters” that provide only minimal information about the presence and level of radioactivity.
http://www.eurekalert.org/pub_releases/2014-07/osu-srd071014.php
http://www.eurekalert.org/multimedia/pub/76068.php?from=272098
Australia,
Queensland,
Sunshine Coast,
June 2014 Southern Hemisphere Background Radiation Report
Station location
http://sccc.org.au/monitoring/Australian-Map.jpg
This short animation of Northern, and Southern Hemisphere air circulation, shows why we can get detections so far south.
Roof down pipe filter design for rainwater testing, http://sccc.org.au/down-pipe-filter-design
Summary
At this location, the data suggests airborne radioactive contamination leakage into the Southern Hemisphere has stabilized at present, as increases are not as dramatic as previous years.
Technical details:
(Note: The 4yr average referred to in the charts, is the 4yr pre-Fukushima average.)
June 2014, 7% above the 4 year pre-Fukushima average.
http://sccc.org.au/wp-content/uploads/2014/02/Caloundra-monthly-average-background-radiation-levels-for-2014.jpg
June 2013, 7% above the 4 year pre-Fukushima average
http://sccc.org.au/wp-content/uploads/2013/02/Caloundra-monthly-average-background-radiation-levels-for-2013.jpg
June 2012, 3% above the 4 year pre-Fukushima average
http://sccc.org.au/wp-content/uploads/2012/09/Caloundra-monthly-average-background-radiation-levels-for-2012.jpg
East Los Angeles, ca 10 minute external average at 11:20am 43
counts per minute-normal range
Hector
East Los Angeles,ca 10 minute average external count rate at 2:15 pm.
47 cpm
External ambient dose rate 13uR/h
All normal readings
Hector
Wb Johnson DSM-500
42 working out of 124 EPA monitors…?
Outrageous, deplorable and insanely morally wrong! 🙁
FACT: We have out of control TRIPLE CORE MELTDOWNS spewing daily and hundreds more that hold the same potential.
Why would these issues not be fixed?
Why is there not a national effort to better understand and to do our best to safely mitigate what we KNOW is here and will continue?
One would think that after 3 years the Untied States of America would be on top of this global crisis. But, that’s not the case. Ask yourself… why???
IMO – The only thing ‘under control’ is the media information regarding Fukushima and the way it’s ‘fed’ to a public that’s more concerned with so called reality shows on TV. 😉
EnviroReporter.com is now providing nationwide radiation reports culled from our RadNet Air Monitoring. This exists nowhere else and is the most accurate and detailed look at the beta and gamma radiation readings from 124 radiation stations across the United States and Puerto Rico.
June 30, 2014 at 6:54 pm
Our EPA RadNet Air Monitoring shows that 42 beta monitors are functional as of this date out of the 124 cities covered. That’s up from 40 but about half a dozen of them seem to have stopped on June 27. We are still counting these as active just in case it has to do with it being the end of June. Even without beta graphs, one can glean data out of the gamma graphs – take note of the radiation reading patterns in locations that do have both beta and gamma graphs. They often move together. So this could help at least give an idea of the beta readings at a site if only the gamma information is available. Note that below, the tilde symbol before some rad readings “~” means mathematically approximate.
Some places got hotter since June 19 (below in archives): Montgomery AL started settling down but zoomed up to ~140 CPM yesterday; Anchorage AK is very low; Phoenix AZ‘s graph has stayed out since June 10 when it was ranging up to 165 CPM the week before outage; Tuscon AZ was over 200 CPM today; Fresno CA has cooled down to 90 CPM; Los Angeles CA‘s beta graph crapped out in March but the gamma is not active; Riverside CA dropped to 100 CPM today; Augusta GA settled down to 100 CPM by today; Ft. Wayne IN hit 225 CPM in the last week; Orono ME looks nice and cool showing how the farthest away station from Fukushima has the lowest beta radiation with ~17 CPM today; Baltimore MD‘s beta and gamma graphs are still out; St. Paul MN went nuts and hit 340 CPM in the last week; St. Louis has dropped to ~50 CPM even with that burning radioactive dump; Albuquerque NM‘s beta station is back online and trending down with only ~55 CPM today after peaking at ~335 CPM June 22; Buffalo NY is trending up hitting ~140 CPM June 28; New York City NY is not functioning as it hasn’t for years; Syracuse NY‘s beta graph settled down to ~65 CPM today; Charlotte NC is picking up repeatedly hitting over 100 CPM; Raleigh NC jumped to 150 today; holy Toledo OH jumped to ~140 CPM today; Corvalis OR really cooled off to ~20 CPM today; Pittsburgh PA hit ~105 CPM yesterday; Puerto Rico‘s beta graph doesn’t work but the gamma is low and steady; Amarillo TX continues to amaze with 450 CPM June 27; Dallas TX down to 55 CPM today; the whole state of Texas, save Ft. Worth, is getting hammered but lack of beta information means the Lone Star State is nearly blind but nevertheless hot; Salt Lake City UT‘s beta station is still down; Charleston WV is still out after nearly hitting 400 CPM in March; and Madison WI hit ~145 CPM June 28 after topping out at ~295 CPM May 28, 2014.
East Los Angeles external gamma ambient dose rate at 12:45 pm. 12uR/h normal for this area.
Hector
WB Johnston DSM-500
East Los Angeles external gamma dose at 8:30 pm.
13uR/h (microrems). Normal for this area.
Hector
WB Johnson DSM-500 alarming survey meter with energy compensated Johnson GP-1001
alarm set at 50uR/H
East Los Angeles external ambient dose rate 12uR/h at 9:45pm
Hector
Wb Johnson DSM-500 + energy compensated gm probe
10 minute average count rate activity at 3:00 pm.
51 cpm external
47 cpm internal
External gamma dose 13 microrems per hour
Hector
Wb Johnson DS-500M
Australian Station location
http://sccc.org.au/monitoring/Australian-Map.jpg
This short animation of Northern, and Southern Hemisphere air circulation, shows why we can get detections so far south.
June 2014 drain soil test
I have a large 30 square meter concrete slab that flows into one drain. It is an uncovered area at the time of sample collection. It had become full of runoff. This runoff had formed a fine soil with fine plant roots throughout it. When I cleaned the drain out, I collected a 526 grams sample, and placed it into a marinelli beaker for testing.
This is mainly the soil, minus the fine plant roots. I did not dry it out, so there would be some water content.
Lots of Lead Pb-210!
Lead Pb-210 is the end product of atmospheric Radon Ra-222 decay daughter isotope washout, and has a half life of 22 years. Radon itself is a decay daughter of Uranium U-238 decay.
Are more Radon decay daughters being created in the atmosphere by the huge amount of nano sized Uranium particles released from the Fukushima Nuclear Disaster, and the use of Depleted Uranium (DU) ammunition?
When I do a scintillator test I usually have two free MCA software programs running at the same time, Theremino and Becqmoni. This allows me to cross reference chart test results. Also, each software package has different advantages over the other. I used Becqmoni to work out the Pb-210 activity, in Becquerels per kilogram, for this soil sample.
http://sccc.org.au/wp-content/uploads/2014/06/Soil-from-drain-Caloundra-526-grams140614-TV62-22c-84695-+-text.jpg
The rest of the spectrum is a mixture of Uranium and Thorium decay daughters, plus some Be-7. The peak around 186 keV is most likely Radium. Maybe just a concentrating effect of the of Pb-210 from the large concrete surface area into this drain.
Here are some previous local soil tests. The detected amounts of Pb-210 present in these tests is a lot smaller.
http://sccc.org.au/wp-content/uploads/2012/08/Local-soil-sample-880grms-230812-60-81.jpg
This one was a soil area, where a tin roof drained onto it.
http://sccc.org.au/wp-content/uploads/2012/09/Glenview-soil-sample-616-grms-060912-63.84-9.jpg
Simi Valley, CA – 10 MIN AVG clear sky
7:10a EXT 52.8 CPM
7:20a INT 49.2 CPM
Simi Valley, CA – 10 MIN AVG clear sky
6:40a INT 45.2 CPM
6:50a EXT 50.4 CPM
Our EPA RadNet Air Monitoring shows that only 40 beta monitors are functional as of this date out of the 124 sites covered. Last July 9, 60 stations were operable meaning there has been a 33% loss even as the Fukushima and WIPP fiasco’s continue unabated. These stations are run by volunteers who deserve our gratitude. They also deserve compensation because we deserve 100 percent functionality of these beta graphs.
Of particular concern are some locales that caught our attention today on the working beta graphs: Montgomery AL is at 165 CPM; Phoenix AZ’s graph is out since June 10; Tuscon AZ was over 500 CPM June 1; Fresno CA is picking up hitting over 350 CPM this month; Los Angeles CA’s beta graph crapped out in March; Riverside CA keeps cookin’; Augusta GA hit 350 CPM in the last week; Orono ME looks nice and cool showing how the farthest away station from Fukushima has the lowest beta radiation; Baltimore MD’s beta and gamma graphs are out; Albuquerque NM was trending down before its beta station, not too far from WIPP, went belly up; Buffalo NY is trending up hitting 110 CPM June 10 but Syracuse NY’s beta station quit in the last month; Corvalis OR is picking up topping 150 CPM in the last week; Pittsburgh PA continues to trouble; Amarillo TX is trending down ‘only’ hitting 300 CPM in the last week; the whole state of Texas, save Ft. Worth, is getting hammered to various degrees but El Paso TX, which is close to WIPP, has lost both beta and gamma monitors; Salt Lake City UT’s beta crapped out a month ago; Olympia WA is looking sweet with low beta and hot Charleston WV has lost both graphs when they least needed being radiation blind.
East Los Angeles checks in with 10 minute averages at 5:15pm
External 49 cpm- normal for this area.
Internal 39 cpm- normal
External dose 12uR/h-normal for this area.
Hector
WB Johnson DSM-500
Johnnson HP-265
Johnson GP-1001
Simi Valley, CA – 10 MIN AVG clear sky
6:15a INT 47.5 CPM
6:25a EXT 51.6 CPM
Simi Valley, CA – 10 MIN AVG clear sky
6:40a EXT 48.3 CPM
6:50a INT 45.9 CPM
Wow! Over 2,000 tests by our affiliated Radiation Stations! A special EnviroReporter.com thank you to the folks that make it happen especially Radiation Station Simi Valley‘s Rich Cusano, Radiation Station Sunshine Coast Australia‘s Peter Daley, who also runs the world’s most comprehensive Radiation Food Lab, and Dale Ramicone whose Radiation Station Glendale California streams 24/7 every day of the year helping Southern California keep an eye on ambient radiation levels and any possible Fuku Goo in our rare rains.
Simi Valley, CA – 10 MIN AVG clear sky
6:15a INT 44.4 CPM
6:25a EXT 48.2 CPM
Here are the links to the mutated Banana and Strawberry photos, for the previous post, which seem to be broken.
http://sccc.org.au/wp-content/uploads/2014/06/twin-bananas-NSW-300×225.jpg
http://sccc.org.au/wp-content/uploads/2014/06/Mutated-strawberry-300×296.jpg
Here is the link to the test chart of the twin banana. It seems to have become a broken like in the previous post.
http://sccc.org.au/wp-content/uploads/2014/06/Bananas-Mt-Warning-area-280-grams-020514-TV62-22c-two-tests-plus-background-84630-1024×638.jpg
Australian Banana and Strawberry Plant Mutation Report
I was sent twin bananas to test, from Northern New South Wales. Around the same time, we also found a mutated strawberry in a strawberry punnet, purchased from the local supermarket. The strawberries came from Victoria.
http://sccc.org.au/wp-content/uploads/2014/06/twin-bananas-NSW-300×225.jpg
http://sccc.org.au/wp-content/uploads/2014/06/Mutated-strawberry-300×296.jpg
Both the banana and the strawberry samples were long count tested, with a very sensitive Geiger counter. These tests showed no elevation above background. The samples were then tested with a Scintillator, in a lead and copper lined test chamber. Each sample was tested twice, and each test was run for 24 hours.
Voltage setting;
800 Volts
Scintillator Model:
2″ Alpha Spectra NaI 818/2B,
resolution 7%
Note: Experimental software MCA Theremino V6.2 was used for the scintillator testing. It is quite noisy, near background levels. We are talking very low counts per second (CPS) at this level, as low as one count every 100 + seconds. This can make it difficult to define if some very small peaks are actual isotope detections, or random variations in background levels.
Note: This scintillator has around 50% efficiency at 60 keV.
Banana Test
The brown and gold lines are the Banana tests, and the grey is background.
You will see both banana tests overlaid on the test chart. I have highlighted the significant areas above background that are common to both tests, in yellow. Possible isotopes candidates for these peak areas are Lead Pb-210, Americium Am-241, Thorium Th-234, Uranium U-235 and Beryllium Be-7. Common isotope peak markers are at the top of the chart. The suggested Lead Pb-210, Am-241, Thorium Th-234, Uranium U-235 detections were so small that there is considerable uncertainty to this analysis.
If Thorium Th-234, and Uranium U-235 are present it, would indicate refined uranium was a contaminant. More expensive sensitive equipment would be needed to verify these detections. The bananas went rotten during the testing, and becoming liquid mush. This may explain the peak differences between tests, as sample material moved around during the testing period.
Twin Banana Test Chart
http://sccc.org.au/wp-content/uploads/2014/06/Bananas-Mt-Warning-area-280-grams-020514-TV62-22c-two-tests-plus-background-84630-1024×638.jpg
Strawberry Test
The strawberry weighed was only 9 grams. This is a very small plant sample amount to test for possible trace amounts of radioactive contamination. Any possible peaks that showed up in the first test, turned out to be random variations in background. If there was any radioactive contamination present in the mutated strawberry, my equipment was not sensitive enough to identify it.
Cut up for testing
http://sccc.org.au/wp-content/uploads/2014/06/Strawberry-cut-up-for-testing.jpg
Conclusion
Did radiation isotope contamination cause these plant mutations?
There is not enough evidence gained from either of the mutated banana or strawberry tests to conclude definitively that the radioactive isotope contamination was the cause of these plant mutations. More sensitive equipment or other methods of testing, would be needed to definitively identify the isotope contamination.
These are the first two plant mutations I have been provided with for testing here in Australia. Besides man made radioactive isotope contamination, plant mutations can also be created by ultraviolet radiation, chemical, hormonal, genetic, bacterial, fungal, and viral causes etc.
Disclaimer: This is an amateur volunteer run service. Human error can provide incorrect information, and equipment malfunction can produce false readings. Do not rely on, or take action upon information presented here, without further research.
Simi Valley, CA – 10 MIN AVG overcast sky
6:10a INT 47.1 CPM
6:20a EXT 47.8 CPM
2014/06/14
Simi Valley, CA – 10 MIN AVG clear sky
6:50a INT 52.9 CPM
7:00a EXT 52.7 CPM
Simi Valley, CA – 10 MIN AVG overcast sky
6:15a INT 44.9 CPM
6:25a EXT 55.0 CPM
[Editor: Exterior reading 22.5% higher than interior]
@Chase Here are years of locally recorded background levels from the Sunshine Coast Australia.
Location
http://sccc.org.au/monitoring/Australian-Map.jpg
The 2012 to 2014 chart data is from a GammaScout Alert Geiger counter sampling every 60 seconds.
Monthly average 2014
http://sccc.org.au/wp-content/uploads/2014/02/Caloundra-monthly-average-background-radiation-levels-for-2014.jpg
Monthly average 2013
http://sccc.org.au/wp-content/uploads/2013/02/Caloundra-monthly-average-background-radiation-levels-for-2013.jpg
Monthly average 2012
http://sccc.org.au/wp-content/uploads/2012/09/Caloundra-monthly-average-background-radiation-levels-for-2012.jpg
Year average 2007 to 2011
The 2007 to 2011 chart data was recorded by GammaScout Alert Geiger counter sampling once a week. (This is the sampling factory setting when it arrives in the post.) The four year recorded per Fukushima average works out at ~0.10 uSv/hr.
http://sccc.org.au/wp-content/uploads/2012/04/Caloundra-local-average-background-radiation-levels-2007-to-2011.jpg
It would be interesting to see a graph or chart that shows the readings over a 3 year period.
The readings taken by everyone over the last three years may someday, someday soon, mark what used to be considered normal backgrounds.
As the initial fallout from Fukushima’s Nuclear Plant explosions and triple core meltdowns continue to circle the globe it should also be noted that the atmosphere is and has been receiving constant ‘daily’ emissions from Fukushima.
So, it seems to me that at some point there will be a ‘new’ normal background.
What will new backgrounds be in 3 years, 6 or 12 years based on what we know now if there is a slight but steady overall increase.
IMO – Based on my general observations of multiple sources the data seems to suggest an increase overall. Please correct me if I’m wrong.
>>
The farthest ever photo of Earth.
The Pale Blue Dot is a photograph of planet Earth taken in 1990 by the Voyager 1 space probe from a record distance of about 3.7 billion miles from Earth.
If you were born prior to the summer of 1990, YOU are in this picture.
(historic photo, spring 1990)
(the little white spot)
http://en.wikipedia.org/wiki/File:Pale_Blue_Dot.png
http://en.wikipedia.org/wiki/Pale_Blue_Dot#Reflections_by_Sagan
“From this distant vantage point, the Earth might not seem of any particular interest. But for us, it’s different. Consider again that dot. That’s here. That’s home. That’s us. On it everyone you love, everyone you know, everyone you ever heard of, every human being who ever was…”
– Carl Sagan
Simi Valley, CA – 10 MIN AVG overcast sky
7:20a INT 44.4 CPM
7:30a EXT 52.1 CPM
Simi Valley, CA – 10 MIN AVG overcast sky
6:10a INT 47.8 CPM
6:20a EXT 55.1 CPM
Simi Valley, CA – 10 MIN AVG clear sky
6:15a INT 43.9 CPM
6:25a EXT 49.3 CPM
Simi Valley, CA – 10 MIN AVG clear sky
6:10a INT 44.3 CPM
6:20a EXT 51.2 CPM
Simi Valley, CA – 10 MIN AVG overcast sky
6:25a INT 44.6 CPM
6:35a EXT 55.6 CPM
[Editor: Exterior reading 24.7% higher than interior reading]
Extract:
Our Live Outdoor Radiation Monitor is showing a several hour long ramping spike in airborne radiation levels. The spike appears to be tied to a shift in wind direction, surface winds are blowing in from the East. Based on wind direction, the suspect source of this spike is the underground nuclear fire at Bridgeton’s Westlake Landfill (EPA Superfund site).
http://pissinontheroses.blogspot.com.au/
[Editor: See EPA RadNet St. Louis beta & gamma readings]
Simi Valley, CA – 10 MIN AVG partial overcast sky
6:10a INT 43.5 CPM
6:20a EXT 54.9 CPM
[Editor: Exterior is 26.2% over interior background]
Australia,
Queensland,
Sunshine Coast,
Southern Hemisphere May 2014 rain water test report.
Technical details:
Monitoring Station Location
http://sccc.org.au/monitoring/Australian-Map.jpg
This short animation of Northern, and Southern Hemisphere air circulation, shows why we can get detections so far south.
May 2014 had 145.6 mm of rain.
The test chart shows the presents of mainly Pb-210 and Beryllium Be-7.
In this chart I have CPS on the Y axis to show activity, and have turned off Y axis log to show linear scaling.
Test Chart
http://sccc.org.au/wp-content/uploads/2014/06/Down-pipe-Caloundra-May-filter-test-030614-TV62-22c-84742.jpg
Simi Valley, CA – 10 MIN AVG clear sky
6:05a INT 48.6 CPM
6:15a EXT 51.3 CPM
Simi Valley, CA – 10 MIN AVG clear sky
6:00a INT 52.1 CPM
6:10a EXT 51.0 CPM
Australia,
Queensland,
Sunshine Coast,
May 2014 Southern Hemisphere Background Radiation Report
Summary:
May 2014 was 13% above the pre-Fukushima average. May 2013 was 7% above, and May 2012 was 7% above the pre-Fukushima ~0.10 uSv/hr month average.
In the colder months I see a drop in background here, as most of the prevailing winds are from the Southern Ocean. May 2014 saw a 6% increase above May 2012 and 2013 month average background radiation levels. If you look at the May 2014 day average chart you will see more day to day dynamic swings in the day averages background radiation levels compared to 2012 and 2013.
Technical details:
Monitoring Station Location
http://sccc.org.au/monitoring/Australian-Map.jpg
This short animation of Northern, and Southern Hemisphere air circulation, shows why we can get detections so far south.
http://www.youtube.com/watch?v=qh011eAYjAA
(The 4 year average (4yr) referred to in these reports, is the recorded pre-Fukushima local background four year average of ~0.10uSv/hr.)
May 2014 was 13% above the 4 year pre-Fukushima May average.
http://sccc.org.au/wp-content/uploads/2014/05/Caloundra-local-average-background-radiation-levels-May-2014.jpg
2014 month average chart.
http://sccc.org.au/wp-content/uploads/2014/02/Caloundra-monthly-average-background-radiation-levels-for-2014.jpg
Continued
May 2013 was 7% above the pre-Fukushima month average.
http://sccc.org.au/wp-content/uploads/2013/05/Caloundra-local-average-background-radiation-levels-May-2013.jpg
May 2012 was 7% above the pre-Fukushima month average.
http://sccc.org.au/wp-content/uploads/2012/06/Caloundra-local-average-background-radiation-levels-May-2012.jpg
@Tray: Because this fee-based service doesn’t allow non-payers to look at their charts, I can’t speak to the accuracy of NETC but I do know that any entity right now with “levels showing in many states show an evacuation-level cpm count (including Los Angeles)” is not accurate. I also am personally not engaged by websites asking for a healthy chunk of change to sell cheap Geiger counters that have Bible quotes that actually warn against “knowledge,” of all things. Better to look at the EPA’s RadNet Air Monitoring which, unfortunately, has just 44 out of 124 beta graphs working as of today. Places that give us concern, based on today’s and recent readings, are Tuscon AZ, Anaheim CA, Riverside CA, Augusta GA, Fort Wayne IN, St. Louis MO, Lincoln NE, Albuquerque NM, Syracuse NY, Charlotte NC, Raleigh NC, Corvallis OR, Pittsburgh PA, all of Texas, and Madison WI.
Simi Valley, CA – 10 MIN AVG clear sky
6:00a INT 49.5 CPM
6:10a EXT 50.6 CPM
Hey Michael,
What do you make of the cpm levels around the country from the Nuclear Emergency Tracking Center website (NETC)?
Is their website innacurate/bogus? The levels showing in many states show an evacuation-level cpm count (including Los Angeles).
Well done, raddies!
Simi Valley, CA – 10 MIN AVG clear sky
7:45a INT 48.7 CPM
7:55a EXT 50.0 CPM
I got it on your RadNet section. Thank YOU!
Does anyone know the rad count for the Northeastern Region? I live in New Jersey and can’t afford a Geiger Counter. Thank You!
Recent Australian and New Zealand elevated detections.
Sydney 26th May 2014 – I woke up with the alarm on (I set my Geiger alarm at 0.30uSv). Averages today are around 0.22uSv. Measurement confirmed by the second counter.
Dunedin New Zealand 25th May 2014 – Background here has increased to 0.19 micros per hour – a new high over the average of about 0.17 …. and the ionisation chamber has shot up to 1.7 picoCuries per litre – where the running average is 1.0 picoCuries per litre over winter … spikey …
Baldivis near Perth, Monitoring Station (Western Australia) 25th May 2014 – Chart shows an increase from around the beginning of April 2014, when the rains started…
http://www.lamble.net/weather/radiationyear2-2014.php
North Island New Zealand 24th May 2014 – Kapiti Gaigakaunta radiation monitoring station detected two brief increases in background levels, as a weather event passed through the area.
Screen Shot.
http://sccc.org.au/wp-content/uploads/2014/05/Kapiti-gaigakaunta-station-New-Zealand-elevated-background-240514.jpg
Kapiti Gaigakaunta
http://zl2tod.net/gaigakaunta/?story=19
Simi Valley, CA – 10 MIN AVG clear sky
8:35a EXT 51.6 CPM
8:45a INT 45.6 CPM
Just when one may think that the N Atlantic around the UK/Norway/Scotland etc would be safe to eat the seafood there as its far from the Pacific/Gulf Coast etc, just watch this documentary below… Must watch!
http://www.youtube.com/watch?v=oUYJFlObhtA
OK… We are back in business. Still had problem until I deleted cookies.
Simi Valley, CA – 10 MIN AVG clear sky
6:05a INT 52.0 CPM
6:15a EXT 54.4 CPM
Simi Valley, CA – 10 MIN AVG mostly clear sky, some high clouds
6:10a INT 50.1 CPM
6:20a EXT 50.2 CPM
Simi Valley, CA – 10 MIN AVG clear sky
6:05a INT 48.6 CPM
6:15a EXT 54.7 CPM
Heads up.
There was some kind of event last night at Fukushima Daiichi.
I’ve been cam watching for a long time and this is a strange one.
It is the orange of fire, but it moves quickly over a large area.
It does appear to start, from this perspective, on the upper corner of R4 and then moves over the R3 area.
Fukuichi live
2014.05.20 20:00-21:00
@20:24 jst
( Shortly after 1:10 on the video. )
This video is at 20x speed.
Tokyo airport is reporting high readings on multiple rad detection networks.
Simi Valley, CA – 10 MIN AVG partly overcast sky
6:05a INT 47.4 CPM
6:15a EXT 50.1 CPM
May 19, 2014
3:11pm INT HEPA DUST from two HEPA filters and one Ionizer/HEPA filter: 65.0 CPM which is 48.4% HIGHER than background over a 25 day period. This is lower than previous period that ended April 25, 2014. Los Angeles RadNet beta station still not functioning.
2:57pm INT BG: 43.8 CPM
Simi Valley, CA – 10 MIN AVG overcast sky
6:05a INT 48.9 CPM
6:15a EXT 51.9 CPM
East Los Angeles checks in with 10 minute average ambient.
External 50 cpm +/- 10%
Internal 46 cpm +/- 10%
External 1 hour ambient dose
13 microrems per hour (uR/h) +/-10%
All normal readings on the east side
Hector
WB Johnson GSM-500
HP-265 (cpm)
GP-1001 (dose)
Calibrated April 24, 2014
Hi Michael – Glad to be back. I’m unsure what capacity I’ll have over the next couple of months but will post as much as possible.
Since there was a break in my readings, I averaged all daily exterior readings I had for Jan & Dec and that came out to be 51 CPM so yesterday’s reading was a bit higher. I’m unsure if it has to do with Runkle Canyon but could very well be. Today’s reading was more in line with average.
Simi Valley, CA – 10 MIN AVG clear sky
9:15a EXT 50.7 CPM
9:25a INT 48.6 CPM
16th May 2014 – Right Sector attempts to seize largest NPP in Ukraine
Extract:
Policemen of the city of Energodar have detained 20 activists of the Right Sector, who tried to seize the Zaporozhye NPP.
Comment: The Ukraine Zaporizhia NPP has six reactors!
Article:
http://voiceofrussia.com/news/2014_05_16/Right-Sector-attempts-to-seize-largest-NPP-in-Ukraine-1602/
2014/05/19
Simi Valley, CA – 10 MIN AVG clear sky
6:25a INT 44.2 CPM
6:35a EXT 56.2 CPM
Australia
Queensland
Sunshine Coast
April 2014 rain water test report
Summary:
This filter had a lot of green algae growing in it by the time I tested it. The chart is minus background, and is using CPS for the y axis. Testing time was 24 hours. As you can see, there are clear peak markers for Beryllium Be-7, and a combination peak of Iodine I-129 and Lead Pb-210.
There was more Be-7, I-129 and Pb-210 detected in April’s test compared to March 2014. Interestingly, March had more rain, 204mm compared to April’s 171 mm. This suggests there was a lot more Be-7, Pb-210 and I-129 in the atmosphere here in April, compared to March 2014.
Technical Details:
Roof down pipe filter design,
http://sccc.org.au/down-pipe-filter-design
April roof down pipe filter test chart.
http://sccc.org.au/wp-content/uploads/2014/05/Down-pipe-Caloundra-April-filter-test-080514-TV62-22c-84600-B.jpg
A pre-Fukushima Argentina studying indicates that the I-129 would eventually reach the Southern Hemisphere, as it has from other major sources, like the nuclear fuel reprocessing plants of Cape de La Hague (France) and Sellafield (UK).
http://www.sciencedirect.com/science/article/pii/S0048969712006353
It has been suggested that the Japanese have been pumping large amounts of liquid Nitrogen and Boron onto the multiple molten coriums at the Fukushima Nuclear disaster. Neutron bombardment, plus lots of underground corium venting, has also been releasing large amounts Beryllium Be-7 and 1-129.
For background on this subject read this article on using Be-7 as a tracer for I-129.
http://www.sciencecodex.com/dartmouth_scientists_track_radioactive_iodine_from_japan_nuclear_reactor_meltdown-89004
Be-7 can also be produced by cosmic/solar ray spallation in the upper atmosphere. Be-7 created by this process takes around two weeks to reach sea level. The Sun has been very quite this cycle.
There is a natural Be-7 / Pb-210 cycle here in the Southern Hemisphere, which means there should be more Be-7 and Pb-210 detected in the summer months compared to winter.
Is some of this Be-7, I-129 and Pb-210 from Fukushima?
The slight peak position shift to the left of the ideal in the April 2014 chart could indicate another isotope contaminant is also present with Be-7, around the same location.
For background on this subject read this article on using Be-7 as a tracer for I-129.
http://www.sciencecodex.com/dartmouth_scientists_track_radioactive_iodine_from_japan_nuclear_reactor_meltdown-89004
Disclaimer: This is an amateur volunteer run service. Human error can provide incorrect information, and equipment malfunction can produce false readings. Do not rely on, or take action upon information presented here, without further research.
East Los Angeles mid day readings 10 minute average.
External 47 cpm-normal
External gamma 1 hour integrate 13 uR/h-normal
After various 1 hour internal and external tests we established a normal background baseline of 12-14 uR/h for the East Los Angeles area. This is good to keep in mind since a rise in gamma at this location would indicate something is going on.
Hector
WB Johnson GSM 500
HP-265 “pancake”
GP-1001 low range gamma
Australia.
Queensland,
Sunshine Coast,
April 2014 Southern Hemisphere Background Radiation Report
Summary:
April 2014 was 22% above the pre-Fukushima average. April 2012 was 10% above, and April 2013 was 13% above the pre-Fukushima average.
In the colder months I see a drop in background here, as most of the prevailing winds are from the Southern Ocean. The drop for April 2014 was less than April 2012 and 2013.
Technical details:
Monitoring Station Location
http://sccc.org.au/monitoring/Australian-Map.jpg
April 2014 was 22% above the 4 year pre-Fukushima April average.
http://sccc.org.au/wp-content/uploads/2014/04/Caloundra-local-average-background-radiation-levels-April-2014.jpg
2014 month average chart.
http://sccc.org.au/wp-content/uploads/2014/02/Caloundra-monthly-average-background-radiation-levels-for-2014.jpg
April 2013 was 9% above the pre-Fukushima month average.
http://sccc.org.au/wp-content/uploads/2013/02/Caloundra-monthly-average-background-radiation-levels-for-2013.jpg
April 2012 was 12% above the pre-Fukushima month average.
http://sccc.org.au/wp-content/uploads/2012/09/Caloundra-monthly-average-background-radiation-levels-for-2012.jpg
East Los Angeles checks in with a very hot day.
10 minute average
external 49 CPM-normal
internal 46 CPM-normal
External 12uR/h(microrems) for a 1 hour timed test for gamma.
at 1:27pm.
Hector
Wb Johnston GSM 500-
HP-265
GP-1001
Leaving men, women and children living in highly radioactive contaminated areas is criminal. The Japanese officials responsible for this policy should go to jail! This is mass murder!
Hot particles photographed on slippers of kindergarten children Namie Town Ohori district 121,497 bq / kg (Cs134 +137), 4,000 cpm.
In the commodities of sampling so far, this slipper 1,500 cpm is one of those shown the strongest pollution.
https://www.facebook.com/photo.php?fbid=10152415656148245&set=a.10152072932043245.1073741839.619858244&type=1&theater
Fukushima citizen “Everybody is having cancer, cancer and cancer.. what is going on ? I’m afraid it is that…”
http://fukushima-diary.com/2014/04/fukushima-citizen-everybody-is-having-cancer-cancer-and-cancer-what-is-going-on-im-afraid-it-is-that/
Hello Hector! This is terrific news! Your work in a crucial part of this massive metropolis is outstanding. Radiation Station East Los Angeles gets many views every day. You are a shining example of what a smart and dutiful person can do to help us all know just how hot, or not, it is in the City of Angels.
I was delighted to visit recently with Dr Solar of Radiation Station Glendale California who is an OR – Original Raddie. We had the time of our lives regaling each other. Dr Solar is also known as Dale Ramicone who was so thoughtful and insightful in our recent expose Fukushima – The Perfect Crime?
EnviroReporter.com‘s nine Radiation Stations in the USA and Australia have completed over 1,936 tests & reports as of April 26, 2014. Radiation Station Santa Monica California has performed and created over 3,668 tests & reports, including our Eat Me testing, as of the yesterday bringing this websites grand total of tests and radiation reports to 5,604 since March 15, 2011, four days after the triple meltdowns began. That doesn’t even include the hundreds of tests of food, water and other important media at our Radiation Food Lab run by Peter Daley of Radiation Station Sunshine Coast Australia.
Denise Anne, aka Lady Fingers, and I, aka Man Hands, are blessed to be able to work with such fine folks as Hector, Dale and Peter. The world would be a much better and more informed place regarding radiation levels if it had more individuals of such solid character. And so are you. That’s perhaps why over three million people have visited our site and Radiation Stations since the Fukushima mega-disaster began. It’s hot news, real hot news.
Hello fellow reporters. We will be back soon reporting levels from the east side of los angeles. We are awaiting our johnston gsm 500 survey meter to return from a fresh calibration. We also added an energy compensated probe in order to give more accurate ambient dose readings from a range of 5 uR/h up to 200 mR/r this would apply to gamma only.we will also report in counts per minute (CPM)with the sesnitive pancake probe. Stay tuned for count readings from the east side of town.
8 miles east of downtown los angeles
Hector
wb johnston gsm 500
Johnston hp-265
Johnson gp-1001
Very radioactive hot particles found in Japanese home vacuum cleaner dust, long distances from the Fukushima Nuclear disaster site, up to 450 km away in fact.
Extracts:
Results: The median total activity of eighty four Japanese bulk house dust samples studied was 2.5 KBq/ kg.
Conclusion: Radioactively-hot particles of the respirable size range were routinely detected, with one as far as 460 km from the re lease site.
http://bostonchemicaldata.com/wpi/mKaltofenNagoya2014.pdf
Video
April 25, 2014
4:40pm INT HEPA DUST from two HEPA filters and one Ionizer/HEPA filter: 97.4^^ CPM^^ which is 116% HIGHER than background over a 44 day period. This is lower than previous period that ended March 12, 2014. US EPA RadNet Los Angeles beta monitor has ground to a halt providing accurate data. The second largest metropolitan in the United States is flying beta blind to the man-made radionuclides spewing into the Pacific from Fukushima then made airborne in choppy seas to become clouds then rain. All heading towards the West Coast including Los Angeles. RadNet stations in San Bernadino and Riverside are operating, thankfully, and show high beta readings but nothing like places like Amarillo Texas. Radiation Station Santa Monica down temporarily for routine maintenance.
4:25pm INT BG: 45.1 CPM^^
Australia
Queensland
Sunshine Coast
March 2014 rain water test report,
Summary:
It was a fairly wet month with 204mm of rain, so a fair bit of rain water flowed through the filter. The main isotopes detected were Iodine I-129, Lead Pb-210, and Beryllium Be-7, with possible traces of Uranium U-235?. There was more rain in March 204mm, but less detectable traces of isotopes than February. In February we had 37mm rain. This chart is using a new background, recorded on the 21st March 2014.
Monitoring Station Location
http://sccc.org.au/monitoring/Australian-Map.jpg
This short animation of Northern, and Southern Hemisphere air circulation, shows why we can get detections so far south.
Test Chart
http://sccc.org.au/wp-content/uploads/2014/04/Down-pipe-Caloundra-March-filter-test-020414-TV62-26c-85254-+-test.jpg
Disclaimer: This is an amateur volunteer run service. Human error can provide incorrect information, and equipment malfunction can produce false readings. Do not rely on, or take action upon information presented here, without further research.
Hemet, CA 10 min exterior: 41.9 cpm
Radiation Station East, Glendale, CA: 3:30 PM rain sample 54.5 CPM vs 41.5 CPM background, 10 minute averages. That is 31% over background.
Rain was falling heavily, during a thunderstorm, lightning occurring less than 1/2 mile away.
This 31% figure over background level indicates some excess radiation was present.
April 1, 2014
10:20am RAIN SAMPLE: 41.9 CPM^^ meaning background. Again see that there is no evidence, per usual, of any radon progeny impacting our readings. No readings performed at this site have been or will be affected by radon daughters.
10:10am INT RADIATION STATION SANTA MONICA BACKGROUND: 43.2 CPM^^
Australia,
Queensland,
Sunshine coast,
March 2014 Southern Hemisphere background Radiation Report
Monitoring Station Location
http://sccc.org.au/monitoring/Australian-Map.jpg
This short animation of Northern, and Southern Hemisphere air circulation, shows why we can get detections so far south.
Summary:
The extensive local recorded data shows that the background radiation level increases have stabilized. March had a 1% decrease in average background compared to 2013. This was still 7% above the March 2012 average, and 31% above pre-Fukushima levels.
An unusual rain event around the 26th of March caused a drop in radiation for a couple of days. This was surprising. After investigation, I found the event was caused by Southern low pressure system. You can see this Southern low around 1.40 seconds into this “Three Minute News” Youtube video. We had a significant spike in background on a dry 29th and 30th of March, when the air flow started to come from the tropics again.
Technical details:
What do the colour alert codes in the charts mean?
http://sccc.org.au/what-does-each-step-in-the-alert-level-colour-code-mean
March 2014 was 31% above the 4 year pre-Fukushima March average.
http://sccc.org.au/wp-content/uploads/2014/03/Caloundra-local-average-background-radiation-levels-March-2014.jpg
March 2013 was 32% above the pre-Fukushima average.
http://sccc.org.au/wp-content/uploads/2013/03/Caloundra-local-average-background-radiation-levels-March-2013.jpg
March 2012 was 24% above the pre-Fukushima average.
http://sccc.org.au/wp-content/uploads/2012/04/Caloundra-local-average-background-radiation-levels-March-2012.jpg
Disclaimer: This is an amateur volunteer run service. Human error can provide incorrect information, and equipment malfunction can produce false readings. Do not rely on, or take action upon information presented here, without further research.
Rain in Hemet, CA came out as roughly background: 49.2
Three Mile Island Health Effects.
Great presentation, the truth of what actually happened is presented clearly for everyone to understand. This presentation exposes the Government and industry lies.
Governments and industry are using the same evil playbook of lies and deceit, for the Fukushima Nuclear Disaster.
March 12, 2014
9:00pm INT HEPA DUST from two HEPA filters and one Ionizer/HEPA filter: 124.9 CPM^^ which is 184.5% HIGHER than background over a 57 day period. This is 1.6 times HIGHER per day than previous period that ended Jan. 12, 2014. Also note that RadNet’s Los Angeles beta monitor has stopped reporting results and looks abandoned.
8:40pm INT BG: 43.9 CPM^^
76 Activists breach French nuclear plant
Tuesday March 18, 2014
If these people had been terrorists or psychopaths they could have easily taken that plant down and most of Europe with it.
“[detained] 56 activists, he said, but 20 remained on top of the dome.” (at that time)
http://www.skynews.com.au/world/article.aspx?id=959316
Nuclear is NOT safe.
76 people, that’s like a small army.
They called them ‘activists’ and not fear mongering anti-nukers.
“The war that had to be lost to be won.” 😉
(Reminds me of the play “The Mouse That Roared”.)
“If being physically able to touch the reactors is not being in a sensitive place, I don’t know what is,” Rousselet told Reuters. “People with bad intentions could have posed a threat to the reactor’s safety.”
– NBC News
http://www.nbcnews.com/news/world/security-probe-launched-after-activists-break-french-nuclear-power-plant-v19483872
ALERT! New Mexico Emergency Officials Admit WIPP Radioactive Exhaust Bypassed HEPA Filter System
http://pissinontheroses.blogspot.com/2014/03/alert-new-mexcio-emergency-officials.html
Spike in background Caloundra Australia 17th March 2014
Had a significant local background increase here on the 17th March. Background day average went to yellow alert level, at 43% above average. This was mainly a free air detection increase. Except for a very light late evening shower that lasted a minute or two, it was fine and hot the rest of the day.
During yellow alert levels or higher, we suggest staying out of the rain.
http://sccc.org.au/what-does-each-step-in-the-alert-level-colour-code-mean
Day average chart,
http://sccc.org.au/wp-content/uploads/2014/03/Caloundra-local-average-background-radiation-levels-March-2014.jpg
North Island New Zealand 17th March 2014 – Kapiti Gaigakaunta radiation monitoring station detected a brief increase in background levels as a weather event passed through the area. Screen Shot.
http://sccc.org.au/wp-content/uploads/2014/03/North-Island-NZ-Gaigakaunta-170314.jpg
North Island Kapiti Gaigakaunta radiation monitoring station link
http://zl2tod.net/gaigakaunta/?story=19