« 1 2 3 4 5 6 7 8 9 10 11 12 13 14 15 16 17 18 19 20 21 22 23 24 25 26 27 28 29 30 31 32 33 34 35 36 37 38 39 40 41 42 43 44View All»
ACTIVE
Peter Daley
Handle: vital1
Gammascout Alert detecting in microsieverts per hour (uSv/hr)
Radiation testing streaming 24/7 plus over 10,000 special radiation tests and original in-depth reports as well as thousands of items tested in Radiation Food Lab.
[CLINK LINKS FOR DIRECT ACCESS & NEWEST TO OLDEST DATA DESCENDING PAGE]
 Monitoring Station: http://sccc.org.au/archives/2630
Food Lab
http://sccc.org.au/archives/2861
DATA
Southern Hemisphere November 2020 Background Level Report
Station location.
http://sccc.org.au/monitoring/Australian-Map.jpg
This short animation of Northern and Southern Hemisphere air circulation shows why we can get detections so far south.
http://www.youtube.com/watch?v=qh011eAYjAA
November 2020 day average background chart. (Month Average 109 cpm)
November did not see as many ups and downs in local background as October, it was a much dryer month, with fewer storms.
November 2020 Background Level Chart
Disclaimer: This is an amateur volunteer run service. Human error can provide incorrect information, and equipment malfunction can produce false readings. Do not rely on, or take action upon information presented on this web site, without further research.
Southern Hemisphere October 2020 Background Level Report
Station location.
http://sccc.org.au/monitoring/Australian-Map.jpg
This short animation of Northern and Southern Hemisphere air circulation shows why we can get detections so far south.
October 2020 day average background chart. (Month Average 109 cpm)
October saw rather volatile swings in local background levels. This is our storm season, and when storms pass through during this time of the year, local area radon levels tend to increase. These radon increases occur when we get northern tropical air flows off the Pacific Ocean. I have set up a local live Radon detector, and I can see all this happening in real time, as the storms pass through the area.
October 2020 Background Level Chart
https://sccc.org.au/wp-content/uploads/2020/10/Caloundra-local-average-background-radiation-levels-October-2020.jpg
A page has been set up on the Sunshine Coast Computer Club Inc., web site so members can view the local live radiation monitoring station information. This local live radiation monitoring station is publicly available.
https://sccc.org.au/monitoring/sunshinecoast-monitoring-station.html
Disclaimer: This is an amateur volunteer run service. Human error can provide incorrect information, and equipment malfunction can produce false readings. Do not rely on, or take action upon information presented on this web site, without further research.
Southern Hemisphere September 2020 Background Level Report
Station location.
http://sccc.org.au/monitoring/Australian-Map.jpg
This short animation of Northern and Southern Hemisphere air circulation, shows why we can get detections so far south.
Local background has been stable here, nothing significant to report.
September 2020 day average background chart. (Month Average 107 cpm)
https://sccc.org.au/wp-content/uploads/2020/09/Caloundra-local-average-background-radiation-levels-September-2020.jpg
Disclaimer: This is an amateur volunteer run service. Human error can provide incorrect information, and equipment malfunction can produce false readings. Do not rely on, or take action upon information presented on this web site, without further research.
Southern Hemisphere August 2020 Background Level Report
Station location.
http://sccc.org.au/monitoring/Australian-Map.jpg
This short animation of Northern and Southern Hemisphere air circulation, shows why we can get detections so far south.
http://www.youtube.com/watch?v=qh011eAYjAA
August 2020 day average background chart. (Month Average 107 cpm)
All is stable here. The background radiation levels for August was within season norms.
Disclaimer: This is an amateur volunteer run service. Human error can provide incorrect information, and equipment malfunction can produce false readings. Do not rely on, or take action upon information presented on this web site, without further research.
Southern Hemisphere July 2020 Background Level Report
Station location
http://sccc.org.au/monitoring/Australian-Map.jpg
This short animation of Northern and Southern Hemisphere air circulation, shows why we can get detections so far south.
http://www.youtube.com/watch?v=qh011eAYjAA
July 2020 day average background chart. (Month Average 107 cpm)
All is stable here. The background radiation levels for July are within season norms.
Disclaimer: This is an amateur volunteer run service. Human error can provide incorrect information, and equipment malfunction can produce false readings. Do not rely on, or take action upon information presented on this web site, without further research.
Southern Hemisphere June 2020 Background Level Report
Station location
http://sccc.org.au/monitoring/Australian-Map.jpg
This short animation of Northern and Southern Hemisphere air circulation, shows why we can get detections so far south.
http://www.youtube.com/watch?v=qh011eAYjAA
June 2020 day average background chart. (Month Average 107 cpm)
June average monthly background levels here are showing the usual seasonal variation. We see background levels drop here at this location in the southern hemisphere, during the winter months. The reason for this is that more seasonal winds start coming from the southern ocean air circulation, rather than from the tropics.
Disclaimer: This is an amateur volunteer run service. Human error can provide incorrect information, and equipment malfunction can produce false readings. Do not rely on, or take action upon information presented on this web site, without further research.
Southern Hemisphere May 2020 Background Level Report
Station location
http://sccc.org.au/monitoring/Australian-Map.jpg
This short animation of Northern and Southern Hemisphere air circulation, shows why we can get detections so far south.
http://www.youtube.com/watch?v=qh011eAYjAA
May 2020 day average background chart. (Month Average 108 cpm)
Local background radiation levels for May have been stable.
Disclaimer: This is an amateur volunteer run service. Human error can provide incorrect information, and equipment malfunction can produce false readings. Do not rely on, or take action upon information presented on this web site, without further research.
Southern Hemisphere April 2020 Background Level Report
Station location
http://sccc.org.au/monitoring/Australian-Map.jpg
This short animation of Northern and Southern Hemisphere air circulation, shows why we can get detections so far south.
http://www.youtube.com/watch?v=qh011eAYjAA
April 2020 day average background chart
(Month Average 109 cpm)
Local background radiation levels for April were stable, with nothing significant to report.
Disclaimer: This is an amateur volunteer run service. Human error can provide incorrect information, and equipment malfunction can produce false readings. Do not rely on, or take action upon information presented on this web site, without further research.
Southern Hemisphere February & March 2020 Background Level Reports
Station location
http://sccc.org.au/monitoring/Australian-Map.jpg
This short animation of Northern and Southern Hemisphere air circulation, shows why we can get detections so far south.
http://www.youtube.com/watch?v=qh011eAYjAA
March 2020 day average background chart. (Month Average 108 cpm)
Local background radiation levels for March were stable.
February 2020 day average background chart. (Month Average 109 cpm)
Local background radiation levels for February were stable.
Disclaimer: This is an amateur volunteer run service. Human error can provide incorrect information, and equipment malfunction can produce false readings. Do not rely on, or take action upon information presented on this web site, without further research.
Southern Hemisphere January 2020 Background Level Report
Station location
http://sccc.org.au/monitoring/Australian-Map.jpg
This short animation of Northern and Southern Hemisphere air circulation, shows why we can get detections so far south.
January 2020 day average background chart. (Month Average 110 cpm)
At this location radiation levels have been very stable, compared to the wild swings detected just after 3/11.
http://sccc.org.au/wp-content/uploads/2020/01/Caloundra-local-average-background-radiation-levels-January-2020.jpg
Disclaimer: This is an amateur volunteer run service. Human error can provide incorrect information, and equipment malfunction can produce false readings. Do not rely on, or take action upon information presented on this web site, without further research.
BEGINNING 2020
END 2019
Southern Hemisphere November 2019 Background Level Report
Station location
http://sccc.org.au/monitoring/Australian-Map.jpg
This short animation of Northern and Southern Hemisphere air circulation, shows why we can get detections so far south.
November 2019 day average background chart. (Month Average 110 cpm)
In the warmer months more tropical air flows to this location compared to the colder months. This November, our spring, we saw a small increase in local background levels compared to the winter months. Spring and summer up ticks in local background have become the new normal here since Fukushima. For comparison, this July’s month average was 107 CPM.
http://sccc.org.au/wp-content/uploads/2019/11/Caloundra-local-average-background-radiation-levels-November-2019.jpg
Disclaimer: This is an amateur volunteer run service. Human error can provide incorrect information, and equipment malfunction can produce false readings. Do not rely on, or take action upon information presented on this web site, without further research.
Southern Hemisphere September 2019 Background Level Report
Station location
http://sccc.org.au/monitoring/Australian-Map.jpg
This short animation of Northern and Southern Hemisphere air circulation, shows why we can get detections so far south.
September 2019 day average background chart. (Month Average 110 cpm)
There has been a slight increase in month average background level for September. This seasonal variation in local background levels has become a normal trend here since Fukushima. As we get more tropical air flows at this location in the warmer months, the local background increases, and then drops back down again in winter.
Disclaimer: This is an amateur volunteer run service. Human error can provide incorrect information, and equipment malfunction can produce false readings. Do not rely on, or take action upon information presented on this web site, without further research.
Southern Hemisphere August 2019 Background Level Report
Station location
http://sccc.org.au/monitoring/Australian-Map.jpg
This short animation of Northern and Southern Hemisphere air circulation, shows why we can get detections so far south.
August 2019 day average background chart. (Month Average 108 cpm)
The last few months have been relatively quiet, with relatively low background levels. This has been the historical norm for the cooler winter months here.
Disclaimer: This is an amateur volunteer run service. Human error can provide incorrect information, and equipment malfunction can produce false readings. Do not rely on, or take action upon information presented on this web site, without further research.
Southern Hemisphere July 2019 Background Level Report
Station location
http://sccc.org.au/monitoring/Australian-Map.jpg
This short animation of Northern and Southern Hemisphere air circulation, shows why we can get detections so far south.
July 2019 day average background chart. (Month Average 107 cpm)
July background was slightly lower than June.
Disclaimer: This is an amateur volunteer run service. Human error can provide incorrect information, and equipment malfunction can produce false readings. Do not rely on, or take action upon information presented on this web site, without further research.
Southern Hemisphere June 2019 Background Level Report
Station location
http://sccc.org.au/monitoring/Australian-Map.jpg
This short animation of Northern and Southern Hemisphere air circulation, shows why we can get detections so far south.
June 2019 day average background chart. (Month Average 108 cpm)
Local background levels have been relatively calm over the last few months, nothing significant to report.
Disclaimer: This is an amateur volunteer run service. Human error can provide incorrect information, and equipment malfunction can produce false readings. Do not rely on, or take action upon information presented on this web site, without further research.
Southern Hemisphere May 2019 Background Level Report
Station location
http://sccc.org.au/monitoring/Australian-Map.jpg
This short animation of Northern and Southern Hemisphere air circulation, shows why we can get detections so far south.
May 2019 day average background chart. (Month Average 108 cpm)
Disclaimer: This is an amateur volunteer run service. Human error can provide incorrect information, and equipment malfunction can produce false readings. Do not rely on, or take action upon information presented on this web site, without further research.
Southern Hemisphere April 2019 Background Level Report
Station location
http://sccc.org.au/monitoring/Australian-Map.jpg
This short animation of Northern and Southern Hemisphere air circulation, shows why we can get detections so far south.
April 2019 Report. (Month Average 108 cpm)
As we move into the cooler months here in the Southern hemisphere, the month average background levels decrease. This seasonal variation in background happens every year as we get more southern ocean air flows in the cooler months. In the warmer months we get more tropical air flows.
April 2019 day average background chart.
Disclaimer: This is an amateur volunteer run service. Human error can provide incorrect information, and equipment malfunction can produce false readings. Do not rely on, or take action upon information presented on this web site, without further research.
Southern Hemisphere February & March 2019 Background Radiation Level Report
Station location
http://sccc.org.au/monitoring/Australian-Map.jpg
This short animation of Northern and Southern Hemisphere air circulation, shows why we can get detections so far south.
March 2019 Report.
We finally received around 300mm of rain in March, decent rain after an exceptionally dry period.
Towards the latter part of March, around when the rain started, a number of very short detection spikes showed up in the 24 hour charts.
Below are examples of a couple of the larger spike detections.
It is normal to occasionally get background spikes, three times background or less. These detections were less than three times background, so are probably not anything to be concerned about.
http://sccc.org.au/wp-content/uploads/2019/03/Caloundra-24-hour-chart-180319.jpg
http://sccc.org.au/wp-content/uploads/2019/04/Caloundra-24-hour-chart-310319.jpg
March 2019 day average background chart.
February 2019 Report.
February was exceptionally dry. February is usually one of our wettest months here.
February 2019 day average background chart.
Disclaimer: This is an amateur volunteer run service. Human error can provide incorrect information, and equipment malfunction can produce false readings. Do not rely on, or take action upon information presented on this web site, without further research.
Southern Hemisphere January 2019 Background Level Report
Station location
http://sccc.org.au/monitoring/Australian-Map.jpg
This short animation of Northern and Southern Hemisphere air circulation, shows why we can get detections so far south.
Note: As of 2019, day local background average will now be charted in Counts Per Minute (CPM), not uSv/hr. The new monitoring equipment now being used is a SBT-10 pancake probe, it generally averages 110 CPM. This is around ten times greater CPM sensitivity than the old GammaScout Geiger counter that was previously used for background monitoring here.
January 2019 Report.
It was a hot, dry, and sometimes humid January here. We generally get significant rain in January, and January is usually the start of our wet season. This January ended up being the driest on record, with an insignificant 0.4mm of rainfall. There are no radiation events to report, all calm and stable.
January 2019 day average background chart.
Disclaimer: This is an amateur volunteer run service. Human error can provide incorrect information, and equipment malfunction can produce false readings. Do not rely on, or take action upon information presented on this web site, without further research.
BEGINNING 2019
END 2018
Southern Hemisphere December 2018 Background Level Report
Station location
http://sccc.org.au/monitoring/Australian-Map.jpg
This short animation of Northern and Southern Hemisphere air circulation, shows why we can get detections so far south.
December 2018 day average background chart.
More short duration background radiation spikes were detected here in December. The evidence below points to a couple of possible sources.
A. Cosmic ray burst?
At times during some of these detections the planetary Kp index levels were at near zero, or at zero levels. This means at these times there were very low solar wind levels and potentially high cosmic ray activity, pointing to a possible cosmic ray source.
http://sccc.org.au/wp-content/uploads/2018/12/Planetary-K-index-14th-to-16th-Decemebr-2018.png
B. Hot particle passing by the sensor or noble gases that were undergoing decay?
The wind maps below show that during each detection the surface wind was coming off the Pacific Ocean. In each instance, upper atmosphere high pressure system air was being draw down into the low pressure systems. This points to upper atmosphere radioactive contamination, possibly being drawn down to the surface.
2nd December
Originally suggested that this December 2nd spike was from a local fire event, the most recent evidence points to other possibilities.
http://sccc.org.au/wp-content/uploads/2018/12/Caloundra-1st-to-2nd-Dec-chart-011218.jpg
Wind direction at the time. (This location on these wind maps is marked by the green dot.)
14th December
http://sccc.org.au/wp-content/uploads/2018/12/Caloundra-24-hour-chart-141218.jpg
Wind direction at the time.
16th December
http://sccc.org.au/wp-content/uploads/2018/12/Caloundra-24-hour-chart-161218.jpg
Wind direction at the time.
Disclaimer: This is an amateur volunteer run service. Human error can provide incorrect information, and equipment malfunction can produce false readings. Do not rely on, or take action upon information presented on this web site, without further research.
Southern Hemisphere November 2018 Background Level Report
Station location
http://sccc.org.au/monitoring/Australian-Map.jpg
This short animation of Northern and Southern Hemisphere air circulation, shows why we can get detections so far south.
November 2018 day average background chart. Caloundra November 2018 month average, 16% above pre-Fukushima average.
Until the unit here became unreliable in mid September 2018, the GammaScout Geiger make of Geiger counter was used for local background monitoring. It was replaced with a different make and model of detection equipment, with different tube sensitivities.
Spike in Background
The chart screen shot below is from the Caloundra Australia monitoring station, from the 1st December to the 2nd December 2018.
This significant spike in background radiation level occurred just after midnight on the 2nd December.
Note: The chart vertical axis is in nSv/hr, so divide by 1,000 to get uSv/hr. The peak is close to 0.375 uSv/hr, Which is around three times the average background for this location.
http://sccc.org.au/wp-content/uploads/2018/12/Caloundra-1st-to-2nd-Dec-chart-011218.jpg
There where major fires burning North of here at the time. This Nullschool wind map below shows the wind direction and particulate overlay at the time. The green dot on the map marks the approximate location of the detection.
Here are three possibilities that have been put forward for the source of this local spike in background.
A. Fire North of here.
B. Cosmic ray burst.
C. Hot particle passing by the sensor.
Monthly and yearly average charts from 2007 to 2018.
http://sccc.org.au/yearly-average-background-radiation-levels
Disclaimer: This is an amateur volunteer run service. Human error can provide incorrect information, and equipment malfunction can produce false readings. Do not rely on, or take action upon information presented on this web site, without further research.
Southern Hemisphere October 2018 Background Level Report
Station location
http://sccc.org.au/monitoring/Australian-Map.jpg
This short animation of Northern and Southern Hemisphere air circulation, shows why we can get detections so far south.
October 2018 day average background chart,
Caloundra October month average, year comparisons.
2018 13% above pre-Fukushima average
2017 32% above pre-Fukushima average
2016 22% above pre-Fukushima average
2015 12% above pre-Fukushima average
2014 14% above pre-Fukushima average
2013 25% above pre-Fukushima average
2012 19% above pre-Fukushima average
Monthly and yearly average charts from 2007 to 2018.
Disclaimer: This is an amateur volunteer run service. Human error can provide incorrect information, and equipment malfunction can produce false readings. Do not rely on, or take action upon information presented on this web site, without further research.
Southern Hemisphere September 2018 Background Level Report
Station location
http://sccc.org.au/monitoring/Australian-Map.jpg
This short animation of Northern and Southern Hemisphere air circulation, shows why we can get detections so far south.
http://www.youtube.com/watch?v=qh011eAYjAA
The reference monitoring station’s GammaScout Geiger counter died on the 12th September 2018, RIP. The last full day average it recorded was on the 11th September 2018. The GammaScout was used as a reference up until now, because all the data recorded here prior to Fukushima was using a GammaScout.
Will be trialling different equipment for the local monitoring station, a SBT-10 pancake, using Theremino Geiger counter software. I worked out how to transfer the logged data for this new setup into the charts I created for the GammaScout logged data. Because this is completely different monitoring equipment, the long term data reference will not be as accurate.
September’s 2018 month average is based on the 29 days of collected data.
September average background here tends to vary a lot from year to year. September marks the seasonal change from winter to spring and wind direction at this location during this seasonal change can swing wildly between tropical to southerlies. The more tropical wind we get for September, the higher the background, the more Southerly, the lower the background.
September 2018 day average background chart,
http://sccc.org.au/wp-content/uploads/2018/09/Caloundra-local-average-background-radiation-levels-September-2018.jpg
Caloundra September month average, year comparisons.
2018 14% above pre-Fukushima average
2017 27% above pre-Fukushima average
2016 12% above pre-Fukushima average
2015 5% above pre-Fukushima average
2014 6% above pre-Fukushima average
2013 15% above pre-Fukushima average
2012 13% above pre-Fukushima average
Cairns September Report – A slight increase around the middle of the month, but otherwise close to average. The Cairns monitoring station has two GammaScout Geiger counters.
http://sccc.org.au/wp-content/uploads/2018/10/Cairns-September-2018.jpg
Monthly and yearly average charts from 2007 to 2018.
http://sccc.org.au/yearly-average-background-radiation-levels
Disclaimer: This is an amateur volunteer run service. Human error can provide incorrect information, and equipment malfunction can produce false readings. Do not rely on, or take action upon information presented on this web site, without further research.
2018/09/11 at 3:51 pm
Southern Hemisphere August 2018 Background Level Report
Station location
http://sccc.org.au/monitoring/Australian-Map.jpg
This short animation of Northern and Southern Hemisphere air circulation, shows why we can get detections so far south.
http://www.youtube.com/watch?v=qh011eAYjAA
Since the Fukushima Nuclear Catastrophe, the long term August month averages are showing a gradual increase background levels.
August 2018 day average background chart,
Caloundra August month average, year comparisons.
2018 12% above pre-Fukushima average
2017 17% above pre-Fukushima average
2016 8% above pre-Fukushima average
2015 5% above pre-Fukushima average
2014 4% above pre-Fukushima average
2013 8% above pre-Fukushima average
2012 9% above pre-Fukushima average
Cairns August Report – “All pretty level, no significant peaks.” The Cairns monitoring station has two GammaScout Geiger counters.
http://sccc.org.au/wp-content/uploads/2018/09/Cairns-August-2018.jpg
Monthly and yearly average charts from 2007 to 2018.
http://sccc.org.au/yearly-average-background-radiation-levels
Disclaimer: This is an amateur volunteer run service. Human error can provide incorrect information, and equipment malfunction can produce false readings. Do not rely on, or take action upon information presented on this web site, without further research.
2018/08/04 at 6:01 pm
Southern Hemisphere Spike Detections Update, & July 2018 Southern Hemisphere Report
Station location
http://sccc.org.au/monitoring/Australian-Map.jpg
This short animation of Northern and Southern Hemisphere air circulation, shows why we can get detections so far south.
http://www.youtube.com/watch?v=qh011eAYjAA
Spike in Background Levels in Tasmania 4th and 6th July, and Caloundra on the 7th July 2018
Very surprised to find this significant detection showing up on the Caloundra 24 hour chart for the 7th of July. There had been an up tick in background at the beginning of July compared to June 2018, but the 52% above day average detection was a shock. Wind direction at the time was from inland Australia, which was also very surprising. We had a very light short shower in the morning. The live Radon monitor here showed nothing significant, levels were relatively low, around 0.2 pCi/l.
We have looked around the World wind maps to try and determine the source of these significant background spikes, but have been unable to pinpoint a definitive source. One suggestion put forward is the possible venting of volatile radioactive gases from the Lucas Heights nuclear reactor in Sydney that were blown around in the local atmosphere.
I went to the Australian Nuclear Science and Technology Organization (ANSTO), monitoring station web site. Their monitoring station is located near Lucas Heights nuclear reactor in Sydney Australia. This was to see if their monitoring station had picked up any spikes in July background radiation levels. What I found was the notice below. A strange coincidence ????
Radiation monitoring
“The environmental radiation station will not be operational in July due to repairs and maintenance of the system.”
http://www.ansto.gov.au/Resources/Localenvironment/Atmosphericmonitoring/Radiationmonitoring/index.htm
Interestingly there were reports of a breakdown at the Lucas Height nuclear reactor in late June 2018.
28th June 2018 – Breakdown at Lucas Heights nuclear reactor in Sydney sparks fears of medical supplies shortage
Extract:
The facility’s production of 10,000 doses of technetium-99m per week for Australian patients has come to a halt. The products are used in nuclear imaging and are a vital diagnostic tool used in scans for heart, lung and musculoskeletal conditions, cancer and many other medical conditions.
Engineers were not yet able to “physically attend to the conveyor” an ANSTO spokesman said, although they had been working on fixing the mechanical fault over the weekend.
http://www.abc.net.au/news/2018-06-27/lucas-heights-nuclear-reactor-breakdown-medical-supply-shortage/9915242
Nullschool 7th July wind chart for Caloundra
https://earth.nullschool.net/#2018/07/07/1400Z/wind/surface/level/orthographic=-217.66,-32.79,1247
Caloundra 24 hour 60 second sampling chart for the 7th July.
http://sccc.org.au/wp-content/uploads/2018/07/Caloundra-24-hour-chart-070718.jpg
A few days before the Caloundra detection, a contact in Tasmania informed me of spikes in their local background. Spikes in background in Tasmania were detected on two separate detectors. On the 4th July the Tasmanian wind direction source was also off the Australian mainland.
Nullschool 4th July wind chart for Tasmania
https://earth.nullschool.net/#2018/07/04/0600Z/wind/surface/level/orthographic=-209.76,-28.21,815/loc=146.465,4.276
Tasmania, 4th July Background chart
http://sccc.org.au/wp-content/uploads/2018/07/Tasmania-4th-July-2018.png
Tasmania, 6th July Background chart
http://sccc.org.au/wp-content/uploads/2018/07/Tasmania-6th-July-2018.png
The Tasmanian monitoring station happened to have an air filter which was sent to me for testing and arrived a few day later.
Below is the Tasmania filter test chart minus background tested using new Theremino PMT adapter equipment. If there was anything present it is below the resolution of the equipment here.
http://sccc.org.au/wp-content/uploads/2018/08/Tasmania-filter-test-110718-TV7.2-16c-161387.png
Caloundra Water Tank Filter test
Here is the latest Caloundra local water tank filter test of 45 grams of fine organic material minus background. The two prominent isotope peaks are for the isotopes of Lead-210, from Radon-222 decay, and Berryllium-7, from upper atmosphere spallation.
The Caloundra and Tasmanian filter tests did not show anything significant, which points to radioactive short life volatile gases passing through. The most likely source of short life volatile radioactive gases in Australia would be the Lucas Heights nuclear reactor in Sydney Australia. The circumstantial evidence points to venting occurring at the Lucas Heights facility, to fix the broken conveyor used in the production of Technetium-99m.
Other possibilities are,
Another source on the Australia mainland.
An event somewhere else in the World or at Fukushima.
A secret device test in Australia.
Were the Caloundra and Tasmanian detections just coincidental?
Any suggestions or relevant information regarding these detections are welcome.
————————————————————
July is winter here in the Southern Hemisphere. Since the Fukushima Nuclear Catastrophe in 2011, long term local data collection is showing an increase in winter local background levels.
Caloundra 24 hour day average chart for July 2018
Caloundra July month average, year comparisons.
2018 14% above pre-Fukushima average
2017 17% above pre-Fukushima average
2016 8% above pre-Fukushima average
2015 5% above pre-Fukushima average
2014 5% above pre-Fukushima average
2013 6% above pre-Fukushima average
2012 9% above pre-Fukushima average
————————————————————-
International Radiation Monitoring Station Updated
Sites that were no longer operating have been removed, and new monitoring stations added.
http://sccc.org.au/international-radiation-monitoring-stations
Disclaimer: This is an amateur volunteer run service. Human error can provide incorrect information, and equipment malfunction can produce false readings. Do not rely on, or take action upon information presented on this web site, without further research.
Jul 16, 2018 @ 18:21
Spikes detected on Australian monitoring stations located in Tasmania and Caloundra
Very surprised to find this significant detection showing up on the Caloundra 24 hour chart for the 7th of July. There had been an up tick in background at the beginning of July compared to June 2018, but the 52% above day average detection was a shock. Wind direct at the time was from inland Australia which was also very surprising.
See Nullschool 7th July wind chart for Caloundra.
https://earth.nullschool.net/#2018/07/07/1400Z/wind/surface/level/orthographic=-217.66,-32.79,1247
Caloundra Station location:
http://sccc.org.au/monitoring/Australian-Map.jpg
Caloundra 24 hour 60 second sampling chart for the 7th July.
http://sccc.org.au/wp-content/uploads/2018/07/Caloundra-24-hour-chart-070718.jpg
A few days before the Caloundra detection, a contact in Tasmania informed me of spikes in his local background. These spikes in background in Tasmania were detected on two separate detectors. On the 4th July the Tasmanian wind direction source was also off the Australian mainland.
Tasmania, 4th July chart
http://sccc.org.au/wp-content/uploads/2018/07/Tasmania-4th-July-2018.png
Tasmania, 6th July chart
http://sccc.org.au/wp-content/uploads/2018/07/Tasmania-6th-July-2018.png
Caloundra day average chart
What the chart colour codes mean.
http://sccc.org.au/what-does-each-step-in-the-alert-level-colour-code-mean
Questions:
What is the source of these significant Australian winter detections?
Was there an event or release on the Australia mainland?
Has a significant unreported nuclear event occurred somewhere in the world?
Were these detections unrelated and just coincidental?
Suggestions and information related to these detections are welcome.
Disclaimer: This is an amateur volunteer run service. Human error can provide incorrect information, and equipment malfunction can produce false readings. Do not rely on, or take action upon information presented on this web site, without further research.
2018/07/07 at 8:47 pm
Southern Hemisphere June 2018 Background Level Report
Station location
http://sccc.org.au/monitoring/Australian-Map.jpg
This short animation of Northern and Southern Hemisphere air circulation, shows why we can get detections so far south.
http://www.youtube.com/watch?v=qh011eAYjAA
June is winter here in the Southern Hemisphere. The long term June data is showing a gradual increase in winter local background levels, since the Fukushima Nuclear Catastrophe.
June 2018 day average background chart,
Caloundra June month average, year comparisons.
2018 11% above pre-Fukushima average
2017 12% above pre-Fukushima average
2016 7% above pre-Fukushima average
2015 3% above pre-Fukushima average
2014 7% above pre-Fukushima average
2013 7% above pre-Fukushima average
2012 3% above pre-Fukushima average
Disclaimer: This is an amateur volunteer run service. Human error can provide incorrect information, and equipment malfunction can produce false readings. Do not rely on, or take action upon information presented on this web site, without further research.
Jun 2, 2018 @ 18:22
Southern Hemisphere May 2018 Background Level Report
Station location
http://sccc.org.au/monitoring/Australian-Map.jpg
This short animation of Northern and Southern Hemisphere air circulation, shows why we can get detections so far south.
http://www.youtube.com/watch?v=qh011eAYjAA
A nice quiet month without any significant background events. As most of the air flows here during this season come from a southerly direction, May local background levels were much lower than the summer months
May 2018 day average background chart
Caloundra May month average, year comparisons.
2018 12% above pre-Fukushima average
2017 7% above pre-Fukushima average
2016 12% above pre-Fukushima average
2015 4% above pre-Fukushima average
2014 13% above pre-Fukushima average
2013 7% above pre-Fukushima average
2012 7% above pre-Fukushima average
Disclaimer: This is an amateur volunteer run service. Human error can provide incorrect information, and equipment malfunction can produce false readings. Do not rely on, or take action upon information presented on this web site, without further research.
Southern Hemisphere April 2018 Background Level Report
Station location
http://sccc.org.au/monitoring/Australian-Map.jpg
This short animation of Northern and Southern Hemisphere air circulation, shows why we can get detections so far south.
http://www.youtube.com/watch?v=qh011eAYjAA
This month the GammaScout Geiger Counter used for data logging local background, developed a fault. I managed to get it working again, but in the process lost some day average logging data, hence the gap in the chart.
April month averages tend to vary from year to year by a significant amount. As the Southern Hemisphere winter approaches, air flows here swing a lot between Northern Tropic air to Southern Ocean air flows. If we get more tropical air in April the background goes up. If there are more Southern Ocean air flows, the month average goes down. Since Fukushima, this has become a dynamic of the local background monitoring. If you look at the charts on the yearly average background page, link below, you can clearly see an annual winter background dip showing up in the year and month background charts.
http://sccc.org.au/yearly-average-background-radiation-levels
April 2018 day average background chart,
Caloundra April month average, year comparisons.
2018 24% above pre-Fukushima average
2017 11% above pre-Fukushima average
2016 33% above pre-Fukushima average
2015 6% above pre-Fukushima average
2014 22% above pre-Fukushima average
2013 9% above pre-Fukushima average
2012 12% above pre-Fukushima average
Cairns April Report – Fairly level, without any spikes. (Cairns has two monitoring Geiger counters.)
http://sccc.org.au/wp-content/uploads/2018/05/Cairns-April-2018.jpg
Disclaimer: This is an amateur volunteer run service. Human error can provide incorrect information, and equipment malfunction can produce false readings. Do not rely on, or take action upon information presented on this web site, without further research.
2018/04/01 at 4:03 pm
Southern Hemisphere March 2018 Background Level Report
Station location
http://sccc.org.au/monitoring/Australian-Map.jpg
This short animation of Northern and Southern Hemisphere air circulation, shows why we can get detections so far south.
http://www.youtube.com/watch?v=qh011eAYjAA
The stats are in, and March 2018 had the highest recorded March background ever recorded here, at 46% above average. What is creating these Southern Hemisphere increases? Fukushima atmospheric contamination? Increases cosmic rays? Radon releases, or combination of all off these?
Alert Caloundra 27th March 2018 – In the morning the GammaScout Geiger counter started to alarm on and off very quickly. One visual observation showed a spike of 0.625 uSv/hr. Looking at all the very short duration high detections I have been seeing recently, it suggests to me that I am detecting lots of hot particles in the atmosphere. If I didn’t have 60 second sampling and a 0.30 uSv/hr alarm setting in place, I would probably have missed these detections. They would have been hidden in the averages, because they are of such a short duration.
The 24hr 60 second logging chart shows numerous short duration peaks between 8.30 am and 11.30 am.
http://sccc.org.au/wp-content/uploads/2018/03/Caloundra-24-hour-chart-270318.jpg
At the time we had one low pressure system sitting off the East coast plus another in North Queensland, look at the wind map link below. The wind map shows the local air mass at the time was coming off the Pacific Ocean. The main source appeared to be a high pressure system situated East of New Zealand. The air from it was being drawn into these two lows. This air flow was passing over this location at the time. My present theory is that contaminated air was drawn down from the upper atmosphere to the surface, by this high pressure system.
The wind direction at the time was South Easterly, off the Pacific Ocean! It was an overcast, but a fine day.
https://earth.nullschool.net/#2018/03/27/0600Z/wind/surface/level/orthographic=-192.66,-35.51,1343/loc=146.465,4.276
On the 27th March Radon levels where relatively low.
http://sccc.org.au/wp-content/uploads/2018/03/ThereminoGeiger_2018_03_27_21_16_00.png
March 2018 day average background chart, (What the bar chart colour codes mean.)
Caloundra March month average, year comparisons.
2018 46% above pre-Fukushima average
2017 38% above pre-Fukushima average
2016 39% above pre-Fukushima average
2015 33% above pre-Fukushima average
2014 31% above pre-Fukushima average
2013 32% above pre-Fukushima average
2012 24% above pre-Fukushima average
Year and month average local background radiation levels from 2007 to 2018.
http://sccc.org.au/yearly-average-background-radiation-levels
Disclaimer: This is an amateur volunteer run service. Human error can provide incorrect information, and equipment malfunction can produce false readings. Do not rely on, or take action upon information presented on this web site, without further research.
2018/03/14 at 5:32 pm
Southern Hemisphere February 2018 Background Level Report
Station location
http://sccc.org.au/monitoring/Australian-Map.jpg
This short animation of Northern and Southern Hemisphere air circulation, shows why we can get detections so far south.
http://www.youtube.com/watch?v=qh011eAYjAA
The month average for February 2018 was 49% above pre-Fukushima levels, the highest month average local February background on record. Late February also had three days that were 80%+ above average. This is the first time here we have had three days in a row at 80% above pre-Fukushima levels.
A contributing factor to the day average increases near the end of February would have been the 10 pCi/l + Radon spikes that were detected on the 23rd, 24th and 25th. The Radon spike detections were possibly a precursor to an up tick in earthquake and volcanic activity on the Pacific rim, as the surface wind was coming off the Pacific Ocean at the time.
Even so, the elevated Radon levels would not account for all the month day average background increases.
Chart of Radon Spike on the 25th
http://sccc.org.au/wp-content/uploads/2018/03/Radon-spike-25th-February-2018.png
February 2018 day average background chart,
What the bar chart colour codes mean. http://sccc.org.au/what-does-each-step-in-the-alert-level-colour-code-mean
Caloundra February month average, year comparisons.
2018 49% above pre-Fukushima average
2017 42% above pre-Fukushima average
2016 41% above pre-Fukushima average
2015 30% above pre-Fukushima average
2014 40% above pre-Fukushima average
2013 39% above pre-Fukushima average
2012 37% above pre-Fukushima average
Year and month average local background radiation levels from 2007 to 2018.
http://sccc.org.au/yearly-average-background-radiation-levels
Disclaimer: This is an amateur volunteer run service. Human error can provide incorrect information, and equipment malfunction can produce false readings. Do not rely on, or take action upon information presented on this web site, without further research.
2018/02/04 at 3:38 pm
Southern Hemisphere January 2018 Background Report
Station location
http://sccc.org.au/monitoring/Australian-Map.jpg
This short animation of Northern and Southern Hemisphere air circulation, shows why we can get detections so far south.
http://www.youtube.com/watch?v=qh011eAYjAA
Caloundra 2nd January 2018 – Another massive Radon spike was detected and reached up to 10 pCi/L.
http://sccc.org.au/wp-content/uploads/2014/10/Radon_Info_ENG.pdf
At the peak of this spike it was very humid, but not raining, and the local Radon monitor was in a wooden building with the door and some windows open. Under these environmental monitoring conditions, this is a very large spike in local Radon levels. The wind direction during the event was from the tropics.
Radon Event Chart:
http://sccc.org.au/wp-content/uploads/2018/01/ThereminoGeiger_2018_01_02_21_29_19.jpg
Caloundra January month average, year comparisons.
2018 45% above pre-Fukushima average
2017 42% above pre-Fukushima average
2016 41% above pre-Fukushima average
2015 40% above pre-Fukushima average
2014 41% above pre-Fukushima average
2013 52% above pre-Fukushima average
2012 43% above pre-Fukushima average
On the 15th January there was a marked drop in background levels, as the wind direction changed to a Southerly from the Southern Ocean. This dynamic has been constant since Fukushima. Whenever Southern Ocean air flows reach here, we get a significant drop in background levels.
January 2018 day average chart,
http://sccc.org.au/wp-content/uploads/2018/01/Caloundra-local-average-background-radiation-levels-January-2018.jpg
What the bar chart colour codes mean.
http://sccc.org.au/what-does-each-step-in-the-alert-level-colour-code-mean
Cairns North Queensland January background Report – Fairly flat, the little spikes were coincidental with some thunderstorms and good rainfalls.
The Cairns monitoring station has two GammaScout Geiger counters.
http://sccc.org.au/wp-content/uploads/2018/02/Cairns-January-2018.jpg
Year and month average local background radiation levels from 2007 to 2018.
http://sccc.org.au/yearly-average-background-radiation-levels
Disclaimer: This is an amateur volunteer run service. Human error can provide incorrect information, and equipment malfunction can produce false readings. Do not rely on, or take action upon information presented on this web site, without further research.
BEGINNING 2018
END 2017
2018/01/06 at 4:15 pm
2017 Yearly Report, Multiple Records Broken! Some of these background increases were not Fukushima related.
Station location
http://sccc.org.au/monitoring/Australian-Map.jpg
This short animation of Northern and Southern Hemisphere air circulation, shows why we can get detections so far south.
http://www.youtube.com/watch?v=qh011eAYjAA
2017 was a record breaking year. Contributing factors to this year’s background increases were, Radon from earthquake activity in the Pacific, the Sun going into a quiet period, and from Northern to Southern equatorial air flow break through. These were in addition to the recorded Fukushima increases since 2011. Detailed 2017 monthly reports can be found here, http://sccc.org.au/daily-local-background-radiation-levels-and-advisories-for-2017
1. March 30th saw the highest day average background ever recorded here, at 0.215 uSv/hr.
On March 29th, the day average was 51% above average. On the 30th, the low pressure system left over from cyclone Debbie came through, and the local background 24 hour day average spiked even more. Background peaked at 0.215 uSv/hr which is ~115% above average for this location. Yes, there was a spike in Radon levels on that day,but it wasn’t significant enough to account for this amount of increase in local background.
http://sccc.org.au/wp-content/uploads/2018/01/ThereminoGeiger_2017_03_30_21_51_41.jpg
At the time Cyclone Debbie had turned into a low pressure system but was drawing in tropical air.
March 30th day average chart.
http://sccc.org.au/wp-content/uploads/2017/03/Caloundra-local-average-background-radiation-levels-March-2017.jpg
March 30th 24 hour 60 chart.
http://sccc.org.au/wp-content/uploads/2017/03/Caloundra-24-hour-chart-300317.jpg
2. February, June, July, August, September and December had the highest recorded background month averages since Fukushima. June water tank filter testing detected mainly Lead-210, the a decay daughter of Radon, and Beryllium-7. Beryllium-7 is created by cosmic ray spallation in the upper atmosphere. Although Pb-210 and Be-7 may have contributed to the background increases the amounts detected where not significant enough to account for this significant increase in local background.
Water tank filter test.
3. On the 3rd December 2017 a massive radon spike was detected that reached up to 8 pCi/L. At the time of the event it was very humid but not raining. The local live Radon monitor was in a wooden building with the door, and some windows open. Under these environmental monitoring conditions, this is a very large spike in local Radon levels. The wind direction during the Radon spike was easterly off the Pacific Ocean.
http://sccc.org.au/wp-content/uploads/2018/01/ThereminoGeiger_2017_12_03_21_10_11.png
4. 2017 had the highest year average background level ever recorded here at 27% above the 4 year pre-Fukushima average. Some of the local background increases in October, November, and early December occurred during Easterly air flows. These Easterly air flows brought Radon gas releases to this location from a massive earthquake swarm and volcanic activity that appeared in the New Caledonia, Vanuatu, Soloman Islands and Fiji regions of the Pacific Ocean, at that time.
http://sccc.org.au/wp-content/uploads/2017/12/November-2017-Eastern-Pacific-Earthquake-Swam.png
2007 to 2017 year average background level comparison.
5. The Monitoring GammaScout Geiger counter alarmed numerous times on the mornings of the 30th and the 31st December. These alarms were for short duration spikes in background, as wind direction changed to a Northern tropical direction. The last time we saw spikes like this was after Fukushima. These where very short duration events, less than 60 seconds, which suggest hot particles were passing through the monitoring Geiger counter environment.
Background spike detected on the 31st December 2017. (Visual observation at the time saw the GammaScout Geiger counter spike at 0.725 uSv/hr.
http://sccc.org.au/wp-content/uploads/2018/01/Caloundra-24-hour-chart-311217.jpg
Background spike detected on the 30th December 2017. (Visual observation at the time saw the GammaScout Geiger counter spike at 0.650 uSv/hr.)
http://sccc.org.au/wp-content/uploads/2018/01/Caloundra-24-hour-chart-301217.jpg
Caloundra December month average, year comparisons.
2017 45% above pre-Fukushima average
2016 36% above pre-Fukushima average
2015 35% above pre-Fukushima average
2014 32% above pre-Fukushima average
2013 36% above pre-Fukushima average
2012 43% above pre-Fukushima average
December day average chart,
http://sccc.org.au/wp-content/uploads/2017/12/Caloundra-local-average-background-radiation-levels-December-2017.jpg
What the bar chart colour codes mean.
http://sccc.org.au/what-does-each-step-in-the-alert-level-colour-code-meanYear and month average local background radiation levels from 2007 to 2017.
http://sccc.org.au/yearly-average-background-radiation-levels
Disclaimer: This is an amateur volunteer run service. Human error can provide incorrect information, and equipment malfunction can produce false readings. Do not rely on, or take action upon information presented on this web site, without further research.
2017/12/09 at 3:48 pm
Southern Hemisphere November 2017 Background Report. (32% above Average)
Station locations
http://sccc.org.au/monitoring/Australian-Map.jpg
This short animation of Northern and Southern Hemisphere air circulation, shows why we can get detections so far south.
http://www.youtube.com/watch?v=qh011eAYjAA
Report
Caloundra November 2017 – The elevated background level increases at the end of November 2017 chart have also coincided with a significant increase in Radon detection in the local atmosphere.
The elevated Radon detections over the last couple of months seems to have been a precursor to the outbreak of a very large earthquake swarm in the Eastern Pacific.
http://sccc.org.au/wp-content/uploads/2017/12/November-2017-Eastern-Pacific-Earthquake-Swam.png
A magnitude 7.0 earthquake at 86km ENE of Tadine, New Caledonia occurred on the 19th November.
The recent Radon increases would have been a contributing factor to the November elevated background levels, but not the only factor.
The third chart down on this page is the local live Radon monitoring chart.
http://sccc.org.au/monitoring/sunshinecoast-monitoring-station.html
Caloundra November month average, year comparisons.
2017 32% above pre-Fukushima average
2016 32% above pre-Fukushima average
2015 37% above pre-Fukushima average
2014 29% above pre-Fukushima average
2013 30% above pre-Fukushima average
2012 31% above pre-Fukushima average
November day average chart,
What the bar chart colour codes mean.
http://sccc.org.au/what-does-each-step-in-the-alert-level-colour-code-mean
Year and month average local background radiation levels from 2007 to 2017.
http://sccc.org.au/yearly-average-background-radiation-levels
Disclaimer: This is an amateur volunteer run service. Human error can provide incorrect information, and equipment malfunction can produce false readings. Do not rely on, or take action upon information presented here, without further research.
Southern Hemisphere October 2017 Background Report. (32% above Average)
Station locations
http://sccc.org.au/monitoring/Australian-Map.jpg
This short animation of Northern and Southern Hemisphere air circulation, shows why we can get detections so far south.
http://www.youtube.com/watch?v=qh011eAYjAA
Report
Caloundra October 2017 – The elevated background level increases we are seeing in the October 2017 chart have also coincided with a significant increase in Radon detection in the local atmosphere.
http://sccc.org.au/wp-content/uploads/2014/10/Radon_Info_ENG.pdf
The amount of Radon detected locally has increased significantly since September 2017. In September Radon levels stayed below 0.1 pCi/l for the majority of the month.
http://sccc.org.au/wp-content/uploads/2017/10/ThereminoGeiger_2017_09_16_21_57_37.jpg
At times in October it has reached up into 3 pCi/l.
http://sccc.org.au/wp-content/uploads/2017/11/ThereminoGeiger_2017_10_04_21_39_06.jpg
During this period there was a high pressure system sitting between Australia and New Zealand. It was bringing air flows from the West coast of New Zealand and the Eastern Pacific Ocean, to this location. This suggests the Radon source is from the recent volcanic activity in Northern New Zealand, and earthquake releases in the Eastern Pacific.
http://sccc.org.au/wp-content/uploads/2017/10/Surface-wind-direction-20-10-2017.png
The recent Radon increases would have been a contributing factor to the October elevated background levels, but not the only factor.
Caloundra October month average, year comparisons.
2017 32% above pre-Fukushima average
2016 22% above pre-Fukushima average
2015 12% above pre-Fukushima average
2014 14% above pre-Fukushima average
2013 25% above pre-Fukushima average
2012 19% above pre-Fukushima average
October day average chart,
Year and month average local background radiation levels from 2007 to 2017.
http://sccc.org.au/yearly-average-background-radiation-levels
Disclaimer: This is an amateur volunteer run service. Human error can provide incorrect information, and equipment malfunction can produce false readings. Do not rely on, or take action upon information presented here, without further research.
Southern Hemisphere September 2017 Background Report. (27% above Average)
Station locations
http://sccc.org.au/monitoring/Australian-Map.jpg
This short animation of Northern and Southern Hemisphere air circulation, shows why we can get detections so far south.
Report
Caloundra September 2017 – In the last few months there has been a steady increase in month averages at this location in the Southern Hemisphere. The months have been very dry. The September rainfall total was 15mm and the wettest day was the 23rd, with 13mm. Radon levels have been low, so it did not contribute significantly to the day average increases we have seen through September.
I have been trying to work out why there has been an unseasonal increase in background here in winter, on top of the normal Fukushima increase.
So what created these recent increases?
Here are some theories.
1. There has been more mixing of Northern and Southern hemisphere tropical air flows, allowing more radiation from the Northern hemisphere to enter the Southern Hemisphere.
2. Research is showing that more cosmic rays are now reaching the Earth because the Sun’s heliosphere is decreasing in intensity.
(2017 chart of Cosmic Ray increases.)
This is part of a normal Sun cycle that occurs approximately every 420 years.
Could a significant part of the Winter background uptick here be from increased cosmic radiation and
by-products reaching the earth’s surface?
Cosmic ray muon creation in the upper atmosphere could also be a significant part of this increase.
http://cosmic.lbl.gov/SKliewer/Cosmic_Rays/Muons.htm
If this is the case, we would expect there to be an uptick in background radiation detection by Geiger counters, even at the surface of the Earth.
Most people don’t go to the trouble of collecting day average and month average radiation background levels, using 60 second sampling. My system of data collection will show changes that would be missed by others.
3. The Monitoring Geiger Counter is malfunctioning.
I haven’t been able to find any evidence that this is the case. Ruled out the possibility of dust contamination as the area around monitoring counter was cleaned of dust, plus the Geiger counter was also inspected and cleaned of any dust build up. The background levels have continued to climb, even after the clean.
The GammaScout Geiger counter battery level is still at the normal operating 3.6 volts.
——————
My conclusion at this point is that the increased cosmic ray activity, plus the Fukushima increase, are both contributing to the local background levels we are now seeing.
Caloundra September month average, year comparisons.
2017 27% above pre-Fukushima average
2016 12% above pre-Fukushima average
2015 5% above pre-Fukushima average
2014 5% above pre-Fukushima average
2013 15% above pre-Fukushima average
2012 13% above pre-Fukushima average
September day average chart,
Year and month average local background radiation levels from 2007 to 2017.
http://sccc.org.au/yearly-average-background-radiation-levels
Disclaimer: This is an amateur volunteer run service. Human error can provide incorrect information, and equipment malfunction can produce false readings. Do not rely on, or take action upon information presented here, without further research.
2017/09/11 at 8:13 pm
Southern Hemisphere August 2017 Background Report. (17% above Average)
Station locations
http://sccc.org.au/monitoring/Australian-Map.jpg
This short animation of Northern and Southern Hemisphere air circulation, shows why we can get detections so far south.
http://www.youtube.com/watch?v=qh011eAYjAA
Report
Caloundra August 2017 – Radon levels have been low and would not account for the month average increase. There was only 24 mm of rain for August. Significant day average increases coincided with Eastern Pacific air flows.
Caloundra August month average, year comparisons.
2017 17% above pre-Fukushima average
2016 8% above pre-Fukushima average
2015 5% above pre-Fukushima average
2014 4% above pre-Fukushima average
2013 8% above pre-Fukushima average
2012 9% above pre-Fukushima average
August month day average chart,
Year and month average local background radiation levels from 2007 to 2017.
http://sccc.org.au/yearly-average-background-radiation-levels
Disclaimer: This is an amateur volunteer run service. Human error can provide incorrect information, and equipment malfunction can produce false readings. Do not rely on, or take action upon information presented here, without further research.
2017/08/12 at 6:08 pm
Southern Hemisphere July 2017 Background Report. (17% above Average)
Station locations
http://sccc.org.au/monitoring/Australian-Map.jpg
This short animation of Northern and Southern Hemisphere air circulation, shows why we can get detections so far south.
http://www.youtube.com/watch?v=qh011eAYjAA
Report
Caloundra July 2017 – The local background level increase on 7th July coincided with an increased detection of Radon gas in the air. This increase in Radon levels would not account for all of the day average increase. There were no significant rain washout events. The wettest day was the 6th, with 14mmm of rain. What created the significant background increases for June and July this year?
Caloundra July month average, year comparisons.
2017 17% above pre-Fukushima average
2016 8% above pre-Fukushima average
2015 5% above pre-Fukushima average
2014 5% above pre-Fukushima average
2013 5% above pre-Fukushima average
2012 9% above pre-Fukushima average
July month day average chart,
Year and month average local background radiation levels from 2007 to 2017.
http://sccc.org.au/yearly-average-background-radiation-levels
Disclaimer: This is an amateur volunteer run service. Human error can provide incorrect information, and equipment malfunction can produce false readings. Do not rely on, or take action upon information presented here, without further research.
2017/07/08 at 5:24 pm
Southern Hemisphere June 2017 Background Report. (20% above Average)
Station locations
http://sccc.org.au/monitoring/Australian-Map.jpg
This short animation of Northern and Southern Hemisphere air circulation, shows why we can get detections so far south.
http://www.youtube.com/watch?v=qh011eAYjAA
Report
Alert Caloundra June 2017
There was a steady increase in background levels in early June, that increased to alert levels towards mid June.
What do the Alert levels here mean?
http://sccc.org.au/what-does-each-step-in-the-alert-level-colour-code-mean
As this event started in early June, the bench area around the monitoring GammaScout Geiger counter was cleaned, and the GammaScout was also cleaned to eliminate the possibility of dust contamination. This has made no difference, as background levels remained higher than usual. This is the Southern Hemisphere winter. Until now, no June pre or post Fukushima background has been higher than 7% above average. We have 10 years of local records to refer to.
It was mostly dry for the month, with only 20mm of rain for the whole month. The local live radon monitor did detect small increases in local Radon levels that coincided with recorded background radiation level increases. These Radon level increases would have been a contributing factor to the background level increase, but not significant enough to be the only factor.
Caloundra June month average, year comparisons.
2017 20% above pre-Fukushima average
2016 7% above pre-Fukushima average
2015 3% above pre-Fukushima average
2014 7% above pre-Fukushima average
2013 7% above pre-Fukushima average
2012 3% above pre-Fukushima average
June month day average chart,
The June 2017 Cairns Caloundra comparison chart, shows that Cairns did not experience the background swings that Caloundra did.
2017 month day average chart so far,
Year and month average local background radiation levels from 2007 to 2017.
http://sccc.org.au/yearly-average-background-radiation-levels
Water Tank Filter Test
Here is a test of 34 grams of organic material caught in a local water tank inlet filter.
The main isotopes detected were Beryllium Be-7 and Lead Pb-210. Beryllium Be-7 can be created naturally in trace amounts by spallation in the upper atmosphere by cosmic rays. Lead Pb-210 is the decay daughter of naturally occurring Radon-222 decay.
The scintillator device used for testing loses sensitivity with increasing isotope energy (keV). Taking the difference in sensitivity into account, the Be-7 peak is around 14 times higher than than the chart indicates. The Pb-210 would be around twice as high as show on the chart.
That is a lot of Be-7 in 34 grams of material. Would the levels of Pb-210 and Be-7 detected in the organic material collected from the water tank filter be sufficient to explain the significantly elevated local background levels here in June?
My Theory
There must have been a significant amount of cosmic ray spallation happening in the upper atmosphere recently, to produce this much Be-7.
The sun is becoming far less radiant. The sun is going into one of it’s quiet periods. These occur approximately every four hundred years. Less radiance means the sun’s heliosphere is much weaker. The sun’s heliosphere acts as a shield, protecting the Earth from in coming cosmic rays. A much weaker heliosphere means more cosmic rays strike the upper atmosphere, which results in more atmospheric spallation, hence more Be-7 is detected in the water tank filter test.
I notice that when the elevated detections occurred in June, the wind was mostly coming from an easterly direction, off the Pacific Ocean. This suggests that volcanic and earthquake releases of naturally occurring Radon-222 into the atmosphere, was also a contributing factor.
Disclaimer: This is an amateur volunteer run service. Human error can provide incorrect information, and equipment malfunction can produce false readings. Do not rely on, or take action upon information presented here, without further research.
2017/06/04 at 4:56 pm
Southern Hemisphere May 2017 Background Report. (7% above Average)
Station locations
http://sccc.org.au/monitoring/Australian-Map.jpg
This short animation of Northern and Southern Hemisphere air circulation, shows why we can get detections so far south.
http://www.youtube.com/watch?v=qh011eAYjAA
Reports
Cairns May 2017 Report – “Glad to see, it was all pretty flat again.”
http://sccc.org.au/wp-content/uploads/2017/06/Cairns-Caloundra-comparison-for-May-2017.jpg
Caloundra May 2017 – May was another quiet month, with mainly Southern Ocean air flows reaching this location.
Month day average,
Caloundra May month average year comparisons.
2017 7% above pre-Fukushima average
2016 20% above pre-Fukushima average
2015 4% above pre-Fukushima average
2014 13% above pre-Fukushima average
2013 7% above pre-Fukushima average
2012 7% above pre-Fukushima average
Year and month average local background radiation levels from 2007 to 2017.
http://sccc.org.au/yearly-average-background-radiation-levels
Disclaimer: This is an amateur volunteer run service. Human error can provide incorrect information, and equipment malfunction can produce false readings. Do not rely on, or take action upon information presented here, without further research.
2017/05/20 at 5:00 pm
Southern Hemisphere April 2017 Background Report. (10% above Average)
Station location
http://sccc.org.au/monitoring/Australian-Map.jpg
This short animation of Northern and Southern Hemisphere air circulation, shows why we can get detections so far south.
Reports
Cairns April 2017 Report – “Fairly flat, no major events.”
http://sccc.org.au/wp-content/uploads/2017/05/Cairns-Caloundra-comparison-for-April-2017.jpg
Caloundra April 2017 – This April saw a lot more Southern Ocean air flows reach this location. As we have seen numerous times, Southern Ocean air flows cause a drop in local temperature, and radiation levels.
Month day average,
Caloundra April month average year comparisons.
2017 10% above pre-Fukushima average
2016 33% above pre-Fukushima average
2015 8% above pre-Fukushima average
2014 22% above pre-Fukushima average
2013 9% above pre-Fukushima average
2012 12% above pre-Fukushima average
Year and month average local background radiation levels
http://sccc.org.au/yearly-average-background-radiation-levels
Disclaimer: This is an amateur volunteer run service. Human error can provide incorrect information, and equipment malfunction can produce false readings. Do not rely on, or take action upon information presented here, without further research.
2017/04/01 at 6:28 pm PDST
Southern Hemisphere March 2017 Background Report.
Station location
http://sccc.org.au/monitoring/Australian-Map.jpg
This short animation of Northern and Southern Hemisphere air circulation, shows why we can get detections so far south.
http://www.youtube.com/watch?v=qh011eAYjAA
Report
On Thursday the 30th March 2017, the Sunshine Coast Australia was bracing for a torrential downpour from remnants of ex-Cyclone Debbie. The South East was going into shut down, schools and businesses closed. As the rain fronts came down the east coast of Australia, we saw spikes in local background levels.
On the 29th, the day average was 51% above average. On the 30th when the main weather system, left over from Debbie, came through, the local background 24 hour day average spiked even more. The day average was 0.215 uSv/hr which is ~115% above average for this location!
Day average chart
What do the chart colour Alert codes mean?
http://sccc.org.au/what-does-each-step-in-the-alert-level-colour-code-mean
24 hour 60 second logging chart
http://sccc.org.au/wp-content/uploads/2017/03/Caloundra-24-hour-chart-300317.jpg
A part of this increase in background radiation level was probably caused by an increased amount of atmospheric Radon gas. More Radon gas is forced out of the ground during heavy rain events. The increase in Radon levels is seen in the live Radon monitoring chart, screen shot below. In my opinion not all this significant increase in background levels on the 30th, can be attributed to an increase in Radon levels.
http://sccc.org.au/wp-content/uploads/2017/03/ThereminoGeiger_2017_03_30_21_51_41.jpg
We had a similar rain event occur here in March 2012. These lows suck moisture in from the tropics and then bring it down the east coast of Australia.
http://www.abc.net.au/news/2017-03-29/cyclone-debbie-big-picture-view-from-space/8396684
The same advisory suggestions for March 2012 apply whenever one of these tropical rain events occur, as they did in 2012.
Report from March 5th 2012
Average background up to 8.30am 0.145uSv/Hr, 24 hr average 0.185 uS/Hr elevated – Advisory Issued
It may be wise to stay out of the rain. I am getting indoor peaks up to 0.63 uS/hr on the Geiger Counter, as this rain event moves through. It suggests it may be radioactively hotter outside. Maybe worth letting your local friends know. If you or a child gets wet in it, have a good shower when you can. I have no idea what isotopes are in the rain, only that my Geiger counter is registering 6x higher than our normal background radiation, in peaks. These peaks are only lasting for a very short period of time.
Month day average,
24 hour 60 second logging chart
http://sccc.org.au/wp-content/uploads/2012/03/24-hour-background-radiation-chart-05032012.jpg
Caloundra March month average year comparisons.
The March month average data indicates a steady in crease in Southern Hemisphere local background levels has occurred over the years, since Fukushima. If we are getting background increases here in the Southern Hemisphere, it suggests that areas in the Northern Hemisphere would be greater.
2017 38% above pre-Fukushima average
2016 39% above pre-Fukushima average
2015 33% above pre-Fukushima average
2014 31% above pre-Fukushima average
2013 32% above pre-Fukushima average
2012 24% above pre-Fukushima average
Year and month average local background radiation levels
http://sccc.org.au/yearly-average-background-radiation-levels
Disclaimer: This is an amateur volunteer run service. Human error can provide incorrect information, and equipment malfunction can produce false readings. Do not rely on, or take action upon information presented here, without further research.
2017/03/02 at 4:48 pm
Southern Hemisphere February 2017 Background Report.
Station location
http://sccc.org.au/monitoring/Australian-Map.jpg
This short animation of Northern and Southern Hemisphere air circulation, shows why we can get detections so far south.
http://www.youtube.com/watch?v=qh011eAYjAA
Report for February 2017. (42% above average)
The Caloundra monthly average charts for February 2012 and 2013 showed wild fluctuations (Charts Below). Now the charts show less volatility, but the average background is higher. This suggests to me that everything is now more evenly mixed in the atmosphere. Even so, background levels have still increased. Interestingly, we had very little rain in February this year, compared to previous years.
Caloundra February month average year comparisons.
2017 42% above pre-Fukushima average
2016 41% above pre-Fukushima average
2015 30% above pre-Fukushima average
2014 40% above pre-Fukushima average
2013 39% above pre-Fukushima average
2012 37% above pre-Fukushima average
February 2017 had the highest recorded February month average background since Fukushima!
Month average chart for February 2017
http://sccc.org.au/wp-content/uploads/2017/02/Caloundra-local-average-background-radiation-levels-February-2017.jpg
Month average chart for February 2013
http://sccc.org.au/wp-content/uploads/2013/02/Caloundra-local-average-background-radiation-levels-February-2013.jpg
Month average chart for February 2012
http://sccc.org.au/wp-content/uploads/2012/04/Caloundra-local-average-background-radiation-levels-February-2012.jpg
Year and month average local background radiation levels
http://sccc.org.au/yearly-average-background-radiation-levels
Disclaimer: This is an amateur volunteer run service. Human error can provide incorrect information, and equipment malfunction can produce false readings. Do not rely on, or take action upon information presented here, without further research.
BEGINNING 2017
END 2016
Southern Hemisphere Year Background Report For 2016.
Station location
http://sccc.org.au/monitoring/Australian-Map.jpg
This short animation of Northern and Southern Hemisphere air circulation, shows why we can get detections so far south.
http://www.youtube.com/watch?v=qh011eAYjAA
Caloundra day average chart for December 2016. (36% above average)
Caloundra December month average year comparisons.
2016 36% above pre-Fukushima average
2015 35% above pre-Fukushima average
2014 32% above pre-Fukushima average
2013 36% above pre-Fukushima average
2012 43% above pre-Fukushima average
Report:
Even thought December 2016 had a lower December month average background compared to December 2012, the 2016 year average background level was the highest recorded here since Fukushima. The 2016 year average was 25% above pre-Fukushima recorded year average. At this Southern Hemisphere location, the local year average background has seen an increase in local background levels since Fukushima (see chart below). If we are seeing a steady increase in year averages here in the Southern Hemisphere, it suggests that locations in the Northern Hemisphere are seeing much greater yearly increases.
Year and month average local background radiation levels
http://sccc.org.au/yearly-average-background-radiation-levels
Disclaimer: This is an amateur volunteer run service. Human error can provide incorrect information, and equipment malfunction can produce false readings. Do not rely on, or take action upon information presented here, without further research.
2017/02/02 at 3:04 pm
Southern Hemisphere January 2017 Background Report.
Station location
http://sccc.org.au/monitoring/Australian-Map.jpg
This short animation of Northern and Southern Hemisphere air circulation, shows why we can get detections so far south.
http://www.youtube.com/watch?v=qh011eAYjAA
Caloundra day average chart for January 2017. (42% above average)
http://sccc.org.au/wp-content/uploads/2017/01/Caloundra-local-average-background-radiation-levels-January-2017.jpg
Caloundra January month average year comparisons.
2017 42% above pre-Fukushima average
2016 41% above pre-Fukushima average
2015 40% above pre-Fukushima average
2014 41% above pre-Fukushima average
2013 52% above pre-Fukushima average
2012 43% above pre-Fukushima average
Report:
January 2017 saw the usual post Fukushima, seasonal increase in background level, as warmer air flows from the tropics reach this location.
Year and month average local background radiation levels
http://sccc.org.au/yearly-average-background-radiation-levels
Disclaimer: This is an amateur volunteer run service. Human error can provide incorrect information, and equipment malfunction can produce false readings. Do not rely on, or take action upon information presented here, without further research.
December 20, 2016 at 3:20 pm
Southern Hemisphere Background Report For November 2016. (32% above average)
Station location
http://sccc.org.au/monitoring/Australian-Map.jpg
This short animation of Northern and Southern Hemisphere air circulation shows why we can get detections so far south.
http://www.youtube.com/watch?v=qh011eAYjAA
Caloundra day average chart for November 2016
http://sccc.org.au/wp-content/uploads/2016/11/Caloundra-local-average-background-radiation-levels-November-2016.jpg
Caloundra November month average year comparisons.
2016 32% above pre-Fukushima average
2015 37% above pre-Fukushima average
2014 29% above pre-Fukushima average
2013 30% above pre-Fukushima average
2012 31% above pre-Fukushima average
Report:
November 2016 had the the second highest month average local background since Fukushima. At the beginning of the month warm tropical air flows reached this location, this created the initial spike in local background levels. Background levels dropped for the rest of the month, as more Southern air flows reached this location, from the Southern Ocean.
Yearly average background radiation levels
http://sccc.org.au/yearly-average-background-radiation-levels
Disclaimer: This is an amateur volunteer run service. Human error can provide incorrect information, and equipment malfunction can produce false readings. Do not rely on, or take action upon information presented here, without further research.
Southern Hemisphere Background Report For October 2016. (22% above average)
Station location
http://sccc.org.au/monitoring/Australian-Map.jpg
This short animation of Northern and Southern Hemisphere air circulation shows why we can get detections so far south.
http://www.youtube.com/watch?v=qh011eAYjAA
Caloundra day average chart for October 2016
Caloundra October month average year comparisons.
2016 22% above pre-Fukushima average
2015 12% above pre-Fukushima average
2014 14% above pre-Fukushima average
2013 25% above pre-Fukushima average
2012 19% above pre-Fukushima average
Report:
There has been another up tick in background levels at this location for October 2016. This is the second highest October month average since the Fukushima nuclear catastrophe.
At this location in the winter months, air flows tend to come from the Southern Ocean, rather than from the tropical North. When this happens, local background levels tend to drop significantly, so compared to the summer months, winter local background levels approach pre-Fukushima levels. You can clearly see this seasonal variation in the yearly average background report, link below.
Yearly average background radiation levels
http://sccc.org.au/yearly-average-background-radiation-levels
Disclaimer: This is an amateur volunteer run service. Human error can provide incorrect information, and equipment malfunction can produce false readings. Do not rely on, or take action upon information presented here, without further research.
2016/10/06 at 5:52 pm
Southern Hemisphere Background Report For September 2016. (12% above average)
Station location
http://sccc.org.au/monitoring/Australian-Map.jpg
This short animation of Northern and Southern Hemisphere air circulation shows why we can get detections so far south.
http://www.youtube.com/watch?v=qh011eAYjAA
Caloundra day average chart for September 2016
Caloundra September month average year comparisons.
2016 12% above pre-Fukushima average
2015 5% above pre-Fukushima average
2014 6% above pre-Fukushima average
2013 15% above pre-Fukushima average
2012 13% above pre-Fukushima average
Report:
There has been a small up tick in background levels at this location for September. September 2013 and 2012 were the only years that had higher background levels here, since the Fukushima nuclear catastrophe.
At this location in the winter months, air flows tend to come from the Southern Ocean, rather than from the tropical North. When this happens, local background levels tend to drop significantly, so compared to the summer months, winter local background levels approach pre-Fukushima levels. You can clearly see this seasonal variation in the yearly average background report, link below.
Yearly average background radiation levels
http://sccc.org.au/yearly-average-background-radiation-levels
Disclaimer: This is an amateur volunteer run service. Human error can provide incorrect information, and equipment malfunction can produce false readings. Do not rely on, or take action upon information presented here, without further research.
2016/09/15 at 3:49 pm
Southern Hemisphere Background Report For August 2016. (8% above average)
Station location
http://sccc.org.au/monitoring/Australian-Map.jpg
This short animation of Northern and Southern Hemisphere air circulation shows why we can get detections so far south.
http://www.youtube.com/watch?v=qh011eAYjAA
Roof down pipe filter design for rainwater testing, http://sccc.org.au/down-pipe-filter-design
Caloundra day average chart for August 2016
http://sccc.org.au/wp-content/uploads/2016/08/Caloundra-local-average-background-radiation-levels-August-2016.jpg
Caloundra August month average year comparisons.
2016 8% above pre-Fukushima average
2015 5% above pre-Fukushima average
2014 4% above pre-Fukushima average
2013 8% above pre-Fukushima average
2012 9% above pre-Fukushima average
Report:
At this location in the winter months, air flows tend to come from the Southern Ocean, rather than from the tropical North. When this happens, local background levels tend to drop significantly, so compared to the summer months, winter local background levels approach pre-Fukushima levels. You can clearly see this seasonal variation in the yearly average background report, link below.
Yearly average background radiation levels
http://sccc.org.au/yearly-average-background-radiation-levels
Disclaimer: This is an amateur volunteer run service. Human error can provide incorrect information, and equipment malfunction can produce false readings. Do not rely on, or take action upon information presented here, without further research.
2016/08/08 at 5:31 pm
Southern Hemisphere Background Report For July 2016. (8% above average)
Station location
http://sccc.org.au/monitoring/Australian-Map.jpg
This short animation of Northern and Southern Hemisphere air circulation, shows why we can get detections so far south.
Roof down pipe filter design for rainwater testing, http://sccc.org.au/down-pipe-filter-design
Caloundra day average chart for July 2016
http://sccc.org.au/wp-content/uploads/2016/07/Caloundra-local-average-background-radiation-levels-July-2016.jpg
Caloundra July month average year comparisons.
2016 8% above pre-Fukushima average
2015 5% above pre-Fukushima average
2014 5% above pre-Fukushima average
2013 6% above pre-Fukushima average
2012 9% above pre-Fukushima average
Report:
At this location in the winter months, air flows tend to come from the Southern Ocean, rather than from the tropical North. When this happens, local background levels tend to drop significantly, so compared to the summer months, winter local background levels approach pre-Fukushima levels. You can clearly see this seasonal variation in the yearly average background report, link below.
Yearly average background radiation levels
http://sccc.org.au/yearly-average-background-radiation-levels
Disclaimer: This is an amateur volunteer run service. Human error can provide incorrect information, and equipment malfunction can produce false readings. Do not rely on, or take action upon information presented here, without further research.
2016/07/05 at 5:32 pm
Southern Hemisphere June 2016 Local Background Level Report, (7% above average)
Stations Location Map,
http://sccc.org.au/monitoring/Australian-Map.jpg
What the chart colour codes indicate in the charts.
http://sccc.org.au/what-does-each-step-in-the-alert-level-colour-code-mean
Report:
At this location in the winter months air flows tend to come from the Southern Ocean, rather than from the tropical North. When this happens local background levels tend to drop significantly, so compared to the summer months, winter local background levels approach pre-Fukushima levels. There was a small background level spike on the 19th of June. This occurred as a significant rain event passed over the area.
Caloundra day average chart for June 2016
http://sccc.org.au/wp-content/uploads/2016/06/Caloundra-local-average-background-radiation-levels-June-2016.jpg
Caloundra June month average year comparisons.
2016 7% above pre-Fukushima average
2015 3% above pre-Fukushima average
2014 7% above pre-Fukushima average
2013 7% above pre-Fukushima average
2012 3% above pre-Fukushima average
Long term local background information can be found here,
http://sccc.org.au/archives/2630
Disclaimer: This is an amateur volunteer run service. Human error can provide incorrect information, and equipment malfunction can produce false readings. Do not rely on, or take action upon information presented on this web site, without further research.
2016/06/27 at 6:02 pm
Southern Hemisphere May 2016 Rain Water Testing Results
Station location:
http://sccc.org.au/monitoring/Australian-Map.jpg
This short animation of Northern, and Southern Hemisphere air circulation, shows why we can get detections so far south.
http://www.youtube.com/watch?v=qh011eAYjAA
Roof down pipe filter design for rainwater testing,
http://sccc.org.au/down-pipe-filter-design
May 2016 down pipe rain water filter test report
There was 123 mm of rainfall in May, at this location.
Small amounts of Pb-210 and Be-7 where detected, plus a very small detection of a possible 77 X-ray from Lead Pb-212, which is the decay daughter of Radon-220. Beryllium Be-7 can be created naturally in trace amounts by spallation in the upper atmosphere by cosmic rays. Lead Pb-210 is the decay daughter of naturally occurring Radon-222 decay. Both Be-7 and Pb-210 can also be released from nuclear power plants, and nuclear accidents. The detection of the Pb-212 77 keV X-ray probably indicates the presents of a small trace of volcanic ash in the air.
May 2016 rain water filter test chart
http://sccc.org.au/wp-content/uploads/2016/06/Down-pipe-May-paper-filter-020616-TV7-18c-84600-B-text.png
2016/05/15 at 5:14 pm
Southern Hemisphere April 2016 Local Background Level Report, (33% above average)
Stations Location Map,
http://sccc.org.au/monitoring/Australian-Map.jpg
What the chart colour codes indicate in the charts.
http://sccc.org.au/what-does-each-step-in-the-alert-level-colour-code-mean
Day average chart for April 2016
Well, April 2016 had the highest April month average since records have been kept here. April, March and February this year have seen the highest April, March and February month averages since Fukushima. The wind direction this time of the year usually comes down the East Coast of Australia from the Northern tropics. The last few months have seen a lot of Eastern equatorial winds drawn South from the Eastern Pacific, and then directed up the East Coast of Australia.
In 2015 the year average background level dropped, to the lowest post Fukushima level. So what is creating the present up tick in background?
Caloundra April month average year comparisons.
2016 33% above pre-Fukushima average
2015 8% above pre-Fukushima average
2014 22% above pre-Fukushima average
2013 9% above pre-Fukushima average
2012 12% above pre-Fukushima average
Caloundra April day average chart,
Cairns April 2016 Report – “The readings were fairly flat throughout April. My baseline has slightly diminished from former 0.125 to 0.120 uSv/hr or even less.”
Thanks to the Cairn’s station operator for providing this day average Cairns and Caloundra comparison chart.
http://sccc.org.au/wp-content/uploads/2016/05/Cairns-Caloundra-comparison-for-April-2016.jpg
For comparison, long term average background level yearly and monthly charts from 2007 to 2016, can be found here.
http://sccc.org.au/yearly-average-background-radiation-levels
Long term local background information can be found here,
http://sccc.org.au/archives/2630
Disclaimer: This is an amateur volunteer run service. Human error can provide incorrect information, and equipment malfunction can produce false readings. Do not rely on, or take action upon information presented here, without further research.
2016/05/02 at 1:49 am
Alert Caloundra 1st May 2016 – Here is the day average and the 24hr charts, showing the spike in background coming through. This spike put the day average up to 47% above the pre-Fukushima average.
We had some heavy rain, the first in a long time. The wind direction was all over the place during the event. The next few days may indicate if there was some Geiger counter contamination present, as the monitoring GammaScout was given a clean out and inspection after this spike came through. Nothing obvious was found to indicate contamination was responsible for the spike in background.
Monitoring Site Location
http://sccc.org.au/monitoring/Australian-Map.jpg
Wind direction info,
http://www.bom.gov.au/products/IDQ60801/IDQ60801.94569.shtml
24 hour 60 second data logging chart,
http://sccc.org.au/wp-content/uploads/2016/05/Caloundra-24-hour-chart-010516.jpg
Long term local background can be found here,
https://www.enviroreporter.com/investigations/fukushima/radiation-station-sunshine-coast-australia/
2016/04/28 at 3:46 pm
Southern Hemisphere March 2016 down pipe rain water filter test.
Station location
http://sccc.org.au/monitoring/Australian-Map.jpg
This short animation of Northern and Southern Hemisphere air circulation, shows why we can get detections so far south.
http://www.youtube.com/watch?v=qh011eAYjAA
Roof down pipe filter design for rainwater testing,
http://sccc.org.au/down-pipe-filter-design
Report
There was a low 96mm of rainfall in March. The rain water testing has been consistent for months now, with the usual Pb-210 and Be-7 being detected, plus the detection of a possible 77 X-ray from Lead Pb-212, which is the decay daughter of Radon-220. Beryllium Be-7 can be created naturally in trace amounts by spallation in the upper atmosphere by cosmic rays. Lead Pb-210 is the decay daughter of naturally occurring Radon-222 decay. Both Be-7 and Pb-210 can also be released from nuclear power plants, and nuclear accidents.
The detection of the Pb-212 77 keV X-ray probably indicates the presence of a small trace of volcanic ash in the air.
March 2016 rain water filter test chart
http://sccc.org.au/wp-content/uploads/2016/04/Down-pipe-March-paper-filter-080416-TV7-26c-85760-B-text.png
Disclaimer: This is an amateur volunteer run service. Human error can provide incorrect information, and equipment malfunction can produce false readings. Do not rely on, or take action upon information presented here, without further research.
2016/04/09 at 1:55 pm
Southern Hemisphere Background Report For March 2016, (39% above average)
Stations Location Map,
http://sccc.org.au/monitoring/Australian-Map.jpg
What the chart colour codes indicate in the charts.
http://sccc.org.au/what-does-each-step-in-the-alert-level-colour-code-meanDay average chart for March 2016
http://sccc.org.au/wp-content/uploads/2016/03/Caloundra-local-average-background-radiation-levels-March-2016.jpg
Well, March 2016 had the highest March month average since records have been kept here. March and February this year have seen the highest March and February month averages since Fukushima. The wind direction this time of the year usually comes down the East Coast of Australia from the Northern tropics. The last two months have seen a lot of Eastern equatorial winds drawn South from the Eastern Pacific, and then directed up the East Coast of Australia.
Caloundra March month average year comparisons.
2016 39% above average
2015 33% above average
2014 31% above average
2013 32% above average
2012 24% above average
Cairns March 2016 Report – “Daily average radiation readings for last month March 2016 for Cairns (red) compared to your readings (orange). Readings were fairly steady, with a minor bump around the 20 – 24th of the month, which was associated with hot weather.”
Thanks to the Cairn’s station operator for providing this day average Cairns and Caloundra comparison chart.
http://sccc.org.au/wp-content/uploads/2016/04/Cairns-Caloundra-comparison-for-March-2016.jpg
For comparison, long term average background level yearly and monthly charts from 2007 to 2016, can be found here.
http://sccc.org.au/yearly-average-background-radiation-levels
Long term local background information can be found here,
https://www.enviroreporter.com/investigations/fukushima/radiation-station-sunshine-coast-australia/
Disclaimer: This is an amateur volunteer run service. Human error can provide incorrect information, and equipment malfunction can produce false readings. Do not rely on, or take action upon information presented here, without further research.
2016/03/21 at 6:01 pm
Southern Hemisphere Background Report For February 2016.
Station location
http://sccc.org.au/monitoring/Australian-Map.jpg
This short animation of Northern, and Southern Hemisphere air circulation, shows why we can get detections so far south.
http://www.youtube.com/watch?v=qh011eAYjAA
Roof down pipe filter design for rainwater testing, http://sccc.org.au/down-pipe-filter-design
Day average chart for Caloundra February 2016
http://sccc.org.au/wp-content/uploads/2016/02/Caloundra-local-average-background-radiation-levels-February-2016.jpg
Well, February 2016 had the highest month average since records have been kept here. This was a surprise to say the least considering the wind direction. The wind direction this time of the year usually comes down the East Coast of Australia, from the Northern tropics. Interestingly, most of the late February increases occurred when the wind direction was coming from South or SSE. Equatorial winds this year were drawn South from the Eastern Pacific, and then directed it up the East Coast of Australia. The East Coast of Australia surface wind direction for the later part of February is shown clearly at 2 minutes and 54 seconds into this Suspicious0bserver video.
.
https://www.youtube.com/watch?v=oCujdCaI0dI
Caloundra February month average year comparisons.
2016 – was 41% above the 4 year pre-Fukushima local average.
2015 – was 30% above the 4 year pre-Fukushima local average.
2014 – was 40% above the 4 year pre-Fukushima local average.
2013 – was 39% above the 4 year pre-Fukushima local average.
2012 – was 37% above the 4 year pre-Fukushima local average.
Cairns February 2016 Report – “My previous baseline used to be 0.125. Last month some readings were below the 0.120 mark. There were no extremes, both curves behave in a similar parallel fashion. Yesterday we had high temperatures and inland wind with thunderstorms, that increased the readings.”
Thanks to the Cairn’s station operator for providing this day average Cairns and Caloundra comparison chart. Cairns is red in this comparison chart, and Caloundra is yellow.
http://sccc.org.au/wp-content/uploads/2016/03/Cairns-Caloundra-comparison-for-February-2016.jpg
For comparison, long term average background level yearly and monthly charts from 2007 to 2016, can be found here.
http://sccc.org.au/yearly-average-background-radiation-levels
Disclaimer: This is an amateur volunteer run service. Human error can provide incorrect information, and equipment malfunction can produce false readings. Do not rely on, or take action upon information presented here, without further research.
2016/02/28 at 3:47 pm
Southern Hemisphere January 2016 down pipe rain water filter test
Station location
http://sccc.org.au/monitoring/Australian-Map.jpg
This short animation of Northern, and Southern Hemisphere air circulation, shows why we can get detections so far south.
http://www.youtube.com/watch?v=qh011eAYjAA
Roof down pipe filter design for rainwater testing,
http://sccc.org.au/down-pipe-filter-design
The background levels here went up significantly in late January 2016. There was 2.47 times as much rainfall in January 2016 (133.6 mm), compared to December 2015 (54mm). Even with the increased rainfall, the amount of Pb-210 captured for January and December in the rain water filter, was approximately the same.
Pb-210 is the end product of radon daughter decay. There was more Beryllium-7 detected in January 2016. This was probably created from spallation in the upper atmosphere, by recent solar storm activity. No detectable Cesium is being detected in the rain water filter tests.
January 2016 rain water test chart
http://sccc.org.au/wp-content/uploads/2016/02/Down-pipe-January-paper-filter-030216-TV7-28c-84600-Btext.png
It is important to understand that when you look at a scintillator test chart like the one above, the peak highs can be deceptive.
The Scintillator device used for testing the rain water filter, is less sensitive with increasing isotope energy.
For example the scintillator may have ~50% efficiency near the low energy Pb-210 peak and ~7% efficiency near the mid energy Be-7 peak. So the maths tells us, that more Be-7 was detected than its peak high would indicate!
At best, the above chart is showing what was detected, it does not quantifying the amount.
2016/01/31 at 8:38 pm
I just received the day average comparison chart of Cairns and Caloundra, for January 2016
The January day average peaks at Caloundra were less than those recorded for Cairns, see the Cairns and Caloundra Comparison chart below. Cairns is a lot closer to the equator than Caloundra.
Monitoring Stations Location Map,
http://sccc.org.au/monitoring/Australian-Map.jpg
Cairns January 2016 Report – “Some spikes at the beginning of January associated with very hot weather. The rest of the month stayed fairly flat, close to my baseline of 0.125 uSV/hr.”
Thanks to the Cairn’s station operator for providing this day average Cairns and Caloundra comparison chart. Cairns is red in this comparison chart, and Caloundra is yellow.
http://sccc.org.au/wp-content/uploads/2016/02/Cairns-Caloundra-comparison-for-January-2016.jpg
January 2016 Southern Hemisphere Background report (41% above average)
Alert Caloundra 31th January 2016 – The background here has seen a steady increase during January, reaching 64% above average on the 31st January. The 24 hour, 60 second logging chart for the day, showed a significant increase in background levels between 9am to 2.30pm. It was cloudy, but not raining at the time.
24 hour 60 second logging chart for the 31st January 2016
http://sccc.org.au/wp-content/uploads/2016/02/Caloundra-24-hour-chart-310116.jpg
Day average chart for January 2016
http://sccc.org.au/wp-content/uploads/2016/01/Caloundra-local-average-background-radiation-levels-January-2016.jpg
What the chart colour alert codes mean.
http://sccc.org.au/what-does-each-step-in-the-alert-level-colour-code-mean
Three minutes and 15 second into this Suspicious Observer video weather report, you will see the surface air flow turn down along the East Coast of Australia from the tropics. Generally we see increased background levels at the monitoring station here, in the warmer months, when we get more air flow from the tropics.
https://www.youtube.com/watch?v=glnLECyER6k
Long term local background information can be found here,
http://sccc.org.au/archives/2630
Disclaimer: This is an amateur volunteer run service. Human error can provide incorrect information, and equipment malfunction can produce false readings. Do not rely on, or take action upon information presented here, without further research.
BEGINNING 2016
END 2015
2016/01/07 at 3:44 pm
Southern Hemisphere 2015 Year Background Radiation Report.
Summary
2015 – was 18% above the 4 year pre-Fukushima local average.
2014 – was 20% above the 4 year pre-Fukushima local average.
2013 – was 22% above the 4 year pre-Fukushima local average.
2012 – was 21% above the 4 year pre-Fukushima local average.
In 2015 test results indicated some of the increase in November and December local background levels were possibly from increased Southern Hemisphere volcanic activity. Even taking this into account, the data indicates a gradual decline in local background atmospheric detections from the previous year’s peaks, since Fukushima.
Monitoring Station Location Map:
http://sccc.org.au/monitoring/Australian-Map.jpg
This short animation of Northern, and Southern Hemisphere air circulation, shows why we can get atmospheric detections so far south.
https://www.youtube.com/watch?v=qh011eAYjAA
I have also conducted a number of local beach sand, seaweed, and Pacific Ocean plankton tests. If any Fukushima Pacific Ocean Cesium contamination has reached this location, it is at levels below the detection sensitivity of the test equipment used here.
The scintillator test equipment used here is way more sensitive than an average Geiger counter, but it is not as sensitive as the very expensive test equipment available to research or university scientists.
Detailed local background level month and year charts from 2007 to 2015, can be found here.
http://sccc.org.au/yearly-average-background-radiation-levels
December 2015 down pipe rain water filter test
The December 2015 down pipe rain water filter test shows the usual Lead Pb-210 and Beryllium Be-7. December 2015 rainfall was 54mm. This is less than the rainfall for November 2015 76mm, but there was more Pb-210 detected in December.
December Rainwater Filter Chart
http://sccc.org.au/wp-content/uploads/2016/01/Paper-Towel-Filter-December-020116-TV67-22c-86286-B-text.png
November Rainwater Filter Chart
http://sccc.org.au/wp-content/uploads/2015/12/Down-pipe-November-paper-filter-031215-TV67-22c-84905-B.png
Disclaimer: This is an amateur volunteer run service. Human error can provide incorrect information, and equipment malfunction can produce false readings. Do not rely on, or take action upon information presented here, without further research.
2015/12/06 at 5:16 pm
Southern Hemisphere Rain Water test Report For November 2015
Considering the rainfall for October (77mm) and November (76mm) were very similar, the amount of Pb-210 detected for November 2015 was significantly greater than October. This suggests there was a lot more Radon-222 in the air here at Caloundra, during November.
Location Map
http://sccc.org.au/monitoring/Australian-Map.jpg
Rain Water Filter Test Chart
2015/12/01 at 8:46 pm
Southern Hemisphere Background Radiation Report For November 2015 (Full Report)
Monitoring Station Locations
http://sccc.org.au/monitoring/Australian-Map.jpg
At the beginning of November and again on the 14th November, a 40%+ increase in day average backgrounds levels were detected at my location on the East Coast Of Australia, near Brisbane. Tests were conducted to try an establish the source of the elevated background.
There were evening storms on the 14th, during one of these elevated background events, so a car rain swab was collected on the morning of the 15th November. The rain had been sitting on the car overnight. A scintillator test of it was started on the afternoon of the15th. It was tested for ~24 hours.
Radon is formed in the normal radioactive decay of Thorium which produces Radon-220, and Uranium which produces Radon-222. Both of these different Radon isotopes decay slowly into lead.
In the test chart you will see isotope maker peaks for Lead Pb-212 and an X-ray at 77 keV. These are decay daughters of Radon-220. This suggests that Thorium-232 was the source. There are also traces of Lead Pb-210, and Potassium-40. Lead Pb-210 is the decay daughter of Radon-222. This means there was also some Radon-222 in the air at the time.
The test detected trace amounts of Th-232 decay daughters, so the rain swab test chart only shows the tops of the main Th-232 decay daughter and X-ray peaks. A Thorium gas mantle test shows the main Thorium Th-232 decay daughter peaks. I have provided it as a reference. As you can see from the gas mantel test, the equipment here can separate the combined X-ray daughter peak around 89/90 keV, from the main 77 KeV peak.
November 15th Rain Swab Chart.
http://sccc.org.au/wp-content/uploads/2015/11/Rainswab-151115-TV67-22c-85854-B.png
Thorium Mantel Chart for Comparison
http://sccc.org.au/wp-content/uploads/2015/04/Thorium-mantle-TV67-calibration-110415-3000.jpg
Where is the Thorium-232 coming from?
Sources of atmospheric releases of Thorium-232 could be the recent Indonesian, New Zealand or South American volcanic eruptions, or a mining operation somewhere? There is a lot of volcanic activity in the Southern Hemisphere at present. Because the elevated detections where detected along the entire Eastern Coast of Australia, by numerous private monitoring stations, I am leaning towards volcanic activity, rather than a mining operation.
Cairns November 2015 Report – “After several months of very flat readings, last month had a number of peaks, with the increase starting the last week in October. It appears, the peaks coincide with higher altitude wind coming from the inland and usually very hot days.”
As you can see from the comparison chart below, Cairns had much more dynamic swings in background than Caloundra for November.
Cairns is red in this chart and Caloundra is yellow.
http://sccc.org.au/wp-content/uploads/2015/12/Cairns-Caloundra-comparison-for-November-2015.jpg
My opinion is that the November 2015 elevated detections are a combination of,
1. The increased background we get every year in the warmer months, as a result of Fukushima equatorial breakthrough.
+
2. An increase from recent Southern Hemisphere volcanic activity.
The local November month average background radiation for November 2014, 2013, and 2012, works out to 0.130 uSv. The volcanic activity, or whatever source created the recent increase, appears to have increased the November 2015 month average local background to 0.137 uSv.
These measurements are recorded by a GammaScout Alert Geiger counter, logging every 60 seconds. The data is downloaded and turned into a day average chart, and eventually a month average chart.
Here are month day average charts for November 2015, 2014, 2013, and 2012, local background radiation levels.
Day Average Chart November 2015
http://sccc.org.au/wp-content/uploads/2015/11/Caloundra-local-average-background-radiation-levels-November-2015.jpg
Day Average Chart November 2014
http://sccc.org.au/wp-content/uploads/2014/11/Caloundra-local-average-background-radiation-levels-November-2014.jpg
Day Average Chart November 2013
http://sccc.org.au/wp-content/uploads/2013/11/Caloundra-local-average-background-radiation-levels-November-2013.jpg
Day Average Chart November 2012
http://sccc.org.au/wp-content/uploads/2012/11/Caloundra-local-average-background-radiation-levels-November-20121.jpg
More details can be found here,
http://sccc.org.au/archives/2630
Disclaimer: This is an amateur volunteer run service. Human error can provide incorrect information, and equipment malfunction can produce false readings. Do not rely on, or take action upon information presented here, without further research.
2015/11/19 at 3:42 pm
Extreme UV levels here in Australia at present.
I suggest monitoring your local UV levels, as well as local radiation background now.
Chart of present Extreme local UV levels. ( Australians can find their local UV level information here, http://uv.willyweather.com.au/ )
http://sccc.org.au/wp-content/uploads/2015/11/UV-November-18th-to-20th-2015.png
Why are UV levels going so high?
The article below has a possible explanation. You will also find links to country based UV monitoring stations in this article.
Planetary Thermal Imbalance & Extreme UV Levels
http://www.sccc.org.au/extreme-uv-levels-in-summer
————————————————————–
Caloundra Early November 2015 Rain Water Test Report – At the beginning of November and again on the 14th November, elevated backgrounds levels were detected at my location on the East Coast of Australia, near Brisbane. Tests were conducted to try an establish the source of the elevated background.
http://sccc.org.au/wp-content/uploads/2015/11/Caloundra-local-average-background-radiation-levels-November-2015.jpg
There were evening storms on the 14th, during one of these elevated background events, so a car rain swab was collected on the morning of the 15th November. The rain had been sitting on the car overnight. A scintillator test of it was started on the afternoon of the15th. It was tested for ~24 hours.
Radon is formed in the normal radioactive decay of Thorium which produces Radon-220, and Uranium which produces Radon-222. Both of these different Radon isotopes decay slowly into lead.
https://en.wikipedia.org/wiki/Thoron
In the test chart you will see isotope maker peaks for Lead Pb-212 and an X-ray at 77 keV. These are decay daughters of Radon-220. This suggests that Thorium-232 was the source. There are also traces of Lead Pb-210, and Potassium-40. Lead Pb-210 is the decay daughter of Radon-222. This means there was also some Radon-222 in the air at the time.
The test detected trace amounts of Th-232 decay daughters, so the rain swab test chart only shows the tops of the main Th-232 decay daughter and X-ray peaks. A Thorium gas mantle test shows the main Thorium Th-232 decay daughter peaks. I have provided it as a reference. As you can see from the gas mantel test, the equipment here can separate the combined X-ray daughter peak around 89/90 keV, from the main 77 KeV peak.
November 15th Rain Swab Chart.
http://sccc.org.au/wp-content/uploads/2015/11/Rainswab-151115-TV67-22c-85854-B.png
Thorium Mantel Chart for Comparison
http://sccc.org.au/wp-content/uploads/2015/04/Thorium-mantle-TV67-calibration-110415-3000.jpg
Where is the Thorium-232 coming from?
If it was from Fukushima, I would expect to see other Fukushima isotope markers present. Sources of atmospheric releases of Radon-220 could be the recent Indonesian, New Zealand or South American volcanic eruptions, or a mining operation somewhere? There is a lot of volcanic activity in the Southern Hemisphere at present. On the Emergency and Disaster Information Service map, you can see the locations of erupting volcanoes in South America, New Zealand and Indonesia.
http://hisz.rsoe.hu/alertmap/index2.php
Because the elevated detections where detected along the entire Eastern Coast of Australia, by numerous private monitoring stations, I am leaning towards volcanic activity, rather than a mining operation.
—————————————————————–
Southern Hemisphere October 2015 Rain Water Test Report.
As usual, Lead Pb-210 and Beryllium Be-7 were the main isotopes detected in the rainwater filter. Rainfall for October was 77 mm.
http://sccc.org.au/wp-content/uploads/2015/11/Down-pipe-October-paper-filter-121115-TV67-22c-84904-B.png
Disclaimer: This is an amateur volunteer run service. Human error can provide incorrect information, and equipment malfunction can produce false readings. Do not rely on, or take action upon information presented here, without further research.
2015/11/14 at 11:06 pm
Southern Hemisphere November Background Increase.
Summary:
There was a general increase in background levels detected by multiple stations in the Southern Hemisphere, in early November. In local rain swab tests, trace amounts of Iodine-129 and Lead-210 where detected, plus Radon-220 and Radon-222 washout decay daughters. The live Radon monitor reached a peak of ~ 1.8 pCi/Lt on the 14th November, during the storm event.
November 2015 Multi Station Detailed Reports:
Alert Caloundra 3rd November 2015 – It was 42% above pre-Fukushima average level on the 3rd November. This is the first alert level since March 2015.
Note: This alert code system here, is not based on any official government alert system. It is one set up by the station operator to indicate significant local increases.
http://sccc.org.au/what-does-each-step-in-the-alert-level-colour-code-mean
From previous testing, when we reach alert levels here, rain events can cause large radon washouts. We haven’t seen any studies on the heath effects of being exposed to very large Radon washouts. It is suggested, if possible, to stay out of the rain when we have local monitoring station alert levels, and if you do get wet, have a shower when you get home.
http://sccc.org.au/wp-content/uploads/2014/10/Radon_Info_ENG.pdf
Day average background level chart,
http://sccc.org.au/wp-content/uploads/2015/11/Caloundra-local-average-background-radiation-levels-November-2015.jpg
Dunedin New Zealand Report 4th November – “What is going on? Levels here from 0.8 to 1.6 pico Curies per litre, and rising …” This is a live Radon monitor detection.
Caloundra 8th November 2015 – Conducting a maintenance check on the GammaScout Geiger counter that is used to collect the day average background here, to confirm that these recent local elevated November detections are not caused by equipment fault, or from dust contamination.
I did find a small white fleck of material on the mica window which I brushed off with a very soft brush. I also cleaned out the whole unit, plus cleaned around the location where GammaScout is located. I also checked all the circuitry for damage, and the possibility that an insect got fried in the high voltage circuit area. An insect short would cause circuit malfunction, and erroneous detections. It all checked out OK. The next data download on the 9th November may confirm if the background elevation was caused by dust contamination, or from the particle found on the mica window.
Caloundra 9th November 2015 – The 24hour chart for the 8th shows a drop in background around 8.30am, after the monitoring Geiger counter was cleaned. Unfortunately there was a significant change in wind direction at the time. Wind started coming from the South, where as before it was manly from the North.
Therefore it is not conclusive at this time, if the Geiger counter cleaning, or the wind change caused the significant drop in background levels, from a day average of 0.148 uSv/hr on the 7th to 0.133 uSv/hr on the 8th.
Cairns 9th November 2015 Report – “My readings in Cairns for yesterday also went up to 0.147 uSv/hr. Will keep an eye on it and will let you know of further development.”
Cairns 10th November 2015 Report – “The reading for Cairns yesterday increased further to 0.166 uSv/hr. The highest reading since Jan this year. I am charging the battery at the beginning of each month, so that should eliminate any problems with that. Will keep you informed about further development.”
Cairns is red in this chart and Caloundra is yellow.
http://sccc.org.au/wp-content/uploads/2015/11/Cairns-Nov-15.jpg
Cairns 11th November 2015 Report – “Yesterdays reading was down to normal again at 0.125uSv/hr.”
Alert Caloundra 14th November 2015 – It was 43% above pre-Fukushima average level on the 14th November. There were a series of thunder storms that passed over the area, followed by heavy rain, that came from the South West in the evening. The local live monitors here showed elevated background levels for most of the day. When the storms passed over, the background level peaked.
Southern Hemisphere updates can be found here,
http://sccc.org.au/archives/2630
Disclaimer: This is an amateur volunteer run service. Human error can provide incorrect information, and equipment malfunction can produce false readings. Do not rely on, or take action upon information presented here, without further research.
2015/10/19 at 5:25 pm
Southern Hemisphere September 2015 Rain Water Test Report.
The test equipment has had an upgrade.
For testing until now, a Gamma Spectacular GS-1100A sound card spectrometry driver was plugged into the mic input of a laptop. This laptop mic input could only sample the test signal up to 96K 16 bit. A external Xonar USB sound card is now being used instead of the standard laptop microphone input.
This means the test signal can now be sampled at 192k 24 Bit. This has resulted in a significant improvement in sensitivity, particularly at low keV energies.
A paper towel rain filter design was used again this month, rather than the polyester filter used previously. This paper towel filter was sun dried for a longer period than last months filter, so it had less moisture content when tested.
Filter Design: http://sccc.org.au/down-pipe-filter-design
As usual, Lead Pb-210 than Beryllium Be-7 were the main isotopes detected rainwater filter. Rainfall for September was 59 mm.
http://sccc.org.au/wp-content/uploads/2015/10/Down-pipe-September-paper-filter-131015-TV67-20c-84600-B.png
Previous Rain water and soil tests can be found here.
http://sccc.org.au/pages/The-Food-Lab.html#Local_Rain_Water
2015/10/05 at 4:23 pm
Southern Hemisphere Background Radiation Report For September 2015
September 2015 Summary
September 2015 monthly average background radiation level was 5% above the pre-Fukushima average. This is considerably lower than the September 2012 and 2013 average.
Caloundra Australia September day average chart:
http://sccc.org.au/wp-content/uploads/2015/09/Caloundra-local-average-background-radiation-levels-September-2015.jpg
September average for 2014 was 5% above the pre-Fukushima average.
September average for 2013 was 15% above the pre-Fukushima average.
September average for 2012 was 13% above the pre-Fukushima average.
Cairns Report:
Cairns is on the east coast of Australia, and it is much closer to the equator than Caloundra, see location map.
http://sccc.org.au/monitoring/Australian-Map.jpg
Here is the Caloundra and Cairns September day average background comparison chart.
Thanks again to the Cairns station operator for this report, and chart.
“The readings stayed close to my baseline of 0.125 uSV/hr for the whole month. Glad, nothing of significance to report. Yours also look pretty parallel to mine.”
In the chart, Cairns is red and Caloundra yellow.
http://sccc.org.au/wp-content/uploads/2015/10/Cairns-Caloundra-comparison-for-September-2015.jpg
————————————————————————
The Caloundra year average charts show a consistent seasonal variation in background levels since Fukushima. Most of the equatorial barrier air flow break through between the Northern and Southern hemispheres, happen in the warmer months. On this page you will find all the month and year average charts for local background radiation levels, from November 2007 to 2015 for Caloundra.
http://sccc.org.au/yearly-average-background-radiation-levels
Disclaimer: This is an amateur volunteer run service. Human error can provide incorrect information, and equipment malfunction can produce false readings. Do not rely on, or take action upon information presented here, without further research.
2015/09/07 at 4:58 pm
Southern Hemisphere August 2015 Rain Water Test Report
I used part of a paper towel roll for the rain water filter this month, instead of the usual polyester wool filter. The theory is that it may capture more soluble material than the polyester wool. A test result similar to the polyester filter was observed, only very small traces of Lead-210 and Beryllium-7 were captured. The exception being that the cellulose and water content of the paper appeared to be filtering out very low energy X-rays.
A bit more rain fell this month compared to last month, 159mm for August.
This clean paper towel filter was tested in the lead shielded test chamber for 24 hours, and that test result was then used for background subtraction from the used filter test result.
Here is the test chart minus that background.
http://sccc.org.au/wp-content/uploads/2015/09/Down-pipe-August-paper-filter-030915-TV67-20c-84600-B-text.png
Disclaimer: This is an amateur volunteer run service. Human error can provide incorrect information, and equipment malfunction can produce false readings. Do not rely on, or take action upon information presented here, without further research.
2015/09/01 at 8:30 pm
Southern Hemisphere Background Radiation Report For August 2015
August 2015 Summary
More good news here at Caloundra, there haven’t been any significant upticks or events to report for months now, plus the background levels have stabilized. The background levels are not at pre-Fukushima levels, but close.
August 2015 monthly average background radiation level was 5% above the pre-Fukushima average.
August day average chart:
http://sccc.org.au/wp-content/uploads/2015/08/Caloundra-local-average-background-radiation-levels-August-2015.jpg
August average for 2014 was 4% above the pre-Fukushima average.
August average for 2013 was 8% above the pre-Fukushima average.
August average for 2012 was 9% above the pre-Fukushima average.
Caloundra and Cairns August day average background comparison chart – Thanks again to the Cairns station operator for this chart and report. Cairns is on the east coast of Australia, and it is much closer to the equator than Caloundra, see location map.
http://sccc.org.au/monitoring/Australian-Map.jpg
Cairns Monitoring Station Report:
“I noticed increasing readings in the last week of the month and got a lot of alarms set at 0.4 uSV/hr during the day.
I thought it might be a good idea to top up the battery charge, getting that many alarms.
As soon as I started to charge the battery, the alarms stopped immediately and the readings went back close to my baseline of 0.125 uSv/hr.
So I regard the last weeks increased readings as questionable, after observing the above behaviour.
You also might want to take notice of this particular equipment behaviour of the Gamma Scout Rechargeable for future reference.”
In the chart, Cairns is red and Caloundra yellow.
http://sccc.org.au/wp-content/uploads/2015/09/Cairns-Caloundra-comparison-for-August-2015.jpg
On this page you will find all the month and year average charts, for local background radiation levels from November 2007 to 2015.
http://sccc.org.au/yearly-average-background-radiation-levels
More detailed long term data can be found here.
http://sccc.org.au/archives/2630
Disclaimer: This is an amateur volunteer run service. Human error can provide incorrect information, and equipment malfunction can produce false readings. Do not rely on, or take action upon information presented here, without further research.
2015/08/08 at 5:52 pm
Southern Hemisphere July 2015 Rain Water Test Report
Station location
http://sccc.org.au/monitoring/Australian-Map.jpg
This short animation of Northern, and Southern Hemisphere air circulation, shows why we can get detections so far south.
http://www.youtube.com/watch?v=qh011eAYjAA
Roof down pipe filter design for rainwater testing,
http://sccc.org.au/down-pipe-filter-design
32.5 mm rain fell in July, and the chart shows very small traces of the usual Pb-210 and Be-7. In this chart I have CPS on the Y axis to show activity, and have turned off Y log to show linear scaling. This is only a test chart of the polyester part of the rain water filter system design.
Chart normal view minus Background
http://sccc.org.au/wp-content/uploads/2015/08/Down-pipe-July-polyester-filter-020815-TV67-18c-87206-B.jpg
Disclaimer: This is an amateur volunteer run service. Human error can provide incorrect information, and equipment malfunction can produce false readings. Do not rely on, or take action upon information presented here, without further research.
2015/08/02 at 4:57 pm
Southern Hemisphere Background Radiation Report For July 2015
July 2015 Summary
The good news is that local background levels here have stabilized, and there haven’t been any significant upticks, or events to report.
July 2015 monthly average background radiation level was 5% above the pre-Fukushima average.
July day average chart:
http://sccc.org.au/wp-content/uploads/2015/07/Caloundra-local-average-background-radiation-levels-July-2015.jpg
July average for 2014 was 5% above the pre-Fukushima average.
July average for 2013 was 5% above the pre-Fukushima average.
July average for 2012 was 9% above the pre-Fukushima average.
Caloundra and Cairns July day average background comparison chart – Cairns is on the east coast of Australia, and it is much closer to the equator than Caloundra, see location map.
http://sccc.org.au/monitoring/Australian-Map.jpg
In the background comparison chart, Cairns is red and Caloundra yellow.
http://sccc.org.au/wp-content/uploads/2015/08/Cairns-Caloundra-comparison-for-July-2015.jpg
On this page you will find all the month and year average charts, for local background radiation levels from November 2007 to 2015.
http://sccc.org.au/yearly-average-background-radiation-levels
Disclaimer: This is an amateur volunteer run service. Human error can provide incorrect information, and equipment malfunction can produce false readings. Do not rely on, or take action upon information presented here, without further research.
2015/07/13 at 10:10 pm
Southern Hemisphere June 2015 Rain Water Test Report.
There was a lot of very fine organic material captured in the down pipe rain water filter in June.
Roof down pipe filter design for rainwater testing, http://sccc.org.au/down-pipe-filter-design
There was also a lot less Lead Pb-210 than Beryllium Be-7 in June’s rainwater filter test. In summer we tend to see much more Pb-210 detected in the rain water tests here, when the air masses tend to come from a northerly direction.
There was also a possible trace detection of Cesium-137. It was a very small detection, less than one Cesium-137 gamma ray detection every ~100 seconds. There was no corresponding Cesium-137 32 X-ray detection to help confirm that it was Cesium-137. At these low detection levels, the amount of low energy 32 keV Cesium-137 X-ray present, may be too small to be detected, so there is a degree of uncertainty to it being a definitive Cesium-137 detection.
Rainfall for June was 78.2 mm.
Less Pb-210 in the filter means less Radon-222 was in the air. This was also reflected in the local live Radon monitor.
http://sccc.org.au/wp-content/uploads/2015/07/Down-pipe-June-polyester-filter-dried-test-120715-TV67-18c-84612-B-text.png
Years of rain water tests can be found here.
https://www.enviroreporter.com/investigations/fukushima/radiation-station-sunshine-coast-australia/
Disclaimer: This is an amateur volunteer run service. Human error can provide incorrect information, and equipment malfunction can produce false readings. Do not rely on, or take action upon information presented here, without further research.
2015/07/04 at 5:11 pm
Southern Hemisphere Background Radiation Report For June 2015.
Station location
http://sccc.org.au/monitoring/Australian-Map.jpg
This short animation of Northern, and Southern Hemisphere air circulation, shows why we can get detections so far south.
http://www.youtube.com/watch?v=qh011eAYjAA
Roof down pipe filter design for rainwater testing, http://sccc.org.au/down-pipe-filter-design
June 2015 Summary
June 2015 saw a decrease in month average background levels compared to the last couple of years. June saw more Southern Ocean air reach this location, hence the lower background level. A number of significant solar radiation storms occurred in June. No significant increases in local background radiation levels were detected during these solar storm events.
June 2015 monthly average background radiation level was 3% above the pre-Fukushima average.
June day average chart:
http://sccc.org.au/wp-content/uploads/2015/06/Caloundra-local-average-background-radiation-levels-June-2015.jpg
June average for 2014 was 7% above the pre-Fukushima average.
June average for 2013 was 7% above the pre-Fukushima average.
June average for 2012 was 3% above the pre-Fukushima average.
Caloundra and Cairns June day average background comparison chart
Cairns is on the east coast of Australia, and it is much closer to the equator than Caloundra. It is much more likely to get Northern air flows during the cooler months than Caloundra, see location map.
Comment by Cairns station operator:
“The readings stayed fairly close to my longer term baseline of 0.125 uSv/hr. The solar events affecting earth around the 20th of June, did not have any noticeable influence on the readings.”
In this chart, Cairns is red and Caloundra yellow.
http://sccc.org.au/wp-content/uploads/2015/07/Cairns-Caloundra-comparison-for-June-2015.jpg
On this page you will find all the month and year average charts, for local background radiation levels from November 2007 to 2015. The most recent data suggests the amount of airborne contamination reaching this location has decreased significantly.
http://sccc.org.au/yearly-average-background-radiation-levels
Disclaimer: This is an amateur volunteer run service. Human error can provide incorrect information, and equipment malfunction can produce false readings. Do not rely on, or take action upon information presented here, without further research.
2015/06/08 at 3:35 pm
Southern Hemisphere Background Radiation Report For May 2015.
Station location
http://sccc.org.au/monitoring/Australian-Map.jpg
This short animation of Northern, and Southern Hemisphere air circulation, shows why we can get detections so far south.
http://www.youtube.com/watch?v=qh011eAYjAA
May 2015 Summary
May 2015 saw a decrease in month average background levels compared to the last three years. When Southern Ocean air reaches this location, we see lower background averages. More Southern Ocean air reaches this location in the cooler months and winter, hence the significant seasonal variation in background levels. This May has seen significant Southern Ocean air flows.
May 2015 monthly average background radiation level was 4% above the pre-Fukushima average.
May day average chart:
http://sccc.org.au/wp-content/uploads/2015/05/Caloundra-local-average-background-radiation-levels-May-2015.jpg
May average for 2014 was 13% above the pre-Fukushima average.
May average for 2013 was 7% above the pre-Fukushima average.
May average for 2012 was 7% above the pre-Fukushima average.
Here is an May 2015 comparison chart between Cairns and Caloundra, from the station operator located near Cairns. Cairns is on the east coast of Australia, and it is much closer to the equator than Caloundra. It is much more likely to get Northern air flows during the cooler months than Caloundra, see location map. In the chart, Cairns is red and Caloundra yellow.
Thanks to the North Queensland monitoring station operator for creating this chart. “The two bumps in the graph were coincidental with winds coming from the inland, from NW, instead of the predominantly SE airflow from the Pacific.”
http://sccc.org.au/wp-content/uploads/2015/06/Cairns-Caloundra-comparison-for-May-2015.jpg
On this page you will find all the month and year average charts, for local background radiation levels from November 2007 to 2015. The most recent data suggests the amount of airborne contamination reaching this location has decreased significantly.
http://sccc.org.au/yearly-average-background-radiation-levels
More detailed long term data can be found here.
http://sccc.org.au/archives/2630
Southern Hemisphere May 2015 Rain Water Test Report.
The May rainfall test chart shows the rainwater filter captured a lot less Lead Pb-210 and Beryllium Be-7.
Rainfall for May was 103.2 mm.
Background level saw a decrease this month, and this is reflected in the fact that less Lead Pb-210 and Beryllium Be-7 were detected in the filter.
Less Pb-210 in the filter means less Radon-222 was in the air. This was also reflected in the local live Radon monitor.
http://sccc.org.au/wp-content/uploads/2015/06/Down-pipe-May-polyester-filter-dried-test-020615-TV67-20c-84600-B.png
In the warmer months I will try a new filter design. I don’t think the polyester and carbon filters are very efficient at capturing water soluble salts.
Years of rain water tests can be found here.
http://sccc.org.au/pages/The-Food-Lab.html#Local_Rain_Water
Disclaimer: This is an amateur volunteer run service. Human error can provide incorrect information, and equipment malfunction can produce false readings. Do not rely on, or take action upon information presented here, without further research.
2015/05/17 at 8:24 pm
Southern Hemisphere Rain Water Report For April 2015.
Station location
http://sccc.org.au/monitoring/Australian-Map.jpg
This short animation of Northern, and Southern Hemisphere air circulation, shows why we can get detections so far south.
http://www.youtube.com/watch?v=qh011eAYjAA
Tritium Detection?
I delayed publishing the April 2015 rain water report because of ongoing technical discussion regarding the possible detection of Tritium, in this months water filter test.
There are very small amounts of naturally occurring Tritium in the atmosphere. It can be created in trace amounts by spallation in the upper atmosphere, by cosmic rays or from releases from a nuclear power plant or nuclear accident.
It is only conjecture at this point that it is Tritium, and has not been confirmed. It could equally be another isotope, or a technical issue with the equipment at these very low energy keV detection levels.
Both Iodine I-129, and Beryllium Be-7, which were detected in this months water filter test can also be created by spallation in the upper atmosphere, by cosmic rays or from releases from a nuclear power plant or nuclear accident.
There was a lot of solar storm activity last month, and it takes around two weeks for spallation products to reach the surface of the planet.
Lead Pb-210 is the decay daughter of naturally occurring Radon decay. It can also be released from a nuclear power plant, or nuclear accident. At present there is no conclusive evidence that any of the latest isotope detections here at this location are from Fukushima.
For those who are interested, more technical discussion about the possible Tritium detection can be found here,
http://www.gammaspectacular.com/phpBB3/viewtopic.php?f=5&t=45
Years of local rain water, and rain swab test results can be found here.
https://www.enviroreporter.com/investigations/fukushima/radiation-station-sunshine-coast-australia/
Disclaimer: This is an amateur volunteer run service. Human error can provide incorrect information, and equipment malfunction can produce false readings. Do not rely on, or take action upon information presented here, without further research.
2015/05/09 at 9:48 pm
Southern Hemisphere Background Radiation Report for April 2015.
Station location map
http://sccc.org.au/monitoring/Australian-Map.jpg
This short animation of Northern, and Southern Hemisphere air circulation, shows why we can get detections so far south.
http://www.youtube.com/watch?v=qh011eAYjAA
April 2015 Summary
April 2015 saw a decrease in month average background levels compared to the last three years. When Southern Ocean air reaches this location, we see lower background averages. More Southern Ocean air reaches this location in the cooler months and winter, hence the significant seasonal variation in background levels. This April has seen significant Southern Ocean air flows.
April 2015 monthly average background radiation level was 8% above the pre-Fukushima average.
April Day Average Chart:
http://sccc.org.au/wp-content/uploads/2015/04/Caloundra-local-average-background-radiation-levels-April-2015.jpg
April average for 2014 was 22% above the pre-Fukushima average.
April average for 2013 was 9% above the pre-Fukushima average.
April average for 2012 was 12% above the pre-Fukushima average.
Here is an April 2015 comparison chart between Cairns and Caloundra, from the station operator located near Cairns. Cairns is on the east coast of Australia, and it is much closer to the equator than Caloundra. It is much more likely to get Northern air flows during the cooler months than Caloundra, see location map. In the chart, Cairns is red and Caloundra yellow.
Thanks to the North Queensland monitoring station operator for creating this chart.
http://sccc.org.au/wp-content/uploads/2015/05/Cairns-Caloundra-April-2015-background-radiation-level-comparison.jpg
To make it easier to compare year and month background averages, I have created this page.
http://sccc.org.au/yearly-average-background-radiation-levels
On this page you will find all the month and year average charts, for local background radiation levels from November 2007 to 2015 for Caloundra. Historically, the recorded pre-Fukushima local background here was low, averaging around ~0.1 uSv/hr. This data has allowed the tracking of changes in local background levels, plus the detection of radioactive clouds passing through.
The most recent data suggests the amount of airborne contamination reaching this location, has decreased significantly.
http://sccc.org.au/yearly-average-background-radiation-levels
More detailed long term data can be found here.
https://www.enviroreporter.com/investigations/fukushima/radiation-station-sunshine-coast-australia/
Disclaimer: This is an amateur volunteer run service. Human error can provide incorrect information, and equipment malfunction can produce false readings. Do not rely on, or take action upon information presented here, without further research.
2015/04/05 at 5:47 pm
Southern Hemisphere March 2015 Background Radiation Report.
Station location
http://sccc.org.au/monitoring/Australian-Map.jpg
This short animation of Northern, and Southern Hemisphere air circulation, shows why we can get detections so far south.
http://www.youtube.com/watch?v=qh011eAYjAA
March 2015 Summary
There was an increase in the March month average background levels.
March 2015 monthly average background radiation level was 33% above the pre-Fukushima average.
March average for 2014 was 31% above the pre-Fukushima average.
March average for 2013 was 32% above the pre-Fukushima average.
March average for 2012 was 24% above the pre-Fukushima average.
Technical details:
Around the 19th March Earth had a G4 level geomagnetic storm, the largest Geomagnetic solar storm to hit Earth for a long time.
http://sccc.org.au/wp-content/uploads/2015/03/Geomagnetic_-storm_18_19_March_2015.png
It did not significantly affect the background levels here, see 24 hour chart for the 18th March.
http://sccc.org.au/wp-content/uploads/2015/03/Caloundra-Australia-24-hour-local-radiation-background-chart-180315.jpg
and day average chart.
http://sccc.org.au/wp-content/uploads/2015/03/Caloundra-local-average-background-radiation-levels-March-2015.jpg
This proves that background here, near sea level, is not greatly influenced by solar storms. At least to a G4 solar storm level rating.
———————————-
From the station operator located near Cairns. Cairns on the east coast of Australia, is much closer to the equator than Caloundra.
“As you mentioned before, there was no noticeable influence on the readings, by the solar events we had during last month. Since the last cyclones, my readings here were quite flat and steady. That’s what I like to see….”
A comparison chart of Cairns (Red) and Caloundra (Yellow) background levels for March 2015.
http://sccc.org.au/wp-content/uploads/2015/04/Rad-March-R-Cairns-Y-Caloundra.jpg
———————————-
Towards the end of March the background levels at Caloundra went through dynamic swings. This significant drop in background occurred during a rain event here. The 22nd March had 32.4mm of rain, and 23rd, 24.2 mm. Rain does not necessarily bring fallout with it. It depends what directions the surface wind and rain are coming from.
(Note: The 4yr average referred to in the charts, is the 4yr pre-Fukushima average.)
What the coloured alert levels, in the bar charts indicate.
http://sccc.org.au/what-does-each-step-in-the-alert-level-colour-code-mean
March 2015 (33% above month average)
http://sccc.org.au/wp-content/uploads/2015/03/Caloundra-local-average-background-radiation-levels-March-2015.jpg
March 2014 (31% above month average)
http://sccc.org.au/wp-content/uploads/2014/03/Caloundra-local-average-background-radiation-levels-March-2014.jpg
March 2013, (32% above month average)
http://sccc.org.au/wp-content/uploads/2013/03/Caloundra-local-average-background-radiation-levels-March-2013.jpg
March 2012 (24% above month average)
http://sccc.org.au/wp-content/uploads/2012/04/Caloundra-local-average-background-radiation-levels-March-2012.jpg
Disclaimer: This is an amateur volunteer run service. Human error can provide incorrect information, and equipment malfunction can produce false readings. Do not rely on, or take action upon information presented here, without further research
2015/03/05 at 3:09 pm
Southern Hemisphere February 2015 Background Radiation Report.
Station location
http://sccc.org.au/monitoring/Australian-Map.jpg
This short animation of Northern, and Southern Hemisphere air circulation, shows why we can get detections so far south.
http://www.youtube.com/watch?v=qh011eAYjAA
February 2015 Background Summary
Pretty much the same as last month. We see a drop in the month average background level for February 2015, and the rain water test shows manly Beryllium Be-7, and Lead Pb-210. The traces Iodine I-129 and Uranium U-235 showing up in the previous years rain water tests, are now below the reliable detection levels of the equipment here.
The good news is that background levels here have stabilized, at least at this location in the Southern Hemisphere. I still detect the occasional event. These detection events are generally not as large, or as frequent as previous years.
February 2015 monthly average background radiation level was 30% above the pre-Fukushima average.
February average for 2014 was 40% above the pre-Fukushima average.
February average for 2013 was 39% above the pre-Fukushima average.
February average for 2012 was 37% above the pre-Fukushima average.
Technical details:
(Note: The 4yr average referred to in the charts, is the 4yr pre-Fukushima
average.)
What the coloured alert levels, in the bar charts indicate.
http://sccc.org.au/what-does-each-step-in-the-alert-level-colour-code-mean
February 2015 (30% above month average)
http://sccc.org.au/wp-content/uploads/2015/02/Caloundra-local-average-background-radiation-levels-February-2015.jpg
February 2014 (40% above month average)
http://sccc.org.au/wp-content/uploads/2014/02/Caloundra-local-average-background-radiation-levels-February-2014.jpg
February 2013 (39% above month average)
http://sccc.org.au/wp-content/uploads/2013/02/Caloundra-local-average-background-radiation-levels-February-2013.jpg
February 2012 (37% above month average)
http://sccc.org.au/wp-content/uploads/2012/04/Caloundra-local-average-background-radiation-levels-February-2012.jpg
February 2015 Rain Water Test Report
Summary:
February rainfall was 426.6mm.
Beryllium Be-7 can be made by spallation in the upper atmosphere, during solar events, and takes around two weeks to reach the surface. Lead Pb-210 is a decay daughter of Radon Rn-222. Both these isotopes can also be released from a
Nuclear accident.
Roof down pipe filter design for rain water testing.
http://sccc.org.au/down-pipe-filter-design
Rain Filter Test Chart (The chart is minus background.)
In this chart I have CPS on the Y axis to show activity, and have turned off Y log to show linear scaling. This is only a test chart of the polyester part of the rain water filter system design. The Polyester filter actually captured more than the carbon filter.
Chart
http://sccc.org.au/wp-content/uploads/2015/03/Down-pipe-February-polyester-filter-test-030315-TV67-26c-86029-B-text.jpg
Previous rain water and soil tests can be found here.
http://sccc.org.au/pages/The-Food-Lab.html#Soil%20Testing%20Results
2015/02/22 at 8:17 pm
Do cyclones draw Fukushima radioactive air contamination through the equatorial barrier, into the Southern Hemisphere?
Caloundra (Queensland Australia) 22th February 2015 – The remnants of Tropical Cyclone Marcia came and went, the day average background here actually dropped then rose.
http://sccc.org.au/wp-content/uploads/2015/02/Caloundra-local-average-background-radiation-levels-February-2015.jpg
The dip in the day average occurred a day before the degraded Cyclone Marcia was closest to here. We had around 330 mm rain over a few days. This suggests whatever was in the air was being washed out.
Geiger counter testing of a car bonnet rain swab collected on the 20th, 630 cpm or ~1.0 uSv/hr. Not nearly as high as other rain event tests.
When placed in the scintillator there was very little Radon-222 present, again not nearly as high as previous rain swab tests. The rain swab is also not showing any significant Be-7 or Pb-210, as recent rain test have shown. Radon levels were low averaging around ~ 0.5 pCi/l over that period. As the tail of Cyclone Marcia left the area we had a wave of radiation pass through. Haven’t seen this type of radioactive cloud stand out event since late 2011, 2012, and 2013.
Here is the 24 hour chart.
(Caloundra is in Southern Queensland and Cairns is in Northern Queensland Australia.)
Report from a contact near Cairns in North Queensland, 20th February 2015
“I would like to report an unusual event yesterday. Yesterday 20. Feb 15 between 17:00 and 18:00 the alarm set at 0.400 uSv on my Gamma Scout kept sounding continuously. The daily average reading after midnight was 0.167 uSv, a value, that I have never had that high since I started using the instrument about a year ago. As per this morning, the readings still persist around the 0.150 to 0.160 uSv mark. There does not appear to have been any serious solar events. The weather here has been sunny, up to 33 C hot and humid.”
Chart
http://sccc.org.au/wp-content/uploads/2015/02/Cairns-February-2015.jpg
Category 4 cyclone Lam also hit the Northern Territory of Australia, as category 5 Tropical Cyclone Marcia hit Queensland Australia. For two cyclones to hit Australia at the same time is very unusual.
Southern Hemisphere 2014 Year Report
The good news at present is that background levels here have stabilized. We still occasionally get significant peaks, but these events are not now as common as in 2011, 2012, and 2013.
For four years before Fukushima a GammaScout Geiger counter logged once a week local background radiation levels. The averaged over that time was ~ 0.1 uSv/hour. This data has allowed a comparison of background levels before, and after Fukushima.
Pre-Fukushima 2007 to 2011 local background level chart
http://sccc.org.au/wp-content/uploads/2012/04/Caloundra-local-average-background-radiation-levels-2007-to-2011.jpg
The peak in the pre-Fukushima background level chart around September 2008, was probably an experiment being carried out at the time. Since 2012 local background radiation level data has been logged every 60 seconds.
The four years before Fukushima recorded data doesn’t show much seasonal variation in background levels. After Fukushima, a seasonal variation showed up in the year average charts. Northerly winds tend to come from the equator here in the warmer months. In the cooler months, it tends to come from the Southern Ocean. The station location is on a headland, so there can be significant changes in background levels as the wind changes from North to South.
After you average out the season differences here, the yearly increase since Fukushima has averaged around 21%.
The 2012 year average was 21% above the pre-Fukushima 4 year average.
http://sccc.org.au/wp-content/uploads/2012/09/Caloundra-monthly-average-background-radiation-levels-for-2012.jpg
The 2013 year average was 22% above the pre-Fukushima 4 year average.
http://sccc.org.au/wp-content/uploads/2013/02/Caloundra-monthly-average-background-radiation-levels-for-2013.jpg
The 2014 year average was 20% above the pre-Fukushima 4 year average.
Dynamic swings in the in 24 hour background charts where common in late 2011, 2012, and 2012. (The blue line is the day average)
Example 1:
http://sccc.org.au/wp-content/uploads/2012/01/24-hour-background-radiation-chart-27012012.jpg
Example 2:
http://sccc.org.au/wp-content/uploads/2012/04/24-hour-background-radiation-chart-20042012-1024×460.jpg
They show significant waves of radiation coming through. When wind came from a Northerly direction, background went up. When wind direction came from the Southern Ocean, background tended to go down.
Now the increases showing on the 24 hour charts are much more averaged, and no where near as dynamic. This suggests that what ever was in the air in 2011, 2012, and 2013 that crossed the equatorial barrier, has had time become more evenly distributed into the southern hemisphere air mass.
It would be nice if other locations had pre and post Fukushima long term publicly available background data. This would
make it a lot easier to see accurately, what is happening worldwide.
As radiation fallout does not fall evenly, there will be areas that have seen significant background increases, and other areas that have only seen small increases.
Southern Hemisphere January 2015 Background Radiation Report.
Station location
http://sccc.org.au/monitoring/Australian-Map.jpg
This short animation of Northern, and Southern Hemisphere air circulation, shows why we can get detections so far south.
http://www.youtube.com/watch?v=qh011eAYjAA
January 2015 Summary
There as been a small decrease in January background. This is good and means that background levels are not increasing at present, and have stabilized. At least at this location in the Southern Hemisphere.
January 2015 monthly average background radiation level was 40% above the pre-Fukushima average.
January average for 2014 was 41% above the pre-Fukushima average.
January average for 2013 was 52% above the pre-Fukushima average.
January average for 2012 was 43% above the pre-Fukushima average.
Technical details:
(Note: The 4yr average referred to in the charts, is the 4yr pre-Fukushima average.)
On the 26th January 2015 it was 80% above pre-Fukushima average levels. This put the monitoring station into it’s second alert level. It was a hot, humid, fine day.
What the coloured alert levels, in the bar charts indicate.
http://sccc.org.au/what-does-each-step-in-the-alert-level-colour-code-mean
January 2015 (40% above month average)
http://sccc.org.au/wp-content/uploads/2015/01/Caloundra-local-average-background-radiation-levels-January-2015.jpg
January 2014 (41% above month average)
http://sccc.org.au/wp-content/uploads/2014/01/Caloundra-local-average-background-radiation-levels-January-2014.jpg
January 2013, (52% above month average)
http://sccc.org.au/wp-content/uploads/2013/01/Caloundra-local-average-background-radiation-levels-January-2013.jpg
January 2012 (43% above month average)
2015/02/08 at 4:06 pm
Southern Hemisphere January 2015 Rain Water Test Report
Summary:
As you can see there was more Beryllium Be-7 detected than Lead Pb-210 this month. January rainfall was 149.2 mm.
Beryllium Be-7 can be made by spallation in the upper atmosphere, during solar events, and takes around two weeks to reach the surface. Lead Pb-210 is a decay daughter of Radon Rn-222. Both these isotopes can also be released from a Nuclear accident.
My view is that because of the upper atmosphere damage caused by the Fukushima nuclear catastrophe, and a weaker magnetosphere, smaller solar events are now having a greater impact on the Earth’s upper atmosphere. This is a possible explanation for the increased Beryllium-7 detections in rain water washouts here.
I have provided two test charts, one is the normal minus background. The other uses a new SuperDeconvoluzione feature in Theremino 6.7 that provides results that are very similar to those obtained with the expensive high purity Germanium detectors.
Station location
http://sccc.org.au/monitoring/Australian-Map.jpg
Roof down pipe filter design for rain water testing.
http://sccc.org.au/down-pipe-filter-design
Rain Filter Test Chart (The chart is minus background.)
In this chart I have CPS on the Y axis to show activity, and have turned off Y log to show linear scaling. This is only a test chart of the polyester part of the rain water filter system design.
Chart normal view minus Background
http://sccc.org.au/wp-content/uploads/2015/02/Down-pipe-Caloundra-January-polyester-filter-test-030215-TV63-26c-84645-B-text.png
Chart using the new SuperDeconvoluzione feature
http://sccc.org.au/wp-content/uploads/2015/02/Down-pipe-Caloundra-January-polyester-filter-test-030215-TV63-26c-84645-B-DC.png
2015/02/05 at 3:38 pm
Southern Hemisphere January 2015 Background Radiation Report.
Station location
http://sccc.org.au/monitoring/Australian-Map.jpg
This short animation of Northern, and Southern Hemisphere air circulation, shows why we can get detections so far south.
http://www.youtube.com/watch?v=qh011eAYjAA
January 2015 Summary
There as been a small decrease in January background. This is good news, and means that background levels are not increasing at present, and have stabilized. At least at this location in the Southern Hemisphere.
January 2015 monthly average background radiation level was 40% above the pre-Fukushima average.
January average for 2014 was 41% above the pre-Fukushima average.
January average for 2013 was 52% above the pre-Fukushima average.
January average for 2012 was 43% above the pre-Fukushima average.
Technical details:
(Note: The 4yr average referred to in the charts, is the 4yr pre-Fukushima average.)
On the 26th January 2015 it was 80% above pre-Fukushima average levels on the 26th January. This put the monitoring station into it’s second alert level. It was a hot, humid, fine day.
What the coloured alert levels, in the bar charts indicate.
http://sccc.org.au/what-does-each-step-in-the-alert-level-colour-code-mean
Background radiation charts for January, from 2012 to 2015.
January 2015 (40% above month average)
http://sccc.org.au/wp-content/uploads/2015/01/Caloundra-local-average-background-radiation-levels-January-2015.jpg
January 2014 (41% above month average)
http://sccc.org.au/wp-content/uploads/2014/01/Caloundra-local-average-background-radiation-levels-January-2014.jpg
January 2013 (52% above month average)
http://sccc.org.au/wp-content/uploads/2013/01/Caloundra-local-average-background-radiation-levels-January-2013.jpg
January 2012 (43% above month average)
http://sccc.org.au/wp-content/uploads/2012/03/Caloundra-local-average-background-radiation-levels-January-2012.jpg
2015/01/26 at 4:26 pm
Caloundra (Queensland Australia) 26th January 2015 – It was 80% above pre-Fukushima average levels on the 26th January. This put the monitoring station into it’s second alert level. It was a hot, humid, fine day.
http://sccc.org.au/wp-content/uploads/2015/01/Caloundra-local-average-background-radiation-levels-January-2015.jpg
Almost to the day, background levels also went into the stations second alert level in,
January 2012
January 2013,
http://sccc.org.au/wp-content/uploads/2013/01/Caloundra-local-average-background-radiation-levels-January-2013.jpg
The spread sheet I use, also has a formula set up to calculate average background from 12 midnight to 8 am. The 12 midnight to 8am average on the 26th was greater than the whole day average.
This is very unusual, for these elevated background events to be so precisely cyclical.
The only thing I can think of at present, is a weather related cyclical break through of the equatorial barrier.
I am open to suggestions.
Note: This alert code system here, is not based on any official government alert system. It is one set up by the station operator to indicate significant local increases.
http://sccc.org.au/what-does-each-step-in-the-alert-level-colour-code-mean
Ukraine Zaporizhzhya Nuclear Plant Accident Cover Up?
by Peter Daley
11 January 2015
The Ukrainian civil war greatly increases the chances of a major nuclear event occurring in Europe! Ukraine has four nuclear power plants operating, and Zaporizhzhya is Ukraine’s and Europe’s largest. A number of independent Internet news sources, provide evidence that a serious nuclear accident occurred at the Zaporizhzhya nuclear plant, in the Ukraine in late November 2014.
Here is a summary of circumstantial evidence gathered from separate reports.
1. An alleged hacked conversation between two Ukrainian Officials, discussing a very serious and deteriorating situation at the Zaporizhzhya nuclear plant.
2. Leaked official report of the incident, indicating significant radioactive releases. At present, there is no confirmation that this document is genuine.
3. Romanian report of a Radioactive cloud being present in Romania after a recent nuclear accident in Ukraine.
4. Large Romanian background radiation detections from different Romanian private radiation monitoring stations, occurring around the same time the news reports of problems at the Zaporizhzhya nuclear plant surfaced.
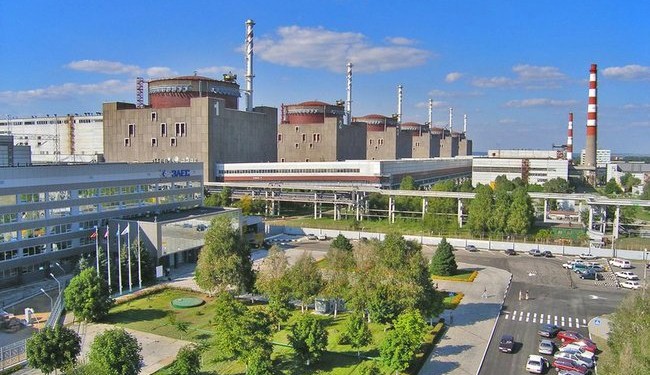 All this circumstantial evidence above is weighted against news reports stating that everything is fine.
Example:
Ukraine denies radioactive leak on Zaporizhzhya nuclear plant 30th December 2014
Extract:
Life News newswire published documents which it said came from Ukraine’s emergencies ministry, and showed that a leak at the power plant had led to a spike in radiation over the past two days, exceeding permitted norms by 16 times.
Three officials from Ukraine’s emergencies ministry, energy ministry and the plant itself told Reuters there had been no leak.
http://www.reuters.com/article/2014/12/30/us-ukraine-crisis-nuclear-idUSKBN0K81GO20141230
The circumstantial evidence in detail.
The Alleged Conversation Hack
This recent OpEdnews article refers a hacked conversation, that is alleged to have taken place between two Ukrainian officials.
General News 1/2/2015 – Zaporozhye Nuclear Problem may be even Scarier
Conversation Extract from page 3, 4 and 5
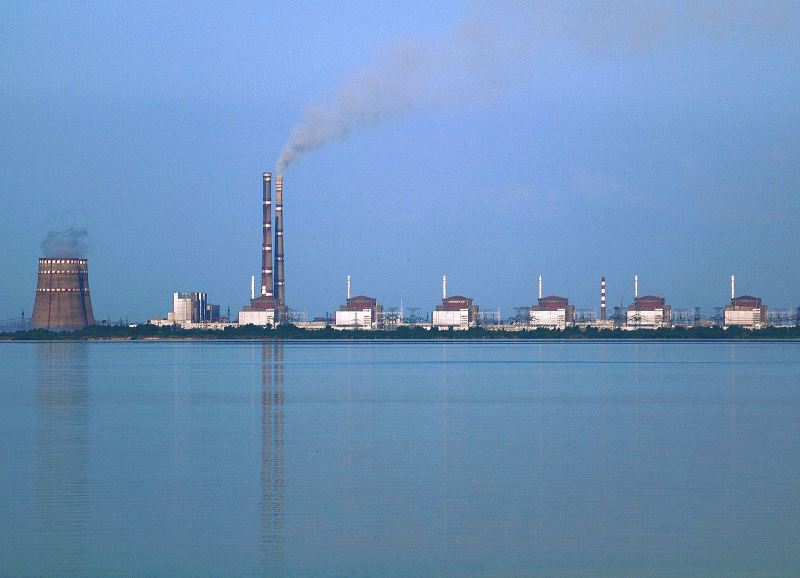
Zaporozhye Leaked Accident Conversation-
The following leaked conversation took place during the Zaporozhye incident is between Tyshenko (General Director of Nuclear Power Plant) and Torbayevsky ( Head of Emergency Readiness). The questions this should raise because the information coming to light reflect a possible situation like this are enormous.
November 28th
Tyshenko 8:12 PM- Vasili what the hell is going on over there?
8:24 – Tyshenko – Why aren’t you answering?
8:58 – Torbayevsky – Vacheslav Alexaivich, forgive me for not answering. We have an emergency. The Third Unit shut down. I am already there. Ignatchencho is with me. Krasnogorov is coming.
Tyshenko – fuck! Why the hell didn’t you tell me immediately? Do you understand the danger this will mean for us? We will be thrown in prison, you as well. Leaving now, will be there in hour.
Torbayevsky – Need to contact Chech specialists from Skoda. Its their equipment.
November 29th
Tyshenko and Krasnogorov, head engineer at plant ZGD
20:34 Tyshenko – Fiador, how are things?
Krasnagorov – Things are not good. The casket on the upper unit cannot take the pressure. Seems we screwed around with this improper material long enough.
Tyshenko – Don’t whine. You need to understand that no one asked me about any of it.
Krasnagorov – Even back then I was saying that this is not going to end well. We needed to do testing first. Its not just the caskets that are the problem. Its with the fuel as well.
Tyshenko – I said don’t whine! These are the orders the ministry gave. They warmed their hands on it already (they made their money) and let this fuck them now (let them deal with the fallout).
Krasnagorov – Understood.
December 2nd
7:48 Tyshenko and Stefansky (Assistant Plant manager)
Stefansky – Vacheslav Alexaivich as soon as you left, journalists flooded us. They are hanging out at the security checkpoint. What do I say to them?
Tyshenko 8:01 am – Listen, I am fucking barely able to stay on my feet (tired). Can’t you come up with something? Say that it is an electrical short circuit or some other shit like that, but about the reactor not a word! Blab, and I will turn you inside out (skin you)! Thats it, out, I’m getting a few hours sleep and will be back.
December 2nd
8:53 Tyshenko and Torbayevsky
Torbayevsky – Vacheslav Alexaivich, we have a leak.
Tyshenko – fuck! Where are you?
Torbayevsky – I’m at the station with the personnel, trying to fix it, but its a dead number (no use).
9:31 am Tyshenko – Ok, I called to the top. We need to be quiet now or we’ll be sent to Donbass as volunteers. Do You understand?
Torbayevsky – Understood.
12:17 Tyshenko – Vasili, I’ve been called to Kiev immediately. Figure this out without me.
Torbayevsky – What do we do with the personnel? We need to evacuate people, radiation is off the charts! And locals need to be warned. We already started dumping into the water supply from the cooling system. Very soon we will have a second Chernobyl.
Tyshenko – Don’t panic! We were told to be quiet. We’ll be quiet!
Torbayevsky – Vacheslav Alexaivich! Do you understand we can no longer keep silent? This is a catastrophe! Here in a 100 kilometer radius, nothing will be left alive! fucking sky is already glowing! (inside joke about radiation)
Tyshenko – Listen! I am flying to Kiev. Wait for a call. For now don’t answer any questions and don’t talk to anyone.
Article:
Leaked official report
Zero Hedge – Is Ukraine Hiding A Huge Radiation Leak At The Largest Nuclear Power Plant In Europe?
Extract:
Today, we get information of a leaked report sourced from three different place unconfirmed for now (but RT is trying to verify) that Ukrainian nuclear scientists misled the public and a radioactive leak has been detected citing the country€™s emergency services claiming that levels of radiation are 16.3 times the legally permitted norm.
Report:
http://www.zerohedge.com/news/2014-12-30/ukraine-hiding-huge-radiation-leak-largest-nuclear-power-plant-europe
Romanian report of a Radioactive cloud
Romania borders the Ukraine. This article if translated correctly, presents the possibility of radiation from a Ukrainian nuclear accident being detected around the northern border area of Romania. The northern border area of Romania is where the private Romanian monitoring stations detected large spikes in radiation in late November and December 2014.
Extract: (I used the Google translate service.)
Translate
06/12/2014 EVENT INFORMATION USEFUL No comments radioactive
Translation Extract:
From the first data announced by the National Meteorological administration, pollutant cloud will remain in the next 24 hours and northern border of Romania. In the first analysis, before all environmental factors values were within the natural limits. This might change, however, in the following days.
Article:
http://flamanzi.ro/nor-radioactiv-in-romania-dupa-accidentul-nuclear-din-ucraina/
High Romanian background radiation detections
These large spikes in background radiation were recorded in late November, and December 2014, on two different private Romanian monitoring stations, located in northern Romania. They are listed here in chronological order. The first Romanian detection occurred a couple of days before news reports of operational problems at the Zaporizhzhya nuclear plant surfaced.
First detection
Alert level for Timisoara Romania 26th November 2014 peak 4.48 uSv/hr.
No stations near by to confirm if it is a genuine detection, still could be equipment malfunction or a very localized event. If it is genuine, this is a very large detection.
Here is a screen shot of the chart detection.
http://sccc.org.au/wp-content/uploads/2014/11/Timisoara-Romania-261114.jpg
Global Radiation Monitoring Network
http://www.uradmonitor.com/
Second detection
Alert level Carei Northern Romania 27th November 2014.
The alert detection in Timisoara Romania on the 26th and now Carei on the 27th, would appear to be confirmation of a major radioactive release somewhere in Europe in the last couple days. Carei is north of Timisoara in Romania.
More investigation would be needed to try and pinpoint the source, and it may not be from Romania.
Screen Shot:
http://sccc.org.au/wp-content/uploads/2014/11/Carei-Northern-Romania-271114.jpg
Third detection
Another Alert level for Timisoara Romania 1st December 2014, peak 2.41 uSv/hr.
Screen Shot:
http://sccc.org.au/wp-content/uploads/2014/12/Timisoara-Romania-011214.jpg
These detections suggest there have been recent major releases, from a nuclear facility in Europe.
Forth detection
Another significant detection at Timisoara Romania on the 7th December 2014, peak 0.38 uSv/hr.
It is not nearly as large as the other recent detections of 4.8 uSv/hr, 1.81 uSv/hr, 1.17uSv/hr and 2.41 uSv/hr. These were very large free air Gamma detections from two different private Romanian monitoring stations.
Screen Shot:
http://sccc.org.au/wp-content/uploads/2014/12/Timisoara-Romania-071214.jpg
Conclusion
Yes, there is the possibility that these high detections have nothing to do with the Ukraine Zaporozhye NPP. These detections could also be equipment malfunctions, or be from local sources. I have considered these possibilities. All monitoring systems are subject to malfunctions at times. Two or more monitoring stations in proximity to each other, indicating a significant increase in background levels, are more statistically likely to be an indication of a genuine event.
All this circumstantial evidence points to a serious nuclear accident having occurred at the Zaporizhzhya nuclear plant in the Ukraine in late November 2014. Nuclear and government officials are renowned for denying any nuclear accident has occurred for as long as they can. They then play down the seriousness of the accident, once they have to admit there has been a nuclear accident. Three Mile Island, Fukushima and Chernobyl Nuclear disasters, are just a few of numerous examples. In my opinion, at this point, it would be wise to keep a close eye on the situation. Civil war and Nuclear power plants are not a good mix!
This is a free resource, listing International radiation monitoring stations. It could provide helpful information in an emergency.
http://sccc.org.au/international-radiation-monitoring-station
EnergoAtom Ukrainian Nuclear power plant monitoring web site.
http://www.energoatom.kiev.ua/en/map_aes/
2015/01/08 at 7:45 pm
Southern Hemisphere December 2014 Background Radiation Report.
Station location
http://sccc.org.au/monitoring/Australian-Map.jpg
This short animation of Northern, and Southern Hemisphere air circulation, shows why we can get detections so far south.
http://www.youtube.com/watch?v=qh011eAYjAA
BEGINNING 2015
END 2014
December 2014 Summary
Thanks to the Cairns monitoring station operator for creating this chart, which compares detections from Caloundra to Cairns in North Queensland Australia, for December 2014. Background levels for Cairns (red) in comparison to Caloundra (orange). The Caloundra monitoring station is very near the Pacific Ocean. At Caloundra, there is more dynamic changes in detections, as the wind direction moves from Southern Ocean to Northern tropics.
http://sccc.org.au/wp-content/uploads/2015/01/Caloundra-and-Cairns-December-2014.png
All the data indicates background levels are not increasing and have stabilized, at least at this location.
There as been a decrease in December background since 2012.
December 2014 monthly average background radiation level was 32% above the pre-Fukushima average.
December average for 2013 was 36% above the pre-Fukushima average.
December average for 2012 was 43% above the pre-Fukushima average.
Month Averages Chart for 2014
http://sccc.org.au/wp-content/uploads/2014/02/Caloundra-monthly-average-background-radiation-levels-for-2014.jpg
The background level 2014 year average, was 20% above the 4 year pre-Fukushima average.
The background level 2013 year average, was 22% above the 4 year pre-Fukushima average.
The background level 2012 year average, was 21% above the 4 year pre-Fukushima average.
Technical details:
(Note: The 4yr average referred to in the charts, is the 4yr pre-Fukushima average.)
Day average chart for December 2014 (32% above average)
http://sccc.org.au/wp-content/uploads/2014/12/Caloundra-local-average-background-radiation-levels-December-2014.jpg
December 2013 Day Average chart (36% above average)
http://sccc.org.au/wp-content/uploads/2013/12/Caloundra-local-average-background-radiation-levels-December-2013.jpg
December 2012 Day Average chart (43% above average)
http://sccc.org.au/wp-content/uploads/2012/12/Caloundra-local-average-background-radiation-levels-December-2012.jpg
December 2014 Rain Water Test Report
Summary:
Lead Pb-210 and Beryllium Be-7, plus significant amounts of of Radon-222 and Radon-220 decay daughters were detected in the rain water and Rain swab tests. The trace amounts of Iodine-129 and Uranium-235 are now below the detectible levels of the equipment here. The rain fall for the month was 92.4 mm.
Roof down pipe filter design for rain water testing.
http://sccc.org.au/down-pipe-filter-design
Rain Filter Test Chart (The chart is minus background.)
In this chart I have CPS on the Y axis to show activity, and have turned off Y log to show linear scaling. It is on a scale at less than one decay detection every 1000+ seconds, near the bottom of the chart. This is only a test chart of the polyester part of the rain water filter system design.
Previous Rain water and soil tests can be found here.
http://sccc.org.au/pages/The-Food-Lab.html#Soil%20Testing%20Results
Peter
Disclaimer: This is an amateur volunteer run service. Human error can provide incorrect information, and equipment malfunction can produce false readings. Do not rely on, or take action upon information presented here, without further research.
2014/12/20 at 3:03 pm
Big swings in day average background levels here this month. Already in first level alert for a few days.
Station Location
http://sccc.org.au/monitoring/Australian-Map.jpg
December 2014 day average chart,
http://sccc.org.au/wp-content/uploads/2014/12/Caloundra-local-average-background-radiation-levels-December-2014.jpg
Day averages have reached our first alert level here in early December 2014. The alert code system here, is not based on any official government alert system. It is one set up by the station operator, to indicate significant local background increases.
What the monitoring station alert codes mean.
http://sccc.org.au/what-does-each-step-in-the-alert-level-colour-code-mean
2014/12/09 at 7:18 pm
Southern Hemisphere November 2014 rain water test results.
Station location
http://sccc.org.au/monitoring/Australian-Map.jpg
This short animation of Northern, and Southern Hemisphere air circulation,
http://www.youtube.com/watch?v=qh011eAYjAA
Summary:
Traces of Lead Pb-210 and Beryllium Be-7 were detected in the rain water. The rain fall for the month was very low at 5.2 mm.
This is only a test of the polyester part of the rain water filter system design. Tested both the charcoal and polyester components and there was not much difference in the isotope signatures captured. There was a slight difference in amounts detected in each filter type.
Roof down pipe filter design for rainwater testing.
http://sccc.org.au/down-pipe-filter-design
Test Chart (The chart is minus background.)
In this chart I have CPS on the Y axis to show activity, and have turned off Y log to show linear scaling. It is on a scale at less than one decay detection every 1000+ seconds, near the bottom of the chart.
Chart link:
http://sccc.org.au/wp-content/uploads/2014/12/Down-pipe-Caloundra-November-polyester-filter-test-031214-TV63-22c-85096-B.jpg
2014/12/02 at 4:50 pm
Southern Hemisphere November 2014, and Background Radiation Report.
Station location
http://sccc.org.au/monitoring/Australian-Map.jpg
This short animation of Northern, and Southern Hemisphere air circulation, shows why we can get detections so far south.
http://www.youtube.com/watch?v=qh011eAYjAA
Summary
November 2014 monthly average background radiation level was 29% above the pre-Fukushima average. The November average for 2012 was 31% above and 2013 was 30% above the pre-Fukushima average.
Technical details:
(Note: The 4yr average referred to in the charts, is the 4yr pre-Fukushima average.)
Day average chart for November 2014 (29% above average)
http://sccc.org.au/wp-content/uploads/2014/11/Caloundra-local-average-background-radiation-levels-November-2014.jpg
2012 Day Average chart (31% above average)
http://sccc.org.au/wp-content/uploads/2012/11/Caloundra-local-average-background-radiation-levels-November-20121.jpg
2013 Day Average chart (30% above average)
http://sccc.org.au/wp-content/uploads/2013/11/Caloundra-local-average-background-radiation-levels-November-2013.jpg
2014 Month Average chart
http://sccc.org.au/wp-content/uploads/2014/02/Caloundra-monthly-average-background-radiation-levels-for-2014.jpg
UV radiation reached extreme levels here for most of November 2014.
Why you should now also monitor local UV levels in spring and Summer in both the Northern and Southern Hemispheres.
http://www.sccc.org.au/extreme-uv-levels-in-summer
Disclaimer: This is an amateur volunteer run service. Human error can provide incorrect information, and equipment malfunction can produce false readings. Do not rely on, or take action upon information presented here, without further research.
2014/11/09 at 11:10 pm
Food Testing Report
Reports that the political parties in America were testing their food, while informing the public that it was not necessary.
5th November 2014 – Emergency radiation testing used at Democrat and Republican conventions after Fukushima; Also for Obama Inauguration — Seafood, meat, vegetables, milk, water checked for nuclear waste, while top officials agree to publicly downplay crisis — 80% of milk samples from Orlando, FL had ‘significant’ Cs-137
Southern Hemisphere October 2014 UV, and Background Radiation Report.
Station location
http://sccc.org.au/monitoring/Australian-Map.jpg
This short animation of Northern, and Southern Hemisphere air circulation, shows why we can get detections so far south.
http://www.youtube.com/watch?v=qh011eAYjAA
Summary
The good news is that the air borne contamination reaching this location, appears to have stabilized for the time being.
October’s 2014 monthly average background radiation level was the lowest October monthly average since pre-Fukushima, at 14% above the pre-Fukushima October average. 2012 was 19% above and 2013 was 25% above the pre-Fukushima average. 2012 had the most dynamic swings in background levels. Over the last few months we have been getting a lot of low pressure systems develop between Australia and new Zealand, pumping cleaner Southern Ocean air up along our east coast. In previous years at this time of the year, the air flows here came mainly from the tropics.
Technical details:
(Note: The 4yr average referred to in the charts, is the 4yr pre-Fukushima average.)
Day average chart for October 2014 (14% above average)
2013 Day Average chart (25% above average)
2012 Day Average chart (19% above average)
http://sccc.org.au/wp-content/uploads/2012/11/Caloundra-local-average-background-radiation-levels-October-20121.jpg
2014 Month Average chart
http://sccc.org.au/wp-content/uploads/2014/02/Caloundra-monthly-average-background-radiation-levels-for-2014.jpg
October 2014 Rain Water Test Report
Summary:
Traces of Lead Pb-210 and Beryllium Be-7 were detected in the rain water. This is surprising since the rain fall was only 30mm in October.
The Be-7 peak should be at 477 Kev. The Be-7peak in this test chart with calibration is slightly to the left of the ideal at around 470 Kev. This suggests the presence of another unidentified isotope. At these trace levels their peaks are too close for this equipment to separate the peaks enough to identify the other isotope. A second test was done a couple days later. Whatever was present had decayed away, and the Be-7 peak was where it should be in the chart.
So far we have not been able to qualify what the possible isotope maybe.
Roof down pipe filter design for rainwater testing, http://sccc.org.au/down-pipe-filter-design
Test Chart
In this chart I have CPS on the Y axis to show activity, and have turned off Y log to show linear scaling.
http://sccc.org.au/wp-content/uploads/2014/11/Down-pipe-Caloundra-November-filter-test-021114-TV63-22c-84600-text-1024×846.jpg
Previous Rain water and soil tests can be found here.
http://sccc.org.au/pages/The-Food-Lab.html#Soil%20Testing%20Results
UV Report
Keep and eye on Northern and Southern Hemisphere UV levels in spring and summer. Here, we are already into extreme UV levels. During these events it is important to put in place protective UV Radiation measures.
http://sccc.org.au/wp-content/uploads/2014/11/Caloundra-UV-levels-4th-7th-November-2014.jpg
New Live Radon Monitoring System
Have recently set up an experimental live Radon monitoring system here.
This live Radon monitor has been set up to establish if Radon, or other Alpha emitting radioactive isotopes are significantly affecting local background radiation levels, at the Caloundra monitoring station location.
It is set up in a room in a wooden building on stumps, near the Pacific Ocean, so Radon levels should be low. Anything above 4 pCi/l for an extended period of time would be of concern.
Significant Radon increases have been detected when storms have passed over the area. Also, significant increases have been detected on clear fine days. Still assessing what it all means.
http://sccc.org.au/monitoring/sunshinecoast-monitoring-station.html
Technical Details of Live Radon monitor.
Caloundra Central 24 hour Radon Level Chart, (Live Chart)
http://liveradiationmonitoring.org/monitoringCAradon/PLOT_LOG.PNG
Information on Radon levels, and why it is of concern.
http://sccc.org.au/wp-content/uploads/2014/10/Radon_Info_ENG.pdf
Equipment used to set up the Caloundra live monitoring Radon station.
http://www.theremino.com/en/hardware/inputs/radioactivity-sensors/
Peter
To be removed from this email news letter list of recipients, simply type “Remove” in subject line of a return email. All efforts are made to keep the recipient list secure, but no guarantees can be made.
Disclaimer: This is an amateur volunteer run service. Human error can provide incorrect information, and equipment malfunction can produce false readings. Do not rely on, or take action upon information presented here, without further research.
2014/09/05 at 12:21 am
Southern Hemisphere August 2014 rain water Report.
Station location
http://sccc.org.au/monitoring/Australian-Map.jpg
This short animation of Northern, and Southern Hemisphere air circulation, shows why we can get detections so far south.
http://www.youtube.com/watch?v=qh011eAYjAA
Rain Water Test Report
Summary:
Significant traces of Lead Pb-210 and Beryllium Be-7 were detected in the rain water. This is surprising considering the local background levels were so low for August. August 2014 had 209.6 mm of rain compared to July’s rain fall of 14.5 mm, so a lot more rain flowed through the filter this month.
Beryllium Be-7 can be made by spallation in the upper atmosphere during solar evens, and takes around two weeks to reach the surface. Lead Pb-210 is a decay daughter of Radon Rn-222.
Roof down pipe filter design for rainwater testing, http://sccc.org.au/down-pipe-filter-design
Test Chart
In this chart I have CPS on the Y axis to show activity, and have turned off Y log to show linear scaling.
http://sccc.org.au/wp-content/uploads/2014/09/Down-pipe-Caloundra-August-filter-test-030914-TV63-20c-97699-B-+-text.jpg
Previous Rain water and soil tests can be found here.
http://sccc.org.au/pages/The-Food-Lab.html#Soil%20Testing%20Results
2014/10/09 at 11:00 pm
Southern Hemisphere September 2014 UV and Background Radiation Report.
Station location
http://sccc.org.au/monitoring/Australian-Map.jpg
This short animation of Northern, and Southern Hemisphere air circulation, shows why we can get detections so far south.
http://www.youtube.com/watch?v=qh011eAYjAA
Summary
September’s 2014 monthly average background radiation level was the lowest September monthly average since pre-Fukushima, at 6% above the pre-Fukushima September average. It was 7% below 2012 and 9% below 2013 monthly averages. This September saw a longer period of Southern Ocean air flows than previous years. Over the last few months, a number of low pressure systems have been siting between Australia and new Zealand, pumping cleaner Southern Ocean air up along our east coast.
Besides background levels of Ionizing radiation, it is now also important to closely watch UV levels, in both the Northern and Southern Hemisphere in spring and summer. Here, this week in early spring, we are already into extreme UV levels. During these events it is important to put in place protective UV Radiation measures.
http://sccc.org.au/wp-content/uploads/2014/10/Extreme-UV-October-2014.jpg
Technical details:
(Note: The 4yr average referred to in the charts, is the 4yr pre-Fukushima average.)
September 2014 was 6% above the 4 year pre-Fukushima average.
24 hour day average chart for September 2014
2014 Month Average chart
http://sccc.org.au/wp-content/uploads/2014/02/Caloundra-monthly-average-background-radiation-levels-for-2014.jpg
2013 Month Average chart
http://sccc.org.au/wp-content/uploads/2013/02/Caloundra-monthly-average-background-radiation-levels-for-2013.jpg
2012 Month Average chart
http://sccc.org.au/wp-content/uploads/2012/09/Caloundra-monthly-average-background-radiation-levels-for-2012.jpg
September 2014 Rain Water Test Report
Summary:
Significant traces of Lead Pb-210 and Beryllium Be-7 were detected in the rain water. Again this is surprising, considering the local background levels and rain fall were low for September. September 2014 had 63.2 mm of rain. There were a number of significant solar storms and CMEs which hit the Earth’s upper atmosphere in September.
Beryllium Be-7 can be made by spallation in the upper atmosphere, during solar events, and takes around two weeks to reach the surface. Lead Pb-210 is a decay daughter of Radon Rn-222. My view is that because of the upper atmosphere damage, and a weaker magnetosphere, smaller solar events are now having a greater impact on the Earth’s upper atmosphere. This is a possible explanation for the increased Beryllium-7 detections in rain water washouts here.
Roof down pipe filter design for rainwater testing, http://sccc.org.au/down-pipe-filter-design
Test Chart
In this chart I have CPS on the Y axis to show activity, and have turned off Y log to show linear scaling.
http://sccc.org.au/wp-content/uploads/2014/10/Down-pipe-Caloundra-September-filter-test-021014-TV63-21c-85318-B-text.jpg
Previous Rain water and soil tests can be found here.
https://www.enviroreporter.com/investigations/fukushima/radiation-station-sunshine-coast-australia/
Disclaimer: This is an amateur volunteer run service. Human error can provide incorrect information, and equipment malfunction can produce false readings. Do not rely on, or take action upon information presented here, without further research.
2014/09/07 at 9:35 pm
Extreme UV Levels in Summer
It is early spring here, and UV levels are already predicted to be at very high levels by mid week.
http://sccc.org.au/wp-content/uploads/2014/09/weeks-uv-levels.jpg
Summary:
Extreme UV levels are now being detected in both Northern and Southern Hemisphere, spring and summer. I am suggesting that the increase in Northern hemisphere UV has been caused by atmosphere damage from the large amount of ionizing radiation released into the Northern Hemisphere upper atmosphere, by the Fukushima Nuclear Disaster.
This will potentially lead to significant increases in skin cancer rates and eye cataracts, in the both the human and animal populations. In my opinion, it is important to now monitor both local ionizing and daily UV radiation levels. During UV events, if possible, stay out of the Sun, or wear good UV rated wrap around sunglasses and protective clothing, plus research UV protection methods.
If you run a public available live radiation monitoring station, also consider providing links to local UV monitoring on your page. Do a search, and you will find sites that provide local, or regional daily UV level forecasts.
Technical details:
This article appeared in October 2011.
NASA Pinpoints Causes of 2011 Arctic Ozone Hole
http://www.nasa.gov/topics/earth/features/2011-ozone-hole.html
Extract:
“You can safely say that 2011 was very atypical: In over 30 years of satellite records, we hadn’t seen any time where it was this cold for this long,” said Susan E. Strahan, an atmospheric scientist at NASA Goddard Space Flight Center in Greenbelt, Md., and main author of the new paper, which was recently published in the Journal of Geophysical Research-Atmospheres.”
Comment: (My opinion)
“You can safely say that 2011 was very atypical”
I observed in 2011, that small solar storm events where producing Northern Light displays, way down into Southern states in the USA. I have been a sun watcher for many years, and know it was very unusual for such small solar events, to produce such Northern Light displays, so far south. Our atmosphere is an electrical system, and these unusual Northern lights displays indicated that the electrical dynamics of the upper atmosphere had been changed by the large radioactive releases from the Fukushima Nuclear Disaster.
Chlorofluorocarbons (CFC), the main cause of atmospheric Ozone destruction had been reduced significantly. Because of a worldwide ban on CFC’s, by 2010 the Southern Ozone hole was showing signs of repair. This 1994 research paper indicates a cause, upper atmosphere damage from the large Fukushima krypton-85 releases.
Article:
Climate risks by radioactive krypton-85 from nuclear fission Atmospheric-electrical and air-chemical effects of ionizing radiation in the atmosphere.
Extract:
“The study shows that krypton-85 from nuclear fission enhances air ionization and, thus, interferes with the atmospheric-electrical system and the water balance of the earth atmosphere.”
http://www.opengrey.eu/item/display/10068/255704
Krypton-85 and other ionizing isotope contamination in the upper atmosphere has changed the upper atmosphere dynamics, and is creating extreme seasonal Northern Hemisphere UV and weather events.
UV levels here can now frequently reach high to extreme levels in both the Northern and Southern Hemispheres, during spring and summer. During these events it is suggested, if possible, to stay out of the sun, or wear good UV rated sunglasses and protective clothing.
These extreme UV levels would also be damaging plants and animals, plus it also can potentially create virus and plant mutations. There is independent testing now, indicating that more damaging UVC is also now reaching the Earth’s surface. (The studies linked below don’t take into account UVC atmospheric penetration.)
The large number of Northern hemisphere multiple species die offs that are being reported, are possibly occurring because of a combination of ecosystem bio-accumulation of radioactive isotope contamination, chemical toxins, and from increase UV levels.
Out side of the radioactive contamination hot spots in Japan, increased oceanic and terrestrial UV radiation levels proportionally, may be causing more ecosystem damage than radioactive isotopes surface fallout. The resultant increased levels of UVB and UVC that are now reaching the Earth’s surface are directly damaging individual organisms, and significantly impacting the oceanic and terrestrial food supply.
Excessive UV effects on ecosystems
http://www.grida.no/publications/vg/ozone/page/1389.aspx
Extract:
“Aquatic wildlife is particularly vulnerable Phytoplankton are at the start of the aquatic food chain, which account for 30 per cent of the world’s intake of animal protein. Phytoplankton productivity is restricted to the upper layer of the water where sufficient light is available. However, even at current levels, solar UV-B radiation limits reproduction and growth. A small increase in UV-B exposure could significantly reduce the size of plankton populations, which affects the environment in two ways. With less organic matter in the upper layers of the water, UV radiation can penetrate deeper into the water and affect more complex plants and animals living there. Solar UV radiation directly damages fish, shrimp, crab, amphibians and other animals during their early development. Pollution of the water by toxic substances may heighten the adverse effects of UV radiation, working its way up the food chain. Furthermore less plankton means less food for the animals that prey on them and a reduction in fish stocks, already depleted by overfishing.”
Excessive UV effects plant growth
http://www.ehow.com/how-does_5525557_effects-radiation-plant-growth-development.html
Human health and ecological consequences of ozone depletion.
http://eesc.columbia.edu/courses/v1003/lectures/ozone_health/
Sites that provide daily UV level forecasts. (Lots more out there if you do a search.)
Canada
http://weather.gc.ca/forecast/public_bulletins_e.html?Bulletin=fpcn49.cwao
USA EPA Sun Wise UV Index
http://www2.epa.gov/sunwise/uv-index
UK and Ireland
http://www.weatheronline.co.uk/weather/maps/forecastmaps?CONT=ukuk&R=300
Europe
http://www.temis.nl/uvradiation/UVindex.html
Hong Kong
http://www.hko.gov.hk/wxinfo/uvindex/english/euvindex.htm
Australia, scroll down the page for an interactive map to search by state and location.
http://www.bom.gov.au/australia/uv/
Local UV level links for each Australian monitoring station are now provided.
http://sccc.org.au/monitoring/sunshinecoast-monitoring-station.html
2014/09/03 at 6:33 pm
Southern Hemisphere August 2014 Background Radiation Report.
Station location
http://sccc.org.au/monitoring/Australian-Map.jpg
This short animation of Northern, and Southern Hemisphere air circulation, shows why we can get detections so far south.
http://www.youtube.com/watch?v=qh011eAYjAA
Summary
August’s 2014 monthly average background level was the lowest August monthly average since pre-Fukushima at 4% above the pre-Fukushima month average. August 2014 background levels here have been very stable. This August saw a longer period of Southern Ocean air flows than previous years for August, It is still quite cold here even now considering the time of year.
Even thought the local background level for August 2014 is showing a drop, the August rain water test is showing an increases in Lead Pb-210 and Beryllium Be-7. I will post test chart of the August rainwater test, and a report soon.
Technical details:
(Note: The 4yr average referred to in the charts, is the 4yr pre-Fukushima average.)
August 2014 was 4% above the 4 year pre-Fukushima average.
24 hour day average chart for August 2014
http://sccc.org.au/wp-content/uploads/2014/08/Caloundra-local-average-background-radiation-levels-August-2014.jpg
2014 Month Average chart
http://sccc.org.au/wp-content/uploads/2014/02/Caloundra-monthly-average-background-radiation-levels-for-2014.jpg
2013 Month Average chart
http://sccc.org.au/wp-content/uploads/2013/02/Caloundra-monthly-average-background-radiation-levels-for-2013.jpg
2012 Month Average chart
http://sccc.org.au/wp-content/uploads/2012/09/Caloundra-monthly-average-background-radiation-levels-for-2012.jpg
2014/08/09 at 4:32 pm
Southern Hemisphere July 2014 Rain Water Test Report
Station location
http://sccc.org.au/monitoring/Australian-Map.jpg
This short animation of Northern, and Southern Hemisphere air circulation, shows why we can get detections so far south.
http://www.youtube.com/watch?v=qh011eAYjAA
Summary:
Even thought the roof rainwater water collection area that passed through the polyester filter has been nearly doubled this month, there were only been very small traces of I-129, Pb-210 and Be-7 detected. July rain fall was also low at 14.5 mm.
Test Chart
In this chart I have CPS on the Y axis to show activity, and have turned off Y log to show linear scaling.
http://sccc.org.au/wp-content/uploads/2014/08/Down-pipe-Caloundra-July-filter-test-020814-TV63-18c-84600-+-text.jpg
Previous Rain water and soil tests can be found here.
http://sccc.org.au/pages/The-Food-Lab.html#Soil%20Testing%20Results
2014/08/04 at 6:18 pm
Southern Hemisphere July 2014 Background Radiation Report.
Station location
http://sccc.org.au/monitoring/Australian-Map.jpg
This short animation of Northern, and Southern Hemisphere air circulation, shows why we can get detections so far south.
http://www.youtube.com/watch?v=qh011eAYjAA
Summary
July’s 2014 monthly average background level is the same as July 2013, 5% above the pre-Fukushima average. This is less than the 9% above average for 2012.
July 2014 background levels here have been very stable. This generally occurs every winter, as we get increased Southern Ocean air flows.
Note:
The monitoring Geiger counter has been in the same room, and room location, data logging background radiation levels, over the years. This year we had to do much needed renovations to the room. If you saw the room before the renovations, you would understand why. : )
Since May, the room where the monitoring Geiger counter is located, has had the ceiling, roof over the room, and carpet replaced with new materials, plus the walls have been newly painted. The wooden furniture the GammaScout Geiger counter sits on has also been changed. It is still in the same location in the room.
Overall as far as I can tell, this has not significantly changed the ambient background. If it has, it is by a very small amount.
Technical details:
(Note: The 4yr average referred to in the charts, is the 4yr pre-Fukushima average.)
July 2014 was 5% above the 4 year pre-Fukushima average.
24 hour day average chart for July 2014
http://sccc.org.au/wp-content/uploads/2014/07/Caloundra-local-average-background-radiation-levels-July-2014.jpg
2014 Month Average chart
http://sccc.org.au/wp-content/uploads/2014/02/Caloundra-monthly-average-background-radiation-levels-for-2014.jpg
2013 Month Average chart
http://sccc.org.au/wp-content/uploads/2013/02/Caloundra-monthly-average-background-radiation-levels-for-2013.jpg
2012 Month Average chart
http://sccc.org.au/wp-content/uploads/2012/09/Caloundra-monthly-average-background-radiation-levels-for-2012.jpg
Disclaimer: This is an amateur volunteer run service. Human error can provide incorrect information, and equipment malfunction can produce false readings. Do not rely on, or take action upon information presented here, without further research.
2014/07/05 at 5:36 pm
Australia,
Queensland,
Sunshine Coast,
June 2014 Southern Hemisphere Background Radiation Report
Station location
http://sccc.org.au/monitoring/Australian-Map.jpg
This short animation of Northern, and Southern Hemisphere air circulation, shows why we can get detections so far south.
http://www.youtube.com/watch?v=qh011eAYjAA
Roof down pipe filter design for rainwater testing, http://sccc.org.au/down-pipe-filter-design
Summary
At this location, the data suggests airborne radioactive contamination leakage into the Southern Hemisphere has stabilized at present, as increases are not as dramatic as previous years.
Technical details:
(Note: The 4yr average referred to in the charts, is the 4yr pre-Fukushima average.)
June 2014, 7% above the 4 year pre-Fukushima average.
http://sccc.org.au/wp-content/uploads/2014/02/Caloundra-monthly-average-background-radiation-levels-for-2014.jpg
June 2013, 7% above the 4 year pre-Fukushima average
http://sccc.org.au/wp-content/uploads/2013/02/Caloundra-monthly-average-background-radiation-levels-for-2013.jpg
June 2012, 3% above the 4 year pre-Fukushima average
http://sccc.org.au/wp-content/uploads/2012/09/Caloundra-monthly-average-background-radiation-levels-for-2012.jpg
2014/06/21 at 6:43 pm
Australian Station location
http://sccc.org.au/monitoring/Australian-Map.jpg
This short animation of Northern, and Southern Hemisphere air circulation, shows why we can get detections so far south.
http://www.youtube.com/watch?v=qh011eAYjAA
June 2014 drain soil test
I have a large 30 square meter concrete slab that flows into one drain. It is an uncovered area at the time of sample collection. It had become full of runoff. This runoff had formed a fine soil with fine plant roots throughout it. When I cleaned the drain out, I collected a 526 grams sample, and placed it into a marinelli beaker for testing.
This is mainly the soil, minus the fine plant roots. I did not dry it out, so there would be some water content.
Lots of Lead Pb-210!
Lead Pb-210 is the end product of atmospheric Radon Ra-222 decay daughter isotope washout, and has a half life of 22 years. Radon itself is a decay daughter of Uranium U-238 decay.
Are more Radon decay daughters being created in the atmosphere by the huge amount of nano sized Uranium particles released from the Fukushima Nuclear Disaster, and the use of Depleted Uranium (DU) ammunition?
When I do a scintillator test I usually have two free MCA software programs running at the same time, Theremino and Becqmoni. This allows me to cross reference chart test results. Also, each software package has different advantages over the other. I used Becqmoni to work out the Pb-210 activity, in Becquerels per kilogram, for this soil sample.
http://sccc.org.au/wp-content/uploads/2014/06/Soil-from-drain-Caloundra-526-grams140614-TV62-22c-84695-+-text.jpg
The rest of the spectrum is a mixture of Uranium and Thorium decay daughters, plus some Be-7. The peak around 186 keV is most likely Radium. Maybe just a concentrating effect of the of Pb-210 from the large concrete surface area into this drain.
Here are some previous local soil tests. The detected amounts of Pb-210 present in these tests is a lot smaller.
http://sccc.org.au/wp-content/uploads/2012/08/Local-soil-sample-880grms-230812-60-81.jpg
This one was a soil area, where a tin roof drained onto it.
http://sccc.org.au/wp-content/uploads/2012/09/Glenview-soil-sample-616-grms-060912-63.84-9.jpg
2014/06/16 at 3:35 pm
Australian Banana and Strawberry Plant Mutation Report
I was sent twin bananas to test, from Northern New South Wales. Around the same time, we also found a mutated strawberry in a strawberry punnet, purchased from the local supermarket. The strawberries came from Victoria.
http://sccc.org.au/wp-content/uploads/2014/06/twin-bananas-NSW-300×225.jpg
http://sccc.org.au/wp-content/uploads/2014/06/Mutated-strawberry-300×296.jpg
Both the banana and the strawberry samples were long count tested, with a very sensitive Geiger counter. These tests showed no elevation above background. The samples were then tested with a Scintillator, in a lead and copper lined test chamber. Each sample was tested twice, and each test was run for 24 hours.
Voltage setting;
800 Volts
Scintillator Model:
2″ Alpha Spectra NaI 818/2B,
resolution 7%
Note: Experimental software MCA Theremino V6.2 was used for the scintillator testing. It is quite noisy, near background levels. We are talking very low counts per second (CPS) at this level, as low as one count every 100 + seconds. This can make it difficult to define if some very small peaks are actual isotope detections, or random variations in background levels.
Note: This scintillator has around 50% efficiency at 60 keV.
Banana Test
The brown and gold lines are the Banana tests, and the grey is background.
You will see both banana tests overlaid on the test chart. I have highlighted the significant areas above background that are common to both tests, in yellow. Possible isotopes candidates for these peak areas are Lead Pb-210, Americium Am-241, Thorium Th-234, Uranium U-235 and Beryllium Be-7. Common isotope peak markers are at the top of the chart. The suggested Lead Pb-210, Am-241, Thorium Th-234, Uranium U-235 detections were so small that there is considerable uncertainty to this analysis.
If Thorium Th-234, and Uranium U-235 are present it, would indicate refined uranium was a contaminant. More expensive sensitive equipment would be needed to verify these detections. The bananas went rotten during the testing, and becoming liquid mush. This may explain the peak differences between tests, as sample material moved around during the testing period.
Twin Banana Test Chart
Strawberry Test
The strawberry weighed was only 9 grams. This is a very small plant sample amount to test for possible trace amounts of radioactive contamination. Any possible peaks that showed up in the first test, turned out to be random variations in background. If there was any radioactive contamination present in the mutated strawberry, my equipment was not sensitive enough to identify it.
Cut up for testing
http://sccc.org.au/wp-content/uploads/2014/06/Strawberry-cut-up-for-testing.jpg
Conclusion
Did radiation isotope contamination cause these plant mutations?
There is not enough evidence gained from either of the mutated banana or strawberry tests to conclude definitively that the radioactive isotope contamination was the cause of these plant mutations. More sensitive equipment or other methods of testing, would be needed to definitively identify the isotope contamination.
These are the first two plant mutations I have been provided with for testing here in Australia. Besides man made radioactive isotope contamination, plant mutations can also be created by ultraviolet radiation, chemical, hormonal, genetic, bacterial, fungal, and viral causes etc.
Disclaimer: This is an amateur volunteer run service. Human error can provide incorrect information, and equipment malfunction can produce false readings. Do not rely on, or take action upon information presented here, without further research.
2014/06/05 at 3:10 pm
Australia,
Queensland,
Sunshine Coast,
Southern Hemisphere May 2014 rain water test report.
Technical details:
Monitoring Station Location
http://sccc.org.au/monitoring/Australian-Map.jpg
This short animation of Northern, and Southern Hemisphere air circulation, shows why we can get detections so far south.
http://www.youtube.com/watch?v=qh011eAYjAA
May 2014 had 145.6 mm of rain.
The test chart shows the presents of mainly Pb-210 and Beryllium Be-7.
In this chart I have CPS on the Y axis to show activity, and have turned off Y axis log to show linear scaling.
Test Chart
http://sccc.org.au/wp-content/uploads/2014/06/Down-pipe-Caloundra-May-filter-test-030614-TV62-22c-84742.jpg
2014/06/02 at 4:19 pm
Australia,
Queensland,
Sunshine Coast,
May 2014 Southern Hemisphere Background Radiation Report
Summary:
May 2014 was 13% above the pre-Fukushima average. May 2013 was 7% above, and May 2012 was 7% above the pre-Fukushima ~0.10 uSv/hr month average.
In the colder months I see a drop in background here, as most of the prevailing winds are from the Southern Ocean. May 2014 saw a 6% increase above May 2012 and 2013 month average background radiation levels. If you look at the May 2014 day average chart you will see more day to day dynamic swings in the day averages background radiation levels compared to 2012 and 2013.
Technical details:
Monitoring Station Location
http://sccc.org.au/monitoring/Australian-Map.jpg
This short animation of Northern, and Southern Hemisphere air circulation, shows why we can get detections so far south.
http://www.youtube.com/watch?v=qh011eAYjAA
(The 4 year average (4yr) referred to in these reports, is the recorded pre-Fukushima local background four year average of ~0.10uSv/hr.)
May 2014 was 13% above the 4 year pre-Fukushima May average.
http://sccc.org.au/wp-content/uploads/2014/05/Caloundra-local-average-background-radiation-levels-May-2014.jpg
2014 month average chart.
May 2013 was 7% above the pre-Fukushima month average.
http://sccc.org.au/wp-content/uploads/2013/05/Caloundra-local-average-background-radiation-levels-May-2013.jpg
May 2012 was 7% above the pre-Fukushima month average.
2014/05/27 at 1:45 am
Recent Australian and New Zealand elevated detections.
Sydney 26th May 2014 – I woke up with the alarm on (I set my Geiger alarm at 0.30uSv). Averages today are around 0.22uSv. Measurement confirmed by the second counter.
Dunedin New Zealand 25th May 2014 – Background here has increased to 0.19 micros per hour – a new high over the average of about 0.17 …. and the ionisation chamber has shot up to 1.7 picoCuries per litre – where the running average is 1.0 picoCuries per litre over winter … spikey …
Baldivis near Perth, Monitoring Station (Western Australia) 25th May 2014 – Chart shows an increase from around the beginning of April 2014, when the rains started…
http://www.lamble.net/weather/radiationyear2-2014.php
North Island New Zealand 24th May 2014 – Kapiti Gaigakaunta radiation monitoring station detected two brief increases in background levels, as a weather event passed through the area.
Screen Shot.
http://sccc.org.au/wp-content/uploads/2014/05/Kapiti-gaigakaunta-station-New-Zealand-elevated-background-240514.jpg
Kapiti Gaigakaunta
http://zl2tod.net/gaigakaunta/?story=19
2014/05/09 at 9:40 pm
Australia
Queensland
Sunshine Coast
April 2014 rain water test report
Summary:
This filter had a lot of green algae growing in it by the time I tested it. The chart is minus background, and is using CPS for the y axis. Testing time was 24 hours. As you can see, there are clear peak markers for Beryllium Be-7, and a combination peak of Iodine I-129 and Lead Pb-210.
There was more Be-7, I-129 and Pb-210 detected in April’s test compared to March 2014. Interestingly, March had more rain, 204mm compared to April’s 171 mm. This suggests there was a lot more Be-7, Pb-210 and I-129 in the atmosphere here in April, compared to March 2014.
Technical Details:
Roof down pipe filter design,
http://sccc.org.au/down-pipe-filter-design
April roof down pipe filter test chart.
http://sccc.org.au/wp-content/uploads/2014/05/Down-pipe-Caloundra-April-filter-test-080514-TV62-22c-84600-B.jpg
A pre-Fukushima Argentina studying indicates that the I-129 would eventually reach the Southern Hemisphere, as it has from other major sources, like the nuclear fuel reprocessing plants of Cape de La Hague (France) and Sellafield (UK).
http://www.sciencedirect.com/science/article/pii/S0048969712006353
It has been suggested that the Japanese have been pumping large amounts of liquid Nitrogen and Boron onto the multiple molten coriums at the Fukushima Nuclear disaster. Neutron bombardment, plus lots of underground corium venting, has also been releasing large amounts Beryllium Be-7 and 1-129.
For background on this subject read this article on using Be-7 as a tracer for I-129.
http://www.sciencecodex.com/dartmouth_scientists_track_radioactive_iodine_from_japan_nuclear_reactor_meltdown-89004
Be-7 can also be produced by cosmic/solar ray spallation in the upper atmosphere. Be-7 created by this process takes around two weeks to reach sea level. The Sun has been very quite this cycle.
There is a natural Be-7 / Pb-210 cycle here in the Southern Hemisphere, which means there should be more Be-7 and Pb-210 detected in the summer months compared to winter.
Is some of this Be-7, I-129 and Pb-210 from Fukushima?
The slight peak position shift to the left of the ideal in the April 2014 chart could indicate another isotope contaminant is also present with Be-7, around the same location.
Disclaimer: This is an amateur volunteer run service. Human error can provide incorrect information, and equipment malfunction can produce false readings. Do not rely on, or take action upon information presented here, without further research.
2014/05/02 at 10:39 pm
Australia.
Queensland,
Sunshine Coast,
April 2014 Southern Hemisphere Background Radiation Report
Summary:
April 2014 was 22% above the pre-Fukushima average. April 2012 was 10% above, and April 2013 was 13% above the pre-Fukushima average.
In the colder months I see a drop in background here, as most of the prevailing winds are from the Southern Ocean. The drop for April 2014 was less than April 2012 and 2013.
Technical details:
Monitoring Station Location
http://sccc.org.au/monitoring/Australian-Map.jpg
April 2014 was 22% above the 4 year pre-Fukushima April average.
2014 month average chart.
http://sccc.org.au/wp-content/uploads/2014/02/Caloundra-monthly-average-background-radiation-levels-for-2014.jpg
April 2013 was 9% above the pre-Fukushima month average.
http://sccc.org.au/wp-content/uploads/2013/02/Caloundra-monthly-average-background-radiation-levels-for-2013.jpg
April 2012 was 12% above the pre-Fukushima month average.
http://sccc.org.au/wp-content/uploads/2012/09/Caloundra-monthly-average-background-radiation-levels-for-2012.jpg
March 2014 Southern Hemisphere Background Radiation Report
Summary:
The extensive local recorded data shows that the background radiation level increases have stabilized. March had a 1% decrease in average background compared to 2013. This was still 7% above the March 2012 average, and 31% above pre-Fukushima levels.
An unusual rain event around the 26th of March caused a drop in radiation for a couple of days. This was surprising. After investigation, I found the event was caused by a Southern low pressure system. You can see this Southern low around 1.40 seconds into this “Three Minute News” Youtube video. We had a significant spike in background on a dry 29th and 30th of March, when the air flow started to come from the tropics again.
http://www.youtube.com/watch?v=Jqmhv4pZ8f0&list=UUTiL1q9YbrVam5nP2xzFTWQ
Technical details:
Monitoring Station Location
http://sccc.org.au/monitoring/Australian-Map.jpg
This short animation of Northern, and Southern Hemisphere air circulation, shows why we can get detections so far south.
http://www.youtube.com/watch?v=qh011eAYjAA
March 2014 was 31% above the 4 year pre-Fukushima March average.
http://sccc.org.au/wp-content/uploads/2014/03/Caloundra-local-average-background-radiation-levels-March-2014.jpg
March 2013 was 32% above the pre-Fukushima average.
http://sccc.org.au/wp-content/uploads/2013/03/Caloundra-local-average-background-radiation-levels-March-2013.jpg
March 2012 was 24% above the pre-Fukushima average.
http://sccc.org.au/wp-content/uploads/2012/04/Caloundra-local-average-background-radiation-levels-March-2012.jpg
Rain Water Report
Summary:
It was a fairly wet month with 204mm of rain, so a fair bit of rain water flowed through the filter. The main isotopes detected were Iodine I-129, Lead Pb-210, and Beryllium Be-7, with possible traces of Uranium U-235?. There was more rain in March, 204mm, but less detectable traces of isotopes than February. In February we had 37mm rain. This chart is using a new background, recorded on the 21st March 2014.
Test Chart
http://sccc.org.au/wp-content/uploads/2014/04/Down-pipe-Caloundra-March-filter-test-020414-TV62-26c-85254-+-test.jpg
Peter
To be removed from this email news letter list of recipients, simply type “Remove” in subject line of a return email. All efforts are made to keep the recipient list secure, but no guarantees can be made.
Disclaimer: This is an amateur volunteer run service. Human error can provide incorrect information, and equipment malfunction can produce false readings. Do not rely on, or take action upon information presented here, without further research.
2014/04/06 at 8:40 pm
Australia
Queensland
Sunshine Coast
March 2014 rain water test report,
Summary:
It was a fairly wet month with 204mm of rain, so a fair bit of rain water flowed through the filter. The main isotopes detected were Iodine I-129, Lead Pb-210, and Beryllium Be-7, with possible traces of Uranium U-235?. There was more rain in March 204mm, but less detectable traces of isotopes than February. In February we had 37mm rain. This chart is using a new background, recorded on the 21st March 2014.
Monitoring Station Location
http://sccc.org.au/monitoring/Australian-Map.jpg
This short animation of Northern, and Southern Hemisphere air circulation, shows why we can get detections so far south.
http://www.youtube.com/watch?v=qh011eAYjAA
Test Chart
http://sccc.org.au/wp-content/uploads/2014/04/Down-pipe-Caloundra-March-filter-test-020414-TV62-26c-85254-+-test.jpg
Disclaimer: This is an amateur volunteer run service. Human error can provide incorrect information, and equipment malfunction can produce false readings. Do not rely on, or take action upon information presented here, without further research.
2014/04/01
Australia,
Queensland,
Sunshine coast,
March 2014 Southern Hemisphere background Radiation Report
Monitoring Station Location
http://sccc.org.au/monitoring/Australian-Map.jpg
This short animation of Northern, and Southern Hemisphere air circulation, shows why we can get detections so far south.
http://www.youtube.com/watch?v=qh011eAYjAA
Summary:
The extensive local recorded data shows that the background radiation level increases have stabilized. March had a 1% decrease in average background compared to 2013. This was still 7% above the March 2012 average, and 31% above pre-Fukushima levels.
An unusual rain event around the 26th of March caused a drop in radiation for a couple of days. This was surprising. After investigation, I found the event was caused by Southern low pressure system. You can see this Southern low around 1.40 seconds into this “Three Minute News” Youtube video. We had a significant spike in background on a dry 29th and 30th of March, when the air flow started to come from the tropics again.
http://www.youtube.com/watch?v=Jqmhv4pZ8f0&list=UUTiL1q9YbrVam5nP2xzFTWQ
Technical details:
What do the colour alert codes in the charts mean?
http://sccc.org.au/what-does-each-step-in-the-alert-level-colour-code-mean
March 2014 was 31% above the 4 year pre-Fukushima March average.
http://sccc.org.au/wp-content/uploads/2014/03/Caloundra-local-average-background-radiation-levels-March-2014.jpg
March 2013 was 32% above the pre-Fukushima average.
http://sccc.org.au/wp-content/uploads/2013/03/Caloundra-local-average-background-radiation-levels-March-2013.jpg
March 2012 was 24% above the pre-Fukushima average.
http://sccc.org.au/wp-content/uploads/2012/04/Caloundra-local-average-background-radiation-levels-March-2012.jpg
Disclaimer: This is an amateur volunteer run service. Human error can provide incorrect information, and equipment malfunction can produce false readings. Do not rely on, or take action upon information presented here, without further research.
2014/03/17 at 4:38 pm
Spike in background Caloundra Australia 17th March 2014
Had a significant local background increase here on the 17th March. Background day average went to yellow alert level, at 43% above average. This was mainly a free air detection increase. Except for a very light late evening shower that lasted a minute or two, it was fine and hot the rest of the day.
During yellow alert levels or higher, we suggest staying out of the rain.
http://sccc.org.au/what-does-each-step-in-the-alert-level-colour-code-mean
Day average chart,
http://sccc.org.au/wp-content/uploads/2014/03/Caloundra-local-average-background-radiation-levels-March-2014.jpg
North Island New Zealand 17th March 2014 – Kapiti Gaigakaunta radiation monitoring station detected a brief increase in background levels as a weather event passed through the area. Screen Shot.
http://sccc.org.au/wp-content/uploads/2014/03/North-Island-NZ-Gaigakaunta-170314.jpg
North Island Kapiti Gaigakaunta radiation monitoring station link
http://zl2tod.net/gaigakaunta/?story=19
2014/03/15 at 10:02 pm
Australia,
Queensland,
Sunshine Coast,
February 2014 rain water test,
Summary:
It was a dry month with only 37mm of rain, so not much rain water flowed through the roof down pipe filter. Traces of Beryllium Be-7, Iodine I-129, Lead Pb-210, and Uranium U-235? were detected. The main Isotopes Be-7, I-129, and Pb-210, detected, seem to be in significant amounts, taking into account the amount of rainfall we had here for February.
Be-7 can be created naturally by spallation, from solar wind and upper atmosphere interaction. The Sun has been very quite at recently. There was some significant solar activity towards the end of February, but it takes around two weeks for any Be-7 created by this process to reach the lower atmosphere.
A theory proposed by a contact:
“One could speculate the increased production from solar variation, however, it is most likely from Boron neutron synthesis.”
The theory is that lots of Boron has been used to control the meltdowns at the Fukushima Nuclear Disaster. Neutron bombardment of the Boron from the molten Coriums is creating lots of Be-7, which is being released into the atmosphere.
Technical Details:
Roof down pipe filter design, http://sccc.org.au/down-pipe-filter-design
February roof down pipe filter test chart.
http://sccc.org.au/wp-content/uploads/2014/03/Down-pipe-Caloundra-February-filter-test-070314-TV62-22c-83902CBF-+-text.jpg
Disclaimer: This is an amateur volunteer run service. Human error can provide incorrect information, and equipment malfunction can produce false readings. Do not rely on, or take action upon information presented here, without further research.
2014/03/02 at 9:33 pm
Australia,
Queensland,
Sunshine Coast
February 2014 background Radiation Report
Monitoring Station Location
http://sccc.org.au/monitoring/Australian-Map.jpg
This short animation of Northern, and Southern Hemisphere air circulation, shows why we can get detections so far south.
http://www.youtube.com/watch?v=qh011eAYjAA
February 2014 was 40% above the 4 year pre-Fukushima February average.
http://sccc.org.au/wp-content/uploads/2014/02/Caloundra-local-average-background-radiation-levels-February-2014.jpg
February 2013 was 39% above the pre-Fukushima average.
http://sccc.org.au/wp-content/uploads/2013/02/Caloundra-local-average-background-radiation-levels-February-2013.jpg
February 2012 was 37% above the pre-Fukushima average.
http://sccc.org.au/wp-content/uploads/2012/04/Caloundra-local-average-background-radiation-levels-February-2012.jpg
The extensive local recorded data shows that the background radiation level increases here, appear to have stabilized. At the beginning of the Fukushima Nuclear disaster there was a dramatic 37% increase for February 2012. This dramatic single year increase has not been repeated in succeeding years. There has been a much smaller 3% increase over the last two years.
Still, it would be better not to see any increase!
2014/02/16 at 2:30 pm
Australia,
Queensland,
Sunshine Coast,
January 2014 Rain Water Test Results
Monitoring Station location
http://sccc.org.au/monitoring/Australian-Map.jpg
This short animation of Northern, and Southern Hemisphere air circulation, shows why we can get detections so far south.
http://www.youtube.com/watch?v=qh011eAYjAA
It was a relatively dry January, so not much water flowed through the polyester rain water filter.
Roof down pipe filter design.
http://sccc.org.au/down-pipe-filter-design
The rain water filter test main peaks are for trace amounts of Iodine I-129, lead Pb-210 and Beryllium Be-7. There is a natural Beryllium Be-7 and Lead Pb-210 cycle here in the Southern Hemisphere. More Beryllium Be-7 and Lead Pb-210, is detected in rain washouts during summer, than in winter.
Here is the test scintillator chart for the rain water test.
http://sccc.org.au/wp-content/uploads/2014/02/Down-pipe-filter-test-for-January-030214-TV62-26c-82496-+-text-B.png
Is it all natural, or is some from Fukushima, that is the question?
I am suggesting that the peak at around 80 keV is test chamber Lead fluorescence, caused by the Be-7 Beta radiation released from Be-7.
Disclaimer: This is an amateur volunteer run service. Human error can provide incorrect information, and equipment malfunction can produce false readings. Do not rely on, or take action upon information presented on this web site, without further research.
2014/02/05 at 9:07 pm
Food Testing
Reports of Cesium Cs-137 and Cs-134 Pacific Salmon contamination detections, have been added to the EnviroReporters Radiation Food Lab list in the last month.
The Salmon were caught off Alaska, and the Philippines. These detections indicate the Bio-accumulation of Cesium from the Fukushima Nuclear Disaster.
A lot of food and environmental detection reports tend to concentrate on Cesium detection. This is because it is relatively easy to test for, and detect. If Cesium is present in a test result, there is a possibility that other types of radioactive isotopes are also present, but not reported. Fallout is a dirty mixture of isotopes. It is not just Cesium. Some of the other isotope contaminants, particularly the dangerous Alpha emitters, need more specialized and expensive equipment to detect their presence.
Here is an excellent 10 minute video on Cesium food contamination and testing, to quickly get you up to speed on the subject.
http://www.youtube.com/watch?v=I9d3I3S99Dc&feature=player_embedded
07.01.2014 – No Elevated Levels of Radiation Found in North Pacific Salmon Samples.
Extracts:
Loki Fish Company announced today that laboratory analysis of five salmon species harvested by its fishermen in Puget Sound and Southeast Alaska during 2013 show no indications of elevated radiation levels.
Two of the samples registered at trace levels – Alaskan Keta at 1.4Bq/kg for Cesium 137, and Alaskan Pink at 1.2Bq/kg for Cesium 134. There were no detectable levels of iodine-131 in any samples.
Comment:
This first report here is based on a small number of tested fish, and any detected Cesium is of concern.
http://www.lokifish.com/scrapbook_detail.php
21.01.2014 -Cesium Found in Tuna in Swiss Stores and in Some Samples of Salmon Tested by a Seattle Fish Company
Extract:
The fish come from the Philippines. As they travel long distances, they could have floated by the vicinity of the damaged nuclear power plant at Fukushima. For months, radioactively contaminated water has been leaking into the sea. Markus Zehringer, head of radioactivity in air and space at the Cantonal Laboratory in Basel, also assumes that the radiation is related to the nuclear disaster in Fukushima.
http://mieuxprevenir.blogspot.com.au/2013/10/there-is-fukushima-fish-in-swiss-stores.html#more
Original German article.
http://www.20min.ch/schweiz/news/story/28556154
If ingested, Cesium and other artificial radioactive isotopes create radioactive hot spots in the body. Where these radioactive hot spots develop depends on the isotope’s chemical affinities. These damaging radioactive isotopes are often chemically toxic, as well as radioactive.
This test chart shows how much more radioactive Cesium is by weight, than naturally occurring Potassium K40. You are welcome to use this chart wherever you wish, to help educate people to the dangers of ingested artificial isotopes.
http://sccc.org.au/wp-content/uploads/2013/04/Minamisoma-Cesium-290313-TV45-23c-25040-MB.jpg
The latest International Food detections reports can be found here.
https://www.enviroreporter.com/2013/02/radiation-food-lab/
January 2014 Southern Hemisphere Background Radiation Level Report.
Monitoring Station Location
http://sccc.org.au/monitoring/Australian-Map.jpg
Summary
January 2014 month average background radiation level was 41 % above the pre-Fukushima 4 year average. This is better than the recorded January 2013, 52% above average, and January 2012, 43% above average. This suggests at this location, the Southern hemisphere increasing background levels have stabilized. It means it hasn’t gotten worse, but it is still higher than pre-Fukushima levels for this time of the year. The average 4 year per Fukushima Nuclear disaster local background radiation level recorded from 2007 to 2011, was 0.10 uSv/hr.
The spike in this chart around August and September 2008 is mystery. It may have been caused by the operator experimenting.
More Technical Information and Charts
This short animation of Northern, and Southern Hemisphere air circulation, shows why we can get detections so far south.
Comparing the month and day average, (Chart links are provide below.)
a. There is definitely a seasonal variation in local background levels. A seasonal variation very clearly shows in all the monthly average charts.
b. The considerable variation in month averages indicates there is more Northern Hemisphere to Southern Hemisphere air flow break through in the warmer summer months, than in the colder winter months.
c. January 2012 day average chart shows whatever was in the air was not mixed as well as in 2013 and 2014. This can be seen by the dramatic swings in the day averages for 2012, when you compared with the day average charts of 2013 and 2014.
d. Something major must have occurred at Fukushima in late 2012 and early 2013, to have caused such a dramatic month average increase for January 2013. Note that for January 2013 most of the month was dry, drought conditions here. The drought was broken by a significant rain event around the 26th January.
January Day Average Year Chart Comparisons
Explanation of the alert level colour coding in the charts.
http://sccc.org.au/what-does-each-step-in-the-alert-level-colour-code-mean
You can go here, to see all the report charts on one page for easy comparison,
http://sccc.org.au/january-2014-background-report
or look at them individually here.
January 2014 day average chart
http://sccc.org.au/wp-content/uploads/2014/01/Caloundra-local-average-background-radiation-levels-January-2014.jpg
January 2013 day average chart
http://sccc.org.au/wp-content/uploads/2013/01/Caloundra-local-average-background-radiation-levels-January-2013.jpg
January 2012 day average chart
http://sccc.org.au/wp-content/uploads/2012/03/Caloundra-local-average-background-radiation-levels-January-2012.jpg
January Month Average Year Chart Comparisons
2014 month average chart
http://sccc.org.au/wp-content/uploads/2014/02/Caloundra-monthly-average-background-radiation-levels-for-2014.jpg
2013 month average chart
http://sccc.org.au/wp-content/uploads/2013/02/Caloundra-monthly-average-background-radiation-levels-for-2013.jpg
2012 month average chart
http://sccc.org.au/wp-content/uploads/2012/09/Caloundra-monthly-average-background-radiation-levels-for-2012.jpg
2014/01/15 at 3:10 pm
Took a rain swab off a car here on the 6th January 2013.
This swab was tested using a Theremino Geiger counter kit using a Russian SBT-10 pancake probe. Initial peak was around 5 uSv/hr 3,000 cpm. This is the second hottest rain washout detected here so far.
location.
http://sccc.org.au/monitoring/Australian-Map.jpg
The decay chart of the rain swab showed classic Radon-222 decay daughter decay.
http://sccc.org.au/wp-content/uploads/2014/01/Rain-swab-Caloundra-060114-AV-TV49.jpg
Here is the scintillator test chart preliminary assessment, of that rain swab. I used experimental MCA Theremino software for this test. It can get a bit noisy near background. This experimental software is pushing the limits of what can be detected with the equipment here. I have placed peak markers at the top of the chart for reference.
The rain swab Geiger counter and scintillator tests showed that the rain event on the 6th January was mainly Radon-222, and Radon-220 washout.
http://sccc.org.au/wp-content/uploads/2014/01/Rain-swab-Caloundra-060114-TV62-26c-84323+-text.jpg
You can see some of the peaks for Radon-222 and Radon-220 decay daughters still present in the test chart. The main peaks are for Radon-220 daughters at, Pb-212 X-ray (77 kev), Lead Pb-212 (238 keV) and Tl-208 (583 keV).
As you can see there is possibly traces of Iodine I-129 (40 keV?), Lead Pb-210 (47keV), U-235 at (185 keV?), and Beryllium Be-7 (477 keV). The peak between the Be-7 and 511 peak markers is probably a sum peak of the two.
Cesium and I-131 in Australia?
Bobby1′s blog has an alternative detailed analysis of the 6th January rain swab scintillator test I did.
http://optimalprediction.com/wp/cesium-134-and-iodine-131-in-australia/
Disclaimer: This is an amateur volunteer run service. Human error can provide incorrect information, and equipment malfunction can produce false readings. Do not rely on, or take action upon information presented here, without further research.
2014/01/12 at 2:09 pm
Australia,
Queensland
Sunshine Coast
Year Report for 2013,
Monitoring station location http://sccc.org.au/monitoring/Australian-Map.jpg
A large amount of collected recorded data for 2013 has been correlated. The year average background was 22% above the 4 year pre Fukushima average. This is only a very marginal 1% increase over 2012 year 21% increase.
2013 monthly average chart,
http://sccc.org.au/wp-content/uploads/2013/02/Caloundra-monthly-average-background-radiation-levels-for-2013.jpg
2012 monthly average chart,
http://sccc.org.au/wp-content/uploads/2012/09/Caloundra-monthly-average-background-radiation-levels-for-2012.jpg
January 2013 had the highest monthly increase.
http://sccc.org.au/wp-content/uploads/2013/01/Caloundra-local-average-background-radiation-levels-January-2013.jpg
The 2013 year average suggests that at present, the Southern Hemisphere increase at the monitoring location has stabilized, with a very marginal year average increase for 2013.
Rain Water Tests Report for 2013
A lot of rain water and car bonnet swabs were conducted during the year. At the beginning of the year, these Geiger counter and scintillator tests manly detected Radon-222 decay daughter isotope washouts, with traces of Beryllium Be-7, Lead Pb-210, Iodine I-129 and Uranium U-235. In July, traces of Thorium Th-234 were detected, plus in September, Radon-220 decay daughter isotopes were also detected for the first time.
If traces of U-235 were detected, it means a lot more Uranium U-238 was in the atmosphere. The detection of I-129 is also of concern, even if it is in trace amounts.
Testing Results can be found here.
http://sccc.org.au/pages/The-Food-Lab.html#Soil%20Testing%20Results
Even though the amounts detected maybe below Government set risk levels, it is suggested that those who are using tank water should have very good water filters in place, and those on town water use a good reverse osmosis water filter. Also wash your fruit and vegetables well before cooking and eating.
2014/01/04 at 4:57 pm
Australia,
Queensland,
Sunshine Coast,
4th January 2014
BEGINNING 2014
END 2013
December 2013 report
Monitoring Station location
http://sccc.org.au/monitoring/Australian-Map.jpg
December 2013 day average chart,
http://sccc.org.au/wp-content/uploads/2013/12/Caloundra-local-average-background-radiation-levels-December-2013.jpg
The December month average was 36% above the pre Fukushima 4 year average, and 7% below the December 2012 month average. This is an indication that the levels are stabilizing, here in the South Hemisphere at this location.
December 2012 day average chart,
http://sccc.org.au/wp-content/uploads/2012/12/Caloundra-local-average-background-radiation-levels-December-2012.jpg
—————————————-
The day average charts are colour coded, green is normal level and yellow is the first alert level set by the station operator, me in this case 🙂 . It is not based on any Government risk level.
Sunshine Coast Monitoring Station Alert level explanation,
http://sccc.org.au/what-does-each-step-in-the-alert-level-colour-code-mean
—————————————
General increase here on the East Coast of Australia, 54% above average yesterday.
http://sccc.org.au/wp-content/uploads/2014/01/Caloundra-local-average-background-radiation-levels-January-2014.jpg
Also, an increase detected on the North Island of New Zealand. They use a scintillator for monitoring, and around 700 to 750 cpm would be average.
http://sccc.org.au/wp-content/uploads/2014/01/North-Island-New-Zealand-Kapiti-gaigakaunta-050114.jpg
New Zealand Monitoring Station
http://zl2tod.net/gaigakaunta/?story=19
2013/12/22 at 4:31 pm
Multiple Flu outbreaks.
We are focused on the radiation detections in food, water and the environment in the radiation conversation EnviroReprter forum. OK, this is important, but I think at this point I would suggest that we all start looking at the larger implications of these detections.
1. There is now a large group of people with compromised immune systems, particularly in the Northern hemisphere.
2. This is a particularly cold Northern Winter.
3. There have been reports of an H7N9 bird flu in China, mainly Hong Kong at present, and now an H1N1 swine flu outbreak in Texas. There are new cases being reported across the U.S
4. We have large numbers of people traveling, and mixing during the holiday season.
All the evidence suggests it would be wise to,
1. Fortify your immune systems, with good food and supplements.
(Clarification regarding “Fortify your immune systems,” I was referring to eating good healthy food, and taking safe supplements etc. Taking immune boosters natural or artificial for some of these flu variants can increase risk, if you become infected. An over reaction by the immune system can create a potential for cytokine storm creation. http://www.wisegeek.org/what-is-the-cytokine-storm.htm Hence the need to do research on the subject.)
2. Avoid contact with sick people were possible, plus avoid public places in high risk areas.
3. Research methods on how to prevent infection, good hygiene practices, and disinfection techniques.
4. Have enough food and water provisions in place too, so you can shelter in place, if a major epidemic or pandemic eventuates. The above dynamics have statistically increased the chances of this happening.
This Google service provides information on worldwide flu trends. Click on the Interactive map for information at your location.
http://www.google.org/flutrends/
PotrBlog has been keeping track of these out breaks and provides independent analysis. If you scroll down through the his blog list, you will find protective measures, plus the latest information on these flu outbreaks.
http://pissinontheroses.blogspot.com.au/
2013/12/09 at 4:27 pm
Southern Hemisphere rain swab and rain water tests, for November 2013.
Australia,
Queensland,
Sunshine Coast,
Station Location,
http://sccc.org.au/monitoring/Australian-Map.jpg
Why we can get detections so far south.
This short animation of Northern, and Southern Hemisphere air circulation, shows why we can get detections so far south.
http://www.youtube.com/watch?v=qh011eAYjAA
This test chart is from the roof down pipe filter,
http://sccc.org.au/down-pipe-filter-design
That was in place all November.
Just a couple of showers and storms for November at this location, not much rain mainly dry.
Scintillator testing shows the most significant peaks were for radioactive Lead Pb-210 and Beryllium Be-7 isotopes, plus a small trace of Uranium U-235.
http://sccc.org.au/wp-content/uploads/2013/12/Down-pipe-filter-test-for-November-021213-TV61-23c-82760-+-text.jpg
The rain swab collected on the 30th November and tested on the 31st, was interesting in that there were significant detections of both Radon-222 and Radion-220, plus possibly a trace amount of Cobalt Co-57.
2013/12/04 at 5:12 pm
Accidental, and surprising detection of radioactivity in lead solder! (Preliminary Report)
I was sent this email from a person informing me about an accidental and surprising detection of radioactivity in lead solder that this person had purchased in Australia.
—————————–
Email 18th October 2013,
“Had my roll of electrical solder come close to my SBT 10, and started getting counts – Bloody great – tested it with my LND 7317 and averaged ~400cpm. Im doing a few more tests with sheet of paper, etc and will send a chart with results and maybe send a sample of the solder to Peter to try and see what the . is going on. Perhaps dirty lead?…”
—————————–
I received the first 12 gram sample late on the 30th of October, and started testing immediately. It took a while to complete multiple tests, plus do research on the test results. In my opinion the sample tests showed the lead solder to be significantly radioactive.
On the 8th November I contacted the company that had sold this brand of solder roll here in Australia. I spoke to the Australian product manager. I did this to inform the company of the detection, plus to provide the company with the opportunity to do further investigations into how wide spread and significant this contamination was. The product manager requested a sample for further assessment and testing, which I posted to him on the afternoon of the 8th of November 2013.
Later that afternoon a more senior representative phoned me, and freely volunteered the information that this solder was manufactured in China from recycled electronic circuit boards. They had been dealing with this Chinese supplier for over twenty years, and had not had any problems with this product before.
They said they would be transparent in their dealings with this detection, and provide feedback. I was sent a replacement roll of solder with a different product name, and it tested clean.
I phoned product manager on the 26th of November and was informed they were still waiting on the test results. When I heard nothing back from them, I rang on the 2nd of December 2013 to find out if the test results had been received yet. I spoke to the project manager again. He conveyed to me,
1. The test results had not been received yet.
2. The information conveyed to him, by the scientist doing the testing was it was mainly radioactive lead that was detected. He pointed out there was radioactive lead all around us in the environment, and in all lead. So it was unlikely that this contamination detection would be an issue.
In our discussion I pointed out that three contaminated rolls had now been detected in Australia by different people. (four now) In my opinion, the amount of radioactive contamination was significant, and way above what you would normally find in normal lead solder products.
Here is a Geiger counter test of 250 grams of a different brand of lead solder. This is solder roll sent as a replacement for the contaminated roll. As you can see from the test chart, it is at background level. This is how lead solder you purchase should test!
http://sccc.org.au/wp-content/uploads/2013/12/Normal-solder.jpg
Now compare that test to the test of 64 grams of lead solder, taken off the contaminated roll.
http://sccc.org.au/wp-content/uploads/2013/11/Lead-solder-64-grams-141113.jpg
There is a very large and obvious difference between the test results of normal solder, and the contaminated roll. Here is a more scientific long average Geiger counter tested conducted in the same background environment, for comparison.
http://sccc.org.au/wp-content/uploads/2013/12/Contaminated-lead-solder-compared-to-normal-solder-041213.jpg
I now have lots of reports from people who have tested a broad range of solder brands. So far, the contaminated detections are restricted to four rolls of this brand purchased in Australia. A contact in New Zealand has reported a clean test for newly purchased solder, including the brand in question.
Email Report: ( I have removed the company and product information from this email )
—————————————–
Hi Peter,
I popped into the branch in Wellington yesterday and bought a 200g roll. I also bought small samples of the 1.0mm version and their lead-less solder.
I then wandered up to the university and found a professor who works on such things. He placed the samples in front of his handy survey meter. There was no sign of radioactivity above the existing background.
This morning I’ve put them in front of my scintillator. Readings decreased by about 10%, perhaps due to the shielding effect of the lead.
All the best,
———————————————–
This evidence now suggests the contaminated solder is restricted to a batch sold in Australia. This is not conclusive. Unfortunately there does not appear to be any batch information provided on the product labeling.
My opinion
The radioactive contaminated lead solder could present a health risk under these circumstances.
1. If you didn’t wash your hands well after use, or touched other objects before washing your hands. Yes, I know, you should do this even if it was just plain lead solder.
2. Lead X-ray fluorescence, plus the significant amount Beta radiation released, could also be an issue if enough of it was in close proximity, eg. a wearable electronic device, or stored in large amounts.
3. Adults and children potentially breathing in volatilized contaminants on melting when soldering.
My big concern is children using this contaminated solder, when working on hobby electronics projects. Their greater potential for hand to mouth contact, and breathing in volatilized contaminants.
I have no idea how widely this contaminated lead may have been distributed. Has it been used in the manufacture of other electronic devices, or products that use lead? More investigation is needed to establish if this is the case. If you were building a Geiger counter kit or scintillator equipment using this solder, it would contaminate your project. At present, I would suggest anyone who uses lead solder for electronic projects to test it before use.
From the information conveyed to me at present, the company’s interpretation of the hazard appears to be different from mine.
At this point I and others have contacted the relevant Government regulators in both Australia and New Zealand. Health and safety complaint forms have been submitted to inform the authorities of the detections. We will have to wait and see what the outcomes are from this process. I will submit a more detail report once this process is complete.
The major issue here is Nuclear waste getting into the manufacturing process through poor control, regulation, and corruption. That everyone is a victim when this happens, manufacturer, distributor and consumer, plus the environment. These consumer goods will end up in land fills!
Test before use, would be the wisest action at present.
More Detailed Test Results
Because the first sample sent to me was sent to the manufacturer for further analysis, my contact sent me a larger 64 gram sample for further testing.
A Theremino Geiger counter Kit, + Russian SBT-10 pancake tube, was used for Geiger counter testing. The solder sample was in a zip locked plastic bag during testing. The lead in the solder would offer some self shielding.
This sample was from the original 200 gram solder roll. The Geiger counter testing of this lead solder detected mostly beta, a significant Alpha presence, plus a small amount of Gamma.
Gamma + Beta test result
1.6 uSv/hr
1000cpm
Geiger counter test chart shows that there was very little Gamma radiation detected, when an Aluminum Beta shield was in place.
http://sccc.org.au/wp-content/uploads/2013/11/Lead-solder-64-grams-141113.jpg
This Alpha test was done by another person with different equipment. Alpha test chart of the solder using a LND 7317 pancake probe. Unshielded 532cpm, with a piece of paper between solder sample and probe 332cpm. So approximately 200 cpm was Alpha Radiation 532 – 332.
http://sccc.org.au/wp-content/uploads/2013/11/lead-solder-with-paper-between-sample-and-probe-532-cpm-to-332-cpm.jpg
The main peaks in the scintillator testing appear to be for radioactive Lead Pb-210 at 46 keV and Lead X-ray fluorescence. The “Americium Am-241 ?” maker in this chart is not confirmed, and has a considerable amount of uncertainty associated with it. We will have to wait for the company’s final report.
Here is a MCA Theremino software chart of a 64 gram sample of the lead solder.
http://sccc.org.au/wp-content/uploads/2013/11/Lead-solder-64-grams-221113-TV51-23c-45144.jpg
The best suggestion at present for the peak around 21 keV, is the X-ray fluorescence of another metal in the solder, eg., Rhodium, Palladium or Silver.
For further information and technical discussion on the radioactive lead solder detection, go to this Gamma Spectacular forum.
http://www.gammaspectacular.com/index.php?route=forum/post&path=540
Disclaimer: This is an amateur volunteer run service. Human error can provide incorrect information, and equipment malfunction can produce false readings. Do not rely on, or take action upon information presented here, without further research.
2013/11/23 at 5:06 pm
Australia,
Queensland,
Caloundra,
24th November 2013
Station location
http://sccc.org.au/monitoring/Australian-Map.jpg
Alert – On the 23rd it was 46% above the 4 year pre Fukushima day average for this location. What do these local alert levels mean, and how are they determined?
http://sccc.org.au/what-does-each-step-in-the-alert-level-colour-code-mean
These alert levels are set by the station operator, and are not based on any government alert level.
http://sccc.org.au/wp-content/uploads/2013/11/Caloundra-local-average-background-radiation-levels-November-2013.jpg
Here is last years November day average chart for comparison.
http://sccc.org.au/wp-content/uploads/2012/11/Caloundra-local-average-background-radiation-levels-November-20121.jpg
Large cloud masses where flowing from the tropics from around Darwin to the East Coast of Australia, during this period. This short animation of Northern, and Southern Hemisphere air circulation, shows why we can get detections so far south.
http://www.youtube.com/watch?v=qh011eAYjAA
It is suggested that during these periods of elevated free air background radiation detections, it would be wise to stay out of the rain. Here you will find local rain tests results explained in detail, plus why it is suggested to stay out of the rain during these elevated detection events.
http://sccc.org.au/pages/The-Food-Lab.html#Soil%20Testing%20Results
2013/11/13 at 4:44 pm
Australia
Queensland
Sunshine Coast
14th November 2013
Location
http://sccc.org.au/monitoring/Australian-Map.jpg
This short animation of Northern, and Southern Hemisphere air circulation, shows why we can get detections so far south.
http://www.youtube.com/watch?v=qh011eAYjAA
Here is the 24 hour data chart for the 13th November. Notice that there are hardly any peaks above 0.2 uSv/hr and yet the 24 average is 39.49% above average. Peak watching does not necessarily convey the true situation. An extra 1.0 uSv hour for one day is significant.
http://sccc.org.au/wp-content/uploads/2013/11/Caloundra-Australia-24-hour-local-radiation-background-chart-131113.jpg
It is hot and dry here at present, so this is a free air detection, not a Radon rain washout event.
What does a 40% increase in background radiation mean at my location.
Our local 4 year pre Fukushima nuclear disaster local background level average was 0.1 uSv/hr. A 40% increase in a day average detection here means that we receive approximately a 0.96 uSv hour increase in background radiation, for that day above average.
To put it another way, if the 40% increase in a day average was condensed into a one hour event, it would show on a Geiger counter as approximately 1.06 uSv/hr detection for one hour. (40% increase = 0.96 uSv hour + 0.1 uSv/hr local average = 1.06 uSv/hr)
Each 40% increase in the local background level here represents an additional ~1 uSv hour increase for that day.
I have set the colour coded Alert levels at the Sunshine Coast monitoring station here, to 40% increases.
You really need long term data recording and analysis of local background radiation levels, to clearly determine what is happening in any location. Monitoring station spot peak observations and alerts are helpful, but not good enough to fully understand what is happening. Average background increases can mean you are cumulatively getting a far bigger radiation dose, than from a short term peak detection.
If you are interested in trying your hand at charting here are some basics.
http://sccc.org.au/charting-templates
There is also information on charting in the free Geiger counter guide.
http://technologypals.com.au/wp-content/uploads/2012/03/Using-a-Geiger-Counter-to-test-food-for-Radioactive-Contamination.pdf
2013/11/03 at 4:05 pm
Australia,
Queensland,
Sunshine Coast,
October 2013 Local Background Radiation Report
Location,
http://sccc.org.au/monitoring/Australian-Map.jpg
This short animation of Northern, and Southern Hemisphere air circulation, shows why we can get detections so far south.
http://www.youtube.com/watch?v=qh011eAYjAA
October 2013 month average was 25% above the 4 year pre-Fukushima October average, and 6% above October 2012.
October 24 hour day average chart,
http://sccc.org.au/wp-content/uploads/2013/10/Caloundra-local-average-background-radiation-levels-October-2013.jpg
Month average chart for 2013,
http://sccc.org.au/wp-content/uploads/2013/02/Caloundra-monthly-average-background-radiation-levels-for-2013.jpg
Month average chart for 2012,
http://sccc.org.au/wp-content/uploads/2012/09/Caloundra-monthly-average-background-radiation-levels-for-2012.jpg
Previous reports can be found here,
https://www.enviroreporter.com/investigations/fukushima/radiation-station-sunshine-coast-australia/
2013/10/24 at 5:35 pm
Australia,
Queensland
Sunshine Coast
25th October 2013
Monitoring Station Location
http://sccc.org.au/monitoring/Australian-Map.jpg
Yesterday’s day average was 38% above the 4 year pre Fukushima day average. It is dry and windy here at present, so this is a free air detection increase, not a radon washout event. It is suggested that if it does rain, to stay out of it.
http://sccc.org.au/wp-content/uploads/2013/10/Caloundra-local-average-background-radiation-levels-October-2013.jpg
Local long term data can be found here.
http://sccc.org.au/archives/2630
—————————————————–
Alert Level detection Hawaii on Blackcatsystems monitoring map yesterday, was 157 uR/hr, presently at 155 uR/hr
http://sccc.org.au/wp-content/uploads/2013/10/Blackcatsystems-241013-Hawaii-157.jpg
http://www.blackcatsystems.com/RadMap/map.html
I looked at other monitoring networks with stations on the Hawaii islands, and could not see a any corresponding increased detections.
——————————————————
This netc monitoring system screen shot on Bobby1′s blog indicates a general increase in background across the west coast of the USA on the 24th.
http://optimalprediction.com/files/netc10-24-13.gif
2013/10/12 at 5:40 pm
Australia,
Queensland,
Sunshine Coast
September Report
Monitoring Location
http://sccc.org.au/monitoring/Australian-Map.jpg
This short animation of Northern, and Southern Hemisphere air circulation, shows why we can get detections so far south.
http://www.youtube.com/watch?v=qh011eAYjAA
The significant Isotopes detected in rain water tests during the month were Radon-222, Radon-220, Iodine I-129, Lead, Pb-210, Beryllium Be-7 and Uranium-235. If Uranium U-235 is present, even in trace amounts, it means a lot more Uranium 238 is also present. Uranium U-238 can’t be directly detected by the Gamma Scintillator equipment used for testing, as it is mainly an Alpha emitter.
Local Background Radiation Report
It was very dry in September with storms passing through on the 17th. The September 2013 month average was 2% above September 2012, and 15% above the pre Fukushime 4 year average. This means most of the detected local background increase was from free air detections, and had nothing to do with possible radon washouts.
September Day Averages
http://sccc.org.au/wp-content/uploads/2013/09/Caloundra-local-average-background-radiation-levels-September-2013.jpg
You can see that the chart became much more dynamic towards the middle of September. This dynamic has occurred in previous years, and correlates with more Northern tropical air breaking through the equatorial barrier, in the warmer months and generally peaking in December, January, February and March.
2013 Monthly averages
http://sccc.org.au/wp-content/uploads/2013/02/Caloundra-monthly-average-background-radiation-levels-for-2013.jpg
2012 Monthly averages
http://sccc.org.au/wp-content/uploads/2012/09/Caloundra-monthly-average-background-radiation-levels-for-2012.jpg
Full report on September rain event.
http://sccc.org.au/detection-of-radon-220-in-the-rain-september-2013
The fact that I-129 appears to be present in lots of recent tests, it begs the question, is it important to be taking a non contaminated dietary Iodine supplements to try to block the uptake of I-129?
* Everyone is different, and taking extra Iodine may be a risk for some people. On the other hand, under these circumstances, it may be the best thing for the majority.
We really need some expert medical advice on this subject. I see Infowars has come out with an Iodine supplement. Ask if they have tested their product for possible radioactive Iodine contamination, before considering purchasing this product.
I have no financial interest in this product. I have only put the links here for information purposes, and suggest you do further research before you consider purchasing any iodine supplement.
Disclaimer: This is an amateur volunteer run service. Human error can provide incorrect information, and equipment malfunction can produce false readings. Do not rely on, or take action upon information presented here, without further research.
“The Food Lab” report
Cesium 134/137 still found in drinking water across many regions of Japan, including Tokyo NRA June 2013 report.
http://www.fukuleaks.org/web/?p=11469
New reports like this are being added to The Food Lab constantly, so it is important to keep an eye on the latest reports coming in. This information can be accessed from these two sites.
https://www.enviroreporter.com/2013/02/radiation-food-lab/
http://sccc.org.au/archives/2861
Reports for the Alert Rain Event detected at Caloundra and Nimbin September 2013
Australia,
Queensland
Sunshine Coast
Location
http://sccc.org.au/monitoring/Australian-Map.jpg
This short animation shows Northern, and Southern Hemisphere air circulation. It clearly shows why we can get detections so far south. There is more equatorial barrier circulation break through during warmer months than winter.
http://www.youtube.com/watch?v=qh011eAYjAA
Summary of Report
The storms passed over the Nimbin area on the 16th, and Caloundra area on the evening of the 17th, and early morning of the 18th. Rain swabs were collected from both these rain events, and analyzed.
1. The rain swab collected at Caloundra was tested and found to contain both the decay daughters of both Radon-222, and Radon-220. It is common to get Radon-222 washouts, not Radon-220. Radon-222 is from the Uranium decay chain, and Radon-220 is from the Thorium decay chain.
This theory has been put forward by a contact in New Zealand. The Radon-220 decay daughter isotope detection here, is an indication that one or more of the underground coriums at Fukushima undergoing fast neutron fission. One or more coriums are possibly purifying, and operating in a mode of unmoderated fission. This would increase the yields of Thorium daughters.
2. Trace amounts of longer lived isotopes for Iodine I-129, Uranium U-235, Be-7 and Lead Pb-210 where also detected. This is not good, but probably far less than areas in the Northern Hemisphere are getting as fallout.
3. Here are some other theories why large Radon washout events are becoming more common.
Some of the very large Radon washouts that are occurring in Nimbin area may be related to the geography of the location. Why we have concerns about large Radon washout events.
http://www.radonseal.com/radon-health.htm
For more Technical details, charts and analysis, read on. (Comments, corrections, and suggestions are welcome)
“Alert Caloundra report 18th September 2013 – Storms overnight here, so I took rain swab off a car this morning. On testing it peaked at approximately 6 uSv/hr (1800 cpm) using two Russian SBM-20 tubes, and Theremino Geiger kit. Again it is suggested to stay out of the rain. This rain sample is decaying quickly which suggests it was a large Radon-222 washout.”
This long period Geiger counter test chart indicated the presence of other Isotopes besides Radon-222 washout decay daughters.
Geiger Counter Test Chart
http://sccc.org.au/wp-content/uploads/2013/09/Rain-swab-Caloundra-180913-AV-TV48-+-B-+-text.jpg
Explanation of Geiger Counter charts
http://sccc.org.au/wp-content/uploads/2013/06/Rain-swab-090613-Radon-decay-+-text.jpg
This swab was placed in the scintillator lead chamber for further testing.
Scintillator test chart
http://sccc.org.au/wp-content/uploads/2013/09/Rain-swab-Caloundra-18th-September-2013-TV5-20c-93456-+-zeolite-+-text.jpg
The main peaks are decay daughter isotopes of Radon-220, Lead Pb-212 (238 keV), X-ray at 77 keV, and Thalium Tl-208 (511, 583 keV), plus peaks for long lived isotopes of Iodine I-129, Uranium U-235, Beryllium Be-7, and Lead Pb-210. Because the rain swab scintillator test was started less than 24 hours after it was collected, there are some Radon-222 decay daughter isotopes of Lead Pb-214 and Bismuth Bi-214 also present.
Day average background levels have also been very volatile in this area for last 14 days, recently hitting 30% above the pre-Fukushima 4 year average.
September 2013 day average chart.
Alert Nimbin Monitoring Station report 16th September 2013 – Nimbin is located on the east coast of northern New South Wales Australia.
“…Rain began this morning…. drove to town about midday, got home about 30min ago and sat my SBT 10 on the roof of the car, as I gathered my things out of the back seat, and it started beeping. It was reading 0.38uSv/h….moments later I took a swab off the whole car roof (small sedan) and put it to my LND 7317 and got ~6500CPM for the first few minutes. I’ll send a photo and chart soon….” Here is the decay chart and detection photo of this detection, kindly provided by the Ninbim radiation monitoring station operator.
NOTE: We haven’t seen any studies on the heath effects of being exposed to large Radon washout events like this. It is only a suggestion to take these precautions in the Rain Alert emails. If you live in the area, it is suggested to stay out of the rain during these events, plus keep children and pets out of it also. If you do get wet, have a good shower. It maybe a very large radon washout event, that seems to be common to the Nimbin area. This rain washout could also have other isotopes in it. Without further testing with better equipment, there is no way of knowing.
Another report indicating recent Fukushima releases went far and wide.
“Radiation plume after Japanese earthquake. Iodine-131 cloud reached France.”
Peter
Disclaimer: This is an amateur volunteer run service. Human error can provide incorrect information, and equipment malfunction can produce false readings. Do not rely on, or take action upon information presented here, without further research.
2013/09/21 at 4:24 pm
Australia,
Queensland
Sunshine Coast
Preliminary report of rain event detections
Location
http://sccc.org.au/monitoring/Australian-Map.jpg
“Alert Caloundra report 17th September 2013 – Storms overnight here, so I took rain swab off a car this morning. On testing it peaked at approximately 6 uSv/hr (1800 cpm) using two Russian SBM-20 tubes, and Theremino Geiger kit. Again it is suggested to stay out of the rain. This rain sample is decaying quickly which suggests it is a large radon washout.”
The long period Geiger counter test chart indicated the presence of other Isotopes besides Radon washout decay daughters. (So it was placed in the scintillator lead test chamber for further testing.)
http://sccc.org.au/wp-content/uploads/2013/09/Rain-swab-Caloundra-180913-AV-TV48-+-B-+-text.jpg
Day average background levels have been very volatile here the last 11 days. September 2013 day average chart.
http://sccc.org.au/wp-content/uploads/2013/09/Caloundra-local-average-background-radiation-levels-September-2013.jpg
NOTE: Scintillator testing of the rain swab collected on the 18th September at Caloundra, is indicating the presence of a Zeolite type material. A source of this could be volcanic ash from the recent Indonesian volcanic eruptions.
When testing is complete, the full report will be posted here. The scintillator test chart will be provided soon. Preliminary analysis also indicates the presence of trace amounts of Iodine I-129, and Lead Pb-210.
Alert Nimbin Monitoring Station report 16th September 2013 – Nimbin is located on the east coast of northern New South Wales Australia.
“…Rain began this morning…. drove to town about midday, got home about 30min ago and sat my SBT 10 on the roof of the car, as I gathered my things out of the back seat, and it started beeping. It was reading 0.38uSv/h….moments later I took a swab off the whole car roof (small sedan) and put it to my LND 7317 and got ~6500CPM for the first few minutes. I’ll send a photo and chart soon….” Here is the decay chart and detection photo.
http://sccc.org.au/wp-content/uploads/2013/09/Nimbin-rain-swab-decay-chart-and-detection-16th-september-2013.jpg
We haven’t seen any studies on the heath effects of being exposed to large Radon washout events like this. It is only a suggestion to take these precautions in the Rain Alert emails. If you live in the area, it is suggested to stay out of the rain during these events, plus keep children and pets out of it also. If you do get wet, have a good shower. It maybe a very large radon washout event, that seems to be common to the Nimbin area. This rain washout could also have other isotopes in it. Without further testing with better equipment, there is no way of knowing.
Another report indicating recent Fukushima releases went far and wide.
“Radiation plume after Japanese earthquake. Iodine-131 cloud reached France.”
http://optimalprediction.com/wp/radiation-plume-after-japanese-earthquake-iodine-131-cloud-reached-france/
Report from Nimbin Monitoring station Queensland Australia September 16th 2013.
“…Rain began this morning…. drove to town about midday, got home about 30min ago and sat my SBT 10 on the roof of the car, as I gathered my things out of the back seat, and it started beeping. It was reading 0.38uSv/h….moments later I took a swab off the whole car roof (small sedan) and put it to my LND 7317 and got ~6500CPM for the first few minutes. I’ll send a photo and chart soon….”
We haven’t seen any studies on the heath effects of being exposed to large Radon washout events like this. It is only a suggestion to take these precautions in the Rain Alert emails.
If you live in the area, it is suggested to stay out of the rain during these events, plus keep children and pets out of it also. If you do get wet, have a good shower. It maybe a very large radon washout event, that seems to be common to the Nimbin area. This rain washout could also have other isotopes in it. Without further testing with better equipment, there is no way of knowing.
2013/09/08 at 5:46 pm
AUSTRALIA
09.09.2013 – Detection of radioactive Iodine I-129 in roof gutter moss Australia.
I recently collected 82 grams of moss that had been growing in roof gutter here, and tested it. It was very wet here for the first half of 2013. August has had no rain, so the moss sample was dry.
I am located here on the east coast of Australia.
http://sccc.org.au/monitoring/Australian-Map.jpg
Moss growing in roof gutter
http://sccc.org.au/wp-content/uploads/2013/09/Moss-growing-in-roof-gutter.jpg
Moss in Marinelli beaker for testing
http://sccc.org.au/wp-content/uploads/2013/09/Roof-gutter-moss-82-gams-in-marinelli-beaker.jpg
Test chart of moss sample using experimental Theremino MCA version 5.
If my assessment is correct, this Southern Hemisphere detection is not a good sign. This is a lot of Iodine I-129. The other possibility is it is Lead Pb-210, or a mixture of both. The main peak is much closer to 40 keV than to 47 keV for lead Pb-210. I have tested this sample with different software, and calibrated a number of times, it very much looks like I-129.
This means it is bio-accumulating. So even though our background levels here have not risen a lot, bio-accumulations could present a more serious issue. The moss also had some other material mixed in with it, that it was growing on, leaves and other organic matter. This test result also suggests that there would be more 1-129 in fallout in the Northern Hemisphere.
I have discussed this test result with some of my contacts here.
Why so much I-129, and not Cesium etc.?
The conclusion is because of its volatility. It can also easily volatilize in an environment, as the temperature increases.
This would allow it to easily spread long distances, like Iodine I-131.
Japanese study of I-129 pre-Fukushima Nuclear disaster.
http://www.ncbi.nlm.nih.gov/pubmed/23829385
Another pre-Fukushima Argentina study, indicates that Norther Hemisphere I-129, can reach the Southern Hemisphere. This study shows I-129 has migrated from nuclear fuel reprocessing plants at Cape de La Hague (France) and Sellafield (UK).
http://www.sciencedirect.com/science/article/pii/S0048969712006353
For the technically minded – Testing procedures, and Becquerel activity calculations.
Scintillator Model:
Alpha Spectra NaI 818/2B, resolution 7%
Voltage setting; 800 Volts
Efficiency 7% at 662 keV
I used radioactive Americium (Am-241), from a smoke detector in the test chamber, to calibrate the low energy peak position, and also the scintillator efficiency at around 40 keV.
Here is the calibration chart for reference.
http://sccc.org.au/wp-content/uploads/2013/09/Moss-+-Americium-+-text.jpg
Estimate of scintillator efficiency at 40 keV
Smoke detector Am-241 activity = 37,000 cps, from my research approximately 1% of this activity is Gamma.
1% is Gamma = 3700 cps (36% of that 1% is at 60 keV)
37 x 36 = 1332 cps = 100% gamma at 60 kev
1295 / 100 = 13.32 = 1%
693 cps was the actual cps in chamber for this peak region
693 / 13.32 = 52% efficiency at 60 keV
Estimated efficiency at 40 keV is approximately 52%.
I used Japanese BecqMoni MCA software to calculate the activity.
Using 52% efficiency at 40 keV.
net count – background = 80039
80039 / 52 = 1,539 (1%)
1,539 x 100 = 153,900 (100%)
Time of test = 79700 seconds
153900 / 79700 = 1.931 cps
82 grams in weight 1000 / 82 = 12.195
1.931 X 12.195 = 23.5 Bq/kg
This may not be an absolute quantification of the scintillator tube’s efficiency at 40 keV, but we are dealing with moss in a large marinelli beaker here. The efficiency of activity is going to be less than the 52% for the Am-241. So the 23.5 Bq/kg activity estimation is probably conservative.
July 2013 Report, Fukushima very unstable, Pacific Sea Food Risk, Southern Hemisphere Background, and Rain reports
Fukushima Criticalities Occurring?
The Fukushima Nuclear disaster site has been getting very unstable. In early July, possible fires were seen on Fukushima webcam. There also have been lots of large steam events witnessed recently on the Fukushima live webcams. These events seem to be following a two week cycle at present.
Thanks to enenews webcam forum commenter ‘pure water’ for the screen shots of the possible fire at reactor 3. One other suggestion is it is not a fire, they were burning off Tritium near the reactor 3 building.
http://s1298.photobucket.com/user/porewater4/media/r_zpsc356ad06.png.html
Radioactive Iodine I-131 was also detected in sludge in nearby cities. There were also increased levels of Tritium, Cesium and Strontium, detected in recent tests of water from bore holes at the Fukushima nuclear plant. This all points to the possibility that underground criticalities are occurring, or have occurred, recently at the Fukushima Nuclear Disaster site.
Here is a list of International radiation monitoring stations if a major event happens at Fukushima.
http://sccc.org.au/international-radiation-monitoring-stations
Consumption of any Northern Pacific Ocean sea food is risky
Headline in a recent Japanese news article.
“Tepco now admits radioactive water entering the sea at Fukushima, No. 1 Fisheries exec shocked by utility’s flip-flop on groundwater’s flow.”
Shocked, really! Anyone who has taken any notice of what has been happening at the Fukushima Nuclear disaster site from the very beginning, would not be shocked. Contamination has flowed into the Pacific Ocean for 28 months now. They use the word leak, to play it down. Their estimate is 800 tons a day of ground water is flowing into the Pacific Ocean. This is probably a very conservative estimate! It’s a flood, not a leak!
Look under the Pacific Ocean heading at,
https://www.enviroreporter.com/2013/02/radiation-food-lab/
to see the magnitude of these contamination reports.
It is important to keep an eye on reports here, so you know what to avoid. There are new reports being posted constantly. Contamination detection reports of Korean, and Atlantic Canadian seaweed are two of the very newest.
Background Radiation Levels
Monitoring station location
http://sccc.org.au/monitoring/Australian-Map.jpg
July’s 2013 month average was 6% above the pre Fukushima nuclear disaster four year average. It is lower than July 2012 month average of 9% above. Local radiation levels have been relatively lower during winter months here over the last couple years. Our theory for this seasonal change is that less air breaks through the equatorial barrier during the winter months.
2013 month average chart
http://sccc.org.au/wp-content/uploads/2013/02/Caloundra-monthly-average-background-radiation-levels-for-2013.jpg
2012 month average chart
Day average chart for July 2013
Rain Report
There were very small traces of Iodine I-129, Lead Pb-210, Uranium U-235, Thorium Th-234 and Beryllium Be-7, detected in this month’s rain test. It was in smaller amounts compared to previous months.
2013/07/08 at 6:05 pm
Australia,
Queensland
Caloundra
Location
http://sccc.org.au/monitoring/Australian-Map.jpg
June 2013 report on local background radiation levels, and rain test results.
Background radiation report
Here are the June charts for this location, day averages, 2013 month averages, and for comparison, the 2012 month averages. The June 2013 local background radiation level was 7% above the 4 year pre Fukushima June average.
Day averages June 2013
http://sccc.org.au/wp-content/uploads/2013/06/Caloundra-local-average-background-radiation-levels-June-20131.jpg
Month averages 2013
Month averages 2012
Rain water Test
Junes local rain water test detected Beryllium Be-7, Uranium U-235 ?, Lead Pb-210, and possibly I-129 in trace amounts. (See test chart). At the location here, June was a very wet month, with over 300 mm of rain. A lot of water went through the filter. Even so, the amount of these isotopes that were detected, was less than previous months.
Food Report
Food contamination fears still persist in Japan, and will for decades. This short video by Jamie Williams of the New York Times, clearly explains why private food testing has become a necessity to protect families, and children in Japan.
http://www.youtube.com/watch?v=qwQvZTFulPw
Keep an eye on Enviroreporter’s “Radiation Food Lab”
https://www.enviroreporter.com/2013/02/radiation-food-lab/
for the latest food detection reports.
Southern Hemisphere rain water test 2nd June 2013
May be a detection of Iodine I-129 from the tin roof down pipe polyester filter. It is not conclusive. Rain water was passing through this polyester filter off a 36 sqm tin roof at a location on the Sunshine Coast. If it is, it is still a very small detection of I-129, because the filter was in place for all of May. Mind you, not all of it would have been captured using this filter system. Lots of Beryllium Be-7 is also present! If I-129 is present in this Southern Hemisphere test, it would suggest that there is a lot more in the rain in the Northern Hemisphere!
For background on this subject, read this article on using Be-7 as a tracer for I-129.
There is a natural Beryllium Be-7 and Lead Pb-210 cycle here in the Southern Hemisphere. There is more Beryllium Be-7 and Lead Pb-210, detected in rain washouts, during summer than in winter. This appears to be an above average detection of Beryllium Be-7, and Lead Pb-210 in this test for May 2013.
Be-7 is produced by cosmic ray spallation in the upper atmosphere. The Sun had been relatively quite during May 2013. It takes around two weeks to reach sea level.
It is my understanding that the Japanese have been pumping large amounts of liquid Nitrogen onto the multiple molten coriums at the Fukushima Nuclear disaster, to cool them down. The neutron bombardment, plus lots of underground corium venting, has also been releasing large amounts Beryllium Be-7 and 1-129.
Test chart using experimental Theremino MCA V4.5 software.
Because the I-129 at 39.6 keV, and Pb-210 at 46.5 keV, have energy peaks so close together, it can be difficult to tell them apart with a NAI scintillator. If they are present at the same time, the peak that shows will drift toward the 39.6 kev if more I-129 is present, and towards 46.5 keV if more Pb-210 is present.
Information on Radioactive Iodine I-129
Radioactive I-129 is a lot less radioactive than the I-131, they are both released during a nuclear reactor melt down, at a fixed ratio of 3 parts iodine-131 to one part iodine-129.
Half life 1-131 8 day, in the environment 80 days +.
Half Life I-129 15.7 million years.
I-129 very tiny amounts can also be naturally produced in the upper atmosphere, by a process called cosmic spallation.
1-129 can bio-accumulate in the environment and in food.
Discussions on the implications, if it this is a detection of I-129
The questions being debated here are.
A. If it is a I-129 detection, is it from the Fukushima Nuclear Disaster?
B. Does it pose a health risk? (It is far less radioactive that I-131.)
C. Would it be wise to take Iodine supplements, if a significant extra amount of it was being released into the environment, and bio accumulating?
——————————————————
Feedback from the Internet
This is a reply by poster Potrblog on https://www.enviroreporter.com I think it is a very good answer to the questions above.
“A: There is no 100% quantitative way to tie it to Fukushima, you can only make qualitative correlations based on the magnitude detected vs what would be expected, and other factors like opportunity and timing.
B: I-129 is the most dangerous thing listed in the EPA’s drinking water limits. Its limit is 1 piCu/L. The limit for I-131 is 3 piCu/L. see
http://www.epa.gov/ogwdw/radionuclides/pdfs/guide_radionuclides_table-betaphotonemitters.pdf
C: That is a question people have to answer for themselves; Post Fukushima, my concern would be is the Iodine supplement also contaminated with I-129? (Japan produces 21% of the worlds iodine, see http://www.iofina.com/mid-stream-iodine-business/iodine )”
—————————————————–
Taking Iodine supplements is a question people have to decide for themselves.
Iodine supplements are not for everyone. We are all different. Some people taking them can get adverse side effects. No one should take them without medical advice from their doctor.
The possible I-129 detection here is very small, and not conclusive.
The other isotopes detected in the May rain test are also of concern, but at trace levels at present. Beryllium Be-7 being the most prominent.
2013/06/05 at 5:57 am
Is this proof, that some of the Beryllium Be-7 in our rain tests here in Australia, is from Fukushima?
This is open for discussion, I am interested in positive feedback,
and alternative views on the test results.
Read this previous post in the EnviroReporter “Radiation Food Lab”, to get information on why a I-129 detection is a pointer to Beryllium Be-7 coming from Fukushima.
https://www.enviroreporter.com/2013/02/radiation-food-lab/#comment-239775
Looks like a detection of Iodine I-129 from the tin roof down pipe polyester filter. It was collecting rain off a 36 sqm tin roof at my location.
Test chart
If it is, it is still a very small detection of I-129, because the filter was in place for all of May. Mind you, not all of it would have been captured using this filter system. Lots of Beryllium Be-7 is also present! If this is present in the Southern Hemisphere, it would suggest that there is a lot more in the rain in the Northern Hemisphere!
Nimbin Australia has been getting huge Radon washouts this year. The rain swab test charts from that location have been showing lots of Lead Pd-210 and Beryllium Be-7. Lead Pb-210 is the end isotope of the Radon daughter decay chain.
Nimbin test chart
Theory
Because the I-129 at 39.6 keV, and Pb-210 at 46.5 keV, have energy peaks so close together it can be difficult to tell them apart with a NAI scintillator. If they are present at the same time, the peak that shows will drift toward the 39.6 kev if more I-129 is present, and towards 46.5 keV if more Pb-210 is present.
The experimental Theremino MCA V4.5 software used in this test is a bit noisy near background. It is a lot more sensitive than the other scintillator MCA software I use. It is just that the noise at low CPS activity can make it harder to interpret isotope peaks.
Disclaimer: I am an amateur. Human error can provide incorrect information, and equipment malfunction can produce false readings. Do not rely on, or take action upon information presented here, without further research.
2013/06/02 at 6:02 pm
Australia,
Queensland,
Sunshine Coast,
3, June 2013
Monthly report
Monitoring location
http://sccc.org.au/monitoring/Australian-Map.jpg
The May 2013 monthly average was 7% above the pre-Fukushima monthly average for May. This is the same as May 2012. (See charts below) This would suggest that at our location, background radiation levels have stabilized for the time being.
Month averages 2013
Month averages 2012
May, day local background averages
We now also have in place a new live monitoring station in Australia, near Melbourne, at Grovedale in Victoria . The live Grovedale Victorian Australian charts can be found on this page.
http://sccc.org.au/monitoring/sunshinecoast-monitoring-station.html
2013/05/20 at 4:07 pm
Scintillator rain swabs test chart, for the 2nd and 11th May alert level rain event, at Nimbin Australia. It appears to be another very large Radon washout. The levels of Lead Pb-210 and Beryllium Be7 detected in these rain swabs, is much less than the Nimbin late January, and early February 2013 rain swabs.
http://sccc.org.au/wp-content/uploads/2013/05/Nimbin-rain-swabs-180513-TV38-18c-47659.jpg
Lead Pb-210 is the end product of the Radon isotope daughter decay chain.
April 2013 report on local background radiation levels, and rain test results.
Monitoring site location.
http://sccc.org.au/monitoring/Australian-Map.jpg
April’s month average 9%, is lower than last years April 12% above average.
Monthly average for 2012
Monthly average for 2013
Which brings us back to the Radon daughter isotopes, Uranium U-235 and Beryllium Be-7 as the main detected components in the latest April rain tests, collected at this location. Even though the refined Uranium was detected is in trace amounts, its presence is of considerable concern.
Theory
As the seasons change from summer to winter, the Northern Hemisphere mixed tropical air, flowing into the Southern Hemisphere, is replaced by the Southern ocean air flow, and our radiation levels drop.
Here is a link that shows global air flow circulation. As you can see, thin fingers of air come from the tropics deep into the Southern Hemisphere. This happen more in summer than in winter.
http://www.youtube.com/watch?v=qh011eAYjAA
Important Note: Since the Mullumbimby late January and early February 2013 detection reports were posted, at http://sccc.org.au/archives/2630, the owner of the Gamma Scout Geiger counter, reported his unit had developed a fault. That fault was investigated, and the unit has since been repaired. He now has a Gamma Scout Geiger Counter, and a Theremino Geiger kit set up with multiple SBM-20 Russian tubes. This means he can now cross check between units, to verify each unit is working correctly.
This brings into question his reported detected levels, for late January and early February 2013, at his location in Mullumbimby. Multiple Geiger counters at different locations, spread over a wide area, detected elevated local background radiation levels during this event. This was from the Sunshine Coast in Queensland, to the Northern New South Wales East Coast. The highest detections where on the Northern New South Wales East Coast. The other units used by people at different locations were all reported to be working correctly during this time, and still are. Most of these private monitoring stations have multiple Geiger Counters to cross check against, so they can verify detections.
2013/05/11 at 6:21 pm
Rain Alert Nimbin monitoring station north east coast New South Wales Australia, 11 May 2013.
“Heavy downpours this morning have brought yet more radon progeny. A swab taken off the roof of the car (small sedan) this morning gave 2755cpm (LND7317) or ~6.8uSv/h. Ouch!”
Nimbin Update: This update information has been provided by the Nimbin Monitoring station.
“After more than 500 minutes, here’s the decay chart,
http://www.youtube.com/watch?v=7UHYRyx_52c&feature=youtu.be
I’ll send this rain swab to be analysed too…”
Note: The Nimbin monitoring station has multiple Geiger Counters to verify detections.
——————————————–
We haven’t seen any studies on the heath effects of being exposed to large Radon washout events. It is only a suggestion to take those precautions in the in the post on this subject below. Why is the east coast of Northern New South Wales is getting such large radon washout events? We have some theories, but don’t really know.
Here is a link to more information on Radon.
http://hyperphysics.phy-astr.gsu.edu/hbase/nuclear/radon.html
2013/04/30 at 5:46 pm
Australia,
Queensland,
Sunshine Coast,
1st May 2013,
April 2013 report on local background radiation levels, and rain test results.
Monitoring site location.
http://sccc.org.au/monitoring/Australian-Map.jpg
April’s month average 9%, is lower than last years April 12% above average.
Monthly average for 2012
Monthly Average for 2013
Which brings us back to the Radon daughter isotopes, Uranium U-235 and Beryllium Be-7 as the main detected components in the latest April rain tests, collected at this location. Even though the refined Uranium was detected is in trace amounts, its presence is of considerable concern.
Theory
As the seasons change from summer to winter, the Northern Hemisphere mixed tropical air, flowing into the Southern Hemisphere, is replaced by the Southern ocean air flow, and our radiation levels drop.
2013/04/02 at 4:00 pm
Australia,
Queensland
Sunshine Coast
2nd April 2013
March 2013 report
This month saw lower background day averages than the January (52%) and February (39%) highs. The whole month background average was 32% above the 4 year pre-Fukushima March background average. It was also higher than last March’s (2012) month’s average of 24% above average. A few day averages towards the end of the month went to 40% + above average. See charts.
Let’s see what a 42% increase in a day average means. It means there was and extra 0.042 uSv/hr increase for 24 hours. That is 24 x 0.042 or an extra 1.008 uSv radiation dose for that day. Let’s say that the 1.008 uS/hr extra was detected for just one hour in that day, instead of being spread over the whole 24 hour day. 0.10uSv/hr normal background for one hour + 1.008 = 1.108 uSv/hr for that hour. Most people with Geiger counters who detected a 1.108 uSv/hr detection for one whole hour would be ringing alarm bells!
2013/03/24 at 5:35 pm
Australia,
Queensland,
Sunshine Coast,
25th, March, 2013
Background Radiation levels here have increased over the last 3 days, to 41%, 40%and 44% above the pre-Fukushima nuclear disaster 4 year average. The 4 year pre-Fukushima day average was 0.10 uSv/hr. Yellow bars in these charts mean background is 40%+ above average.
http://sccc.org.au/wp-content/uploads/2013/03/Caloundra-local-average-background-radiation-levels-March-2013.jpg
It is important to understand what significance increases in day average radiation background levels mean. The 42% increase in a day local background radiation levels is a lot of extra radiation exposure.
At our location 0.10 uSv/hr was the pre-Fukushima nuclear disaster day average. Lets see what a 42% increase in a day average means. It means there was and extra 0.042 uSv/hr increase for 24 hours. That is 24 x 0.042 or an extra 1.008 uSv radiation dose for that day.
Lets say that the 1.008 uS/hr extra was detected for just one hour in that day instead of being spread over the whole 24 hour day. 0.10uSv/hr normal background for one hour + 1.008 = 1.108 uSv/hr for that hour. If any of you with Geiger counters were to detect 1.108 uSv/hr for one whole hour, you would be ringing alarm bells!
Average background increases can mean you are cumulatively getting a far bigger radiation dose, than from a short term peak detections may indicate. What is we needed are lots of monitoring stations to provide day, month, and year average background level information, as well as peak detections.
All this charting will pay off in the end, because you will clearly see if your local background is increasing over time. Peak detection is only part of the story. Without long term detailed charting, you won’t see if your community’s monthly, or yearly radiation exposure is increasing.
You don’t need to do this on a computer. If you don’t have a computer, or the skills to use computer charting software, you can simply use a ruler and pencil to create a chart. Using charting paper you can get from your local stationers is better. A simple join the dots chart is good enough.
Most digital Geiger counters will display the day’s average background with the press of a button. If your Geiger counter starts calculating the average from 12 am the night before, do this. At a set time every day just before bed time, the later the better, press the button to display the days average. Mark the date and amount on your chart. If you do this every day, it will give you a good idea what is happening with your local background radiation levels over time. Some Geiger Counters come with software that will automatically chart the average for you.
It would be interesting to know how much world average background radiation levels have increased since Fukushima, and if they are still increasing.
A free charting tutorial, and chart templates can be found here.
http://sccc.org.au/charting-templates
2013/03/17 at 3:33 pm
Australia,
Queensland,
Sunshine Coast,
18th, March, 2013
Background Radiation levels here have increased in the last 24 hours, to 42% above the pre-Fukushima nuclear disaster 4 year average. The 4 year pre-Fukushima day average was 0.10 uSv/hr.
(Yellow bars in these charts means background is 40%+ above average.)
2013/02/27 at 2:52 pm
Australia,
Queensland,
Sunshine Coast
Beryllium Be-7 and traces of Uranium U-235, found in latest rain roof down pipe capture test. This capture was of a rain event that came through the local area between the 16th to the 19th February 2013.
The charcoal sample is left for a few days, to let any Radon decay daughter isotopes decay away before testing.
The other very small peaks showing in this chart could possibly be trace detections of other isotopes. At these small detections levels, they could also be created by a bit of random variation in counts in the background level over the time of the tests, showing up in the tests results.
A lot of water flowed through this charcoal, in the down pipe filter, to get these detections.
Down pipe filter design
http://sccc.org.au/wp-content/uploads/2013/02/Roof-down-pipe-filter.jpg
There is approximately 880 grams of activated charcoal in the gray pipe section. When a collection test is finished the charcoal is removed and warmed in the sun to dry it out. It is then emptied into a large marinelli beaker, and placed in the scintillator test chamber.
If you have better equipment to test with than a Geiger counter, I think this method is a much better detection system for detecting trace amounts of fallout. The paper swab system is a quick, and effective collection system, for a Geiger counter test.
The side pipe is to release pressure if the flow rate gets to much, or the particulate filter starts to get blocked.
Making filter
http://sccc.org.au/wp-content/uploads/2013/02/making-the-filter.jpg
Inserting filter
http://sccc.org.au/wp-content/uploads/2013/02/inserting-filter.jpg
The side pipe is at a steeper angle than is shown in this picture, so as to improve the flow rate through the charcoal filter.
During a rain event it maybe necessary to remove the filter, and replace it with a new one. It can get blocked from the first down flows off the roof, if it hasn’t rained in a while. You can do this easily and quickly by putting your hand in through the side pipe and removing the old filter, and replacing it with a new one.
Always use disposable surgical gloves when handling a rain swab, charcoal or filter, when using either testing system. Also keep your hands away from your face, and wash your hands well afterwards. You have no idea what you may have captured!
2013/02/08 at 11:38 pm
Alert level late January 2013 rain swab tests report, (09/02/2013) Tested the Alert level +++ rain swabs collected at a private monitoring station on the east coast of northern New South Wales Australia. They were collected in late January, during a flooding rain event that had come down the east coast of Australia, from the
tropics. Here is the test chart results of these rain swabs.
There were small traces of Uranium U-235 detected in this test result, plus the signature of the fallout isotope/isotopes, at around 492 keV.
Report at the time.
“Well, today I broke the record for high detections in rain samples. 2700cpm or ~10uSv/h (LND 7317) off an area the size of a Corolla bonnet. I’m logging its decay…”
Photo: http://sccc.org.au/wp-content/uploads/2013/01/Nimbin-Rain-swab-2013-01-27-11.42.12.jpg
This is the third test sample tested here, that found the signature of the fallout isotope/isotopes, at around 492 keV.
1. It was detected in a local soil sample last year, on the Sunshine Coast. Here is that test chart of that soil sample using PRA scintillator software. (In the test above Theremino MCA software was used.)
http://sccc.org.au/wp-content/uploads/2012/08/Unusual-soil-sample-040812-64-13.jpg
2. It was detected in the activated charcoal down pipe capture test.
3. Detected in the cloth rain swabs.
Submitted on 2013/02/05 at 3:13 pm
Special Rain WaterTest Report
Traces of U-235, and mystery Isotope found in local rain water test, on the Australian east coast.
Around 880 grams of activated charcoal was placed in the down pipe from a tin roof, just before the major flooding weather event passed over the area in late January 2013.
A reference test chart of the charcoal was made, so it could be compared with the down pipe charcoal capture test. The activated charcoal came from China, and already had some isotope contamination. It was used anyway.
After this weather event had passed, the down pipe charcoal was then dried in the Sun. The charts here are a comparison between the reference, and the down pipe test.
As you can see, the charcoal filter did capture some significant isotope markers.
A lot of water went through this filter to get these results, so in overall terms, they are small detections. I think this proves we are getting fallout, but not as much as we expected.
U-238 produces a small amount of gamma at 50 (0.06%) & 114 (0.01%) keV and X-rays at 16 & 12 Kev. U-235 puts out a lot more gamma at 186 (57%), 144 (11%) and 163 (5%) kev and X-rays at 89 and 93 keV.
This is probably the reason I was unable to detect U-238 directly at these low levels, when it has such a low gamma output? This brings us back to increasing Radon levels, as the biggest contributor to increasing background levels here.
Open to positive suggestions, feedback or corrections, plus any suggestions as to what the isotope or isotopes, might be, at around 492 kev.
Interestingly, I also detected this mystery isotope in a soil sample I collected around 15 km west of my location last year.
Here is that test chart of that soil sample using PRA scintillator software. (In the test above Theremino MCA software was used.)
http://sccc.org.au/wp-content/uploads/2012/08/Unusual-soil-sample-040812-64-13.jpg
“Unusual soil sample chart has a radioactive isotope in it, at approximately 490 keV, which has not been identified yet. It is the second blue peak in the chart. There have been lots of suggestions as to what it could be, but no positive identification yet. If you think you know what it is, leave your suggestion in the comment section.”
In nature, uranium is found as Uranium-238 99%, Uranium-235 0.72%, and a very small amount of Uranium-234 0.005%. In a nuclear reactor using enriched refined Uranium, the percentage of U-235 is significantly increased. Enriched Uranium in light water reactors has concentrations of around 3% to 5% of U-235.
The small amount of U-235 in the rain wash out means there is a lot more U-238 in the atmosphere with it, if it is purified Uranium.
Here is a test chart of Uranium ore, Uraninite. This sample was kindly loaned to me by Spectrometising. This chart has text peak markers to help you. As you can see,if it was Uranium contamination from a mine, you would expect to see significant peaks of radioactive Lead Pb-214 and Bismuth Bi-214 showing up.
http://sccc.org.au/wp-content/uploads/2012/08/Uraninite-Calibration-050812-61.752-21.jpg
2013/02/04 at 10:05 pm
Alert level Mullumbimby Australia 2nd to 4th January 2013.
Mullumbimby in Northern New South Wales Australia, is still getting alert level local background, with day averages at times above 0.40 uSv/hr (50 CPM), plus peaks over 1.20 uSv/hr (150 CPM). Normal background is generally around 0.12 uSv/hr (11 CPM) , see 24 hour charts for the 2nd, 3rd, and 4th of February.
http://sccc.org.au/wp-content/uploads/2013/02/Mullumbimby-radiation-levels-february-2nd-2013.jpg
http://sccc.org.au/wp-content/uploads/2013/02/Mullumbimby-radiation-levels-february-3rd-2013.jpg
http://sccc.org.au/wp-content/uploads/2013/02/Mullumbimby-radiation-levels-february-4th-2013.jpg
(Note: Mullumbimby Geiger Counter reported as being faulty)
Since the Mullumbimby late January and early February 2013 detection reports were posted, the owner of the Gamma Scout Geiger counter, reported his unit had developed a fault. That fault was investigated, and the unit has since been repaired. He now has a Gamma Scout Geiger Counter, and a Theremino Geiger kit set up with multiple SBM-20 Russian tubes. This means he can now cross check between units, to verify each unit is working correctly.
This brings into question the accuracy of the reported detected levels, for late January and early February 2013, at the Mullumbimby location.
2013/01/27 at 10:11 pm
Australia
Sunshine Coast,
28th, January, 2013.
Yesterday set a day average detection record for this location. It was 0.213 uSv/hr, or 113% above average. The highest day average ever recorded here!
This morning I am also getting multiple Geiger counter alarms. It is set to alarm at 0.50 uSv/hr.
Spot peak observations and alerts are helpful, but not good enough to fully understand what is happening in your local area. Day average background increases can mean you are cumulatively getting a far bigger radiation dose, than from a short term peak detection would indicate.
2013/01/17 at 4:54 pm
Australia,
Queensland,
Sunshine Coast,
18th, January, 2013
Since the 16th December 2012, 31 days out of 32 have been 40% above the local background radiation 4 year pre-Fukushima average.
See the charts for December 2012 and January 2013, a chart yellow bar means it is 40% + above average, and a green bar is below 40%, meaning levels are average or slightly elevated.
Australia,
Queensland,
Caloundra,
2nd, January, 2013
Food Detections Report
A number of new items have been added to “The Food Lab” international food contamination list. There is an increasing number of food items being detected with radioactive contamination from both Japan, and America.
To see the latest detections, please visit “The Food Lab” regularly.
http://sccc.org.au/archives/2861
Detection of Radiation in Gift
It is suggested that those of you with Geiger Counters check everything that comes into your house. Imported earrings from the USA, that were to be given as a gift to a friend, were found to have gems embedded in them that tested 0.90 uSv/hr. This is probably not as a result of Fukushima contamination. We are doing more sophisticated tests to find out the source of the radioactive content. I will report those findings in another report.
The Free Geiger Counter Guide has just had another update, with a couple suggestions on Geiger Counter kits costing $100, or under.
BEGINNING 2013
END 2012
December 2012 report on local background radiation levels
Here is a chart for December 2012, plus this years monthly average chart. This December was 43% above the pre-Fukushima 4 year average for December, making it equal with the month high we had in January 2012.
The average for the year of 2012 was 21% above the pre-Fukushima 4 year average, see the month average chart.
I have incomplete data for December 2011, as the new Gamma Scout Geiger Counter had just arrived. It was a while before I set up data logging on this unit. Didn’t realize how important data logging would be at the time.
As you can see from the data I did record for that month, the average for December 2011 was 26% percent above average. Also you can see in that chart, there were more dynamic swings in background levels, compared to December 2012.
The data is clearly showing increasing background levels of radiation over the last two years, at my location on the central east coast of Australia.
Also, during the month there were significant rain washout detections in Caloundra and Nimbin, plus peak detections in Sydney, and on New Zealand North Island.
http://sccc.org.au/archives/2630
2012/12/14 at 2:58pm
Australia,
Queensland,
Sunshine Coast,
16th, December, 2012
Emotionally it can be a bit of a roller coaster for those of us who are aware of the precariousness of the situation. It is not so easy when people around you have little idea or comprehension, of what all this contamination is going to do to all living things on this planet.
It is also a bit precarious at Fukushima fuel pool 4 after that 7.4 earthquake a few days ago.
http://sccc.org.au/archives/2861
Background Radiation Level Report
The day average for yesterday was 41% above average. The difference now is the southerly wind is not causing the dynamic drops in background it did over the last few months. All the wind was southerly or south easterly yesterday. Both Geiger counter set ups here are showing similar above average levels. The average background for the last 11 days was 41% above average. (See chart) The last time it was anywhere this high was in January 2012 at 43%.
Interestingly, this Twittered chart image of the monthly average radiation levels at Fukushima city,
http://pbs.twimg.com/media/A-EgMPSCEAIeGlR.jpg
mirrors the monthly chart recorded at my location in the Southern Hemisphere. Here it is at a lot lower levels, but the chart curve is very close.
The large detections at the Nimbin monitoring station, confirm lots of extra Radon, and possibly other isotopes in the rain.
Nimbin Monitoring station report 9th December. Just had a small rain shower here and I took a not too thorough swab from a clean sheet of corro, 1700x850mm, proped up on 4 star pickets in the center of a large area of lawn. Initial readings over 4.8uSv/h! Took another swab this morning and tested it w/ LND 7317, and was seeing over 3.0uSv/h (Ra226 calibration) then ~ 2.1uSv/h on the minute counts.
Nimbin Monitoring station report 3rd December. Pretty serious Radon washout here in NE NSW Australia at the moment. Over 2.6uSv/h being measured from small rain samples. And the rain continues…..After 20mins of rain a quick swipe (not thorough) Fast result screen showed 2.6 – 2.8uSv/h.
There has also been this report from a contact in Sydney in the last 24 hours.
“Hi Peter,
My counters are beeping more than usual today. They are going up 0.25uSv/h frequently. How are things there?”
I did a rain swab test here on the morning of 6th December from some light rain over night. Tested it with the new SBT-10 tube and computer based Theremino Geiger counter software set up. It started off at 0.63 uSv/hr, and quickly decayed. The swab was just one sheet of paper towel from the bonnet of the car.
A Scintillator test started on the evening of the 8th and this large spike appeared in test results, (See chart) on the evening of the 8th, but on retest did not show up again. Any ideas?
There is evidence of a very small amount of possibly U-235 in the retest? The background is blue chart line, and the retest is the dark green chart line. A little bit of peak drift can be seen in the test chart from temperature change. This drift is more accentuated at hight keV energies. I am looking at setting the equipment up in a temperature stable room, or large box.
I have no idea what caused that large spike in the first test result. A cosmic blast from outer space picked up by the scintillator? There is mains filtering on the equipment.
Full historical local data can be found here.
http://sccc.org.au/archives/2630
2012/12/01 at 9:25 pm
Biggest background radiation spike I have seen on this North Island of New Zealand private monitoring station. They are using a scintillator for monitoring purposes, so it is normal at this station to have an average around the 750 CPM.
http://zl2tod.net/gaigakaunta/?story=19
Here is a screen shot.
http://sccc.org.au/wp-content/uploads/2012/12/Station-North-island-NZ-021212.jpg
2012/11/30 at 9:18 pm
Australia,
Queensland,
Sunshine Coast,
1st, December, 2012
The day local background average for the 29th of November again hit 40% above average. This was the fifth time in November that the day local background average had gone 40% above average. (See day average chart)
This pushed the November monthly average to 31% above average, compared to the 4 year recorded average. (See monthly average chart)
Full historical local data can be found here.
http://sccc.org.au/archives/2630
This is showing a steady increase in background radiation levels over time, at our location in the Southern Hemisphere.
————————————————-
For those of you interested in trying long term charting of your local background radiation levels, here are some free tools.
http://sccc.org.au/charting-templates
2012/11/17 at 4:53 pm
Here is an alternative rain test swab test result using the new free Theremino MCA software for comparison. Theremino MCA allows the capture of charts as they change over time. The lower chart in the Theremino screen capture is after the first 15 minutes of swab testing, and the higher chart is after 9hrs. The PRA chart in the
post below is also after 9 hours.
http://sccc.org.au/wp-content/uploads/2012/11/Rain-swab-4x-171112-T-9hrs.jpg
2012/11/17 at 3:34 pm
Australia,
Queensland,
Caloundra,
18th, November, 2012
In the last 24 hours, local background levels have risen to 49% above the 4 year average of 0.10 uSv/hr. It is suggested that during these elevated background radiation events, if it rains, you keep children and pets out of the rain, plus re-divert rain tank inflows.
See November day average chart.
To keep up to date on local background radiation levels, regularly look at day chart, at the monitoring site.
http://sccc.org.au/archives/2630
Testing is showing a significant amount of Radon washout during the rain events that coincide with elevated background.
Report from the Nimbin monitoring station in the last 24 hours.
“Took a swab from the windscreen half an hour ago after many showers, and measured more than 650cpm(SBT10) throughout the first 10 mins.”
See rain swab test chart showing significant Radon decay daughter isotopes captured from the edge of a storm, here at Caloundra on the evening of the 17th.
http://sccc.org.au/wp-content/uploads/2012/11/Rain-Swab-4x-17.11.12-PRA-9hrs.jpg
This swab will be further tested to see if any long life isotopes are present.
2012/11/11 at 4:40 pm
Australia,
Queensland,
Sunshine Coast,
12th, November, 2012,
A strong southerly came through around 12 pm on the 10th. The background average here dropped by 31% by the 11th, compared to high of 39% above for the 9th. Again this shows our local background increases with the presents Northern Tropical winds. (See Chart)
For full local details visit,
http://sccc.org.au/archives/2630
———————————————-
New to this forum? Here is a free Geiger Counter Use Guide.
http://technologypals.com.au/wp-content/uploads/2012/03/Using-a-Geiger-Counter-to-test-food-for-Radioactive-Contamination.pdf
2012/11/02 at 10:23 pm
Australia
Queensland,
Sunshine Coast
October monthly report from downunder
The local background radiation average for the month of October was elevated at 19% above the four year recorded average. It was also a very volatile month, with dynamic swings in local background radiation levels. These dynamic swings in background levels were tied to wind direction. Northerly wind direction consistently increased local background levels of radiation.
At the beginning of the year, we had lots of short duration spikes in radiation, that were detected up the eastern sea board of Australia and in New Zealand by independent testers. Now we are seeing broader increases over longer periods of time. Click the link to see the October day average chart, to see this dynamic.
After doing a lot of rain swab scintillator tests, what was detected were increased radioactive Radon gas levels. Here is a link to information on Radon gas.
http://hyperphysics.phy-astr.gsu.edu/hbase/nuclear/radon.html
The local rain washout test chart, link below, shows Radon, the daughter decay chain of Lead, Pb-210 and Pb-214, plus Bismuth Bi-214. Longer period testing showed that all that was left after leaving the test sample for a week, was the long life Radon daughter Pb-210.
http://sccc.org.au/wp-content/uploads/2012/10/Rain-swab-test-2.75-hours-B-240912-71-10.jpg
There are a number of theories that have been put forward for the increasing Radon levels.
Radon Theory One
50 times more Uranium than normal was detected in air over Hawaii on the 21.03.2011.
All this extra Uranium that has been aerosolized into the air from the Fukushima Nuclear Disaster into the Northern Hemisphere atmosphere, is constantly releasing extra Radon gas. This would explain the increase in radioactive Radon gas coming across the equatorial boundary from the Northern hemisphere.
Also, there are constant steam releases from the underground super heated melted Nuclear reactor cores, hitting ground water. This releases a lot of extra Radon that is in the cores and soil at Fukushima. Watch this video from the 30.10.2012 to see a live shot of ground venting at the Fukushima site, from the underground Nuclear reactor cores. This is a common occurrence there.
(Thanks to nuckelchen for this video.)
BEGINNING 2012
« 1 2 3 4 5 6 7 8 9 10 11 12 13 14 15 16 17 18 19 20 21 22 23 24 25 26 27 28 29 30 31 32 33 34 35 36 37 38 39 40 41 42 43 44View All»


Recent Comments