483 streaming radiation detection stations at 142 sites across USA
FUNCTIONING BETA & GAMMA STATIONS
There are 142 EPA RadNet stations across America monitoring gamma and beta radiation levels and gamma exposure rates displayed here. As of June 13, 2024, there are 483 live graphs organized here. Gamma Gross Count Rate and Gamma Gross Count Rate by Channel Range as well as Gamma Exposure Rate and Beta Air Filter Results are graphed continuously courtesy of the U.S. Environmental Protection Agency. EnviroReporter.com organized this vital data for ease of use.
*********************************************
BETA READING STATIONS AVAILABLE IN GRAPH FORM ARCHIVE
June 2, 2017 – 0
August 1, 2016 – 0
June 14, 2016 – 9
May 22, 2016 – 14
May 14, 2016 – 14
May 3, 2016 – 19
April 24, 2016 – 20
April 15, 2016 – 20
April 5, 2016 – 24
March 17, 2016 – 29
September 1, 2015 – 0
August 20, 2015 – 31
August 4, 2015 – 30
July 6, 2015 – 36
June 1, 2015 – 37
May 23, 2015 – 35
May 8, 2015 – 34
April 7, 2015 – 34
March 29, 2015 – 34
March 18, 2015 – 35
March 11, 2015 – 33
February 1, 2015 – 35
January 31, 2015 – 35
January 30, 2015 – 34
January 14, 2015 – 37
December 27, 2014 – 37
December 17, 2014 – 36
December 10, 2014 – 37
December 2, 2014 – 31
November 23, 2014 – 39
October 1, 2014 – 40
September 1, 2014 – 40
August 6, 2014 – 44
July 28, 2014 – 43
July 21, 2014 – 42
July 14, 2014 – 44
July 7, 2014 – 39
June 30, 2014 – 42
June 19, 2014 – 40
June 2, 2014 – 44
May 5, 2014 – 42
April 13, 2014: 46
January 19, 2014 – 42
July 9, 2013 – 60
Readings of 100 CPM or more indicate significant beta radiation activity. Three times background readings could mean a hazardous situation exists and protocols discussed and reported on in EnviroReporter.com since March 11, 2011 should be noted. See that below the tilde symbol (~) before some rad readings means mathematically approximate.
June 1 2015 Nationwide Radiation Report:
BETA GRAPH ANALYSIS
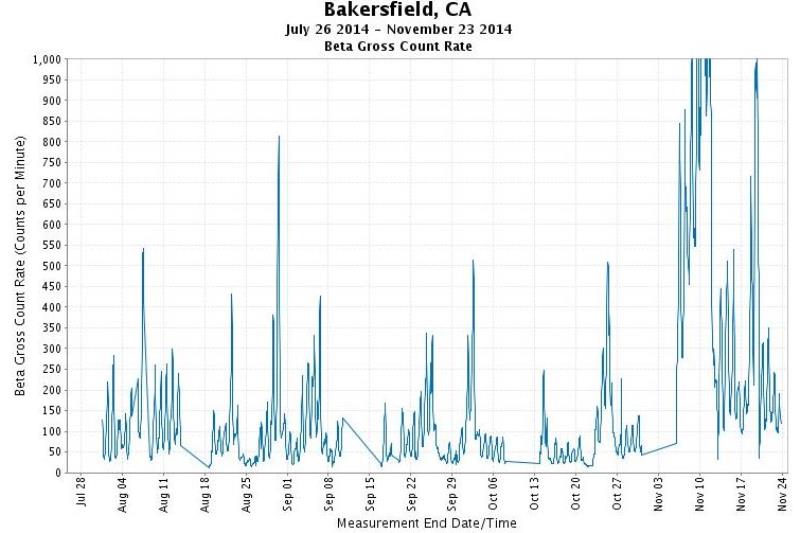
Since our last report April 17, 2015 (below in archives), Montgomery AL soared to a four month high May 10 topping ~365 CPM; Anchorage AK saw its crucial beta monitoring cease March 24 but sputtered to life April 28 and shows June 1 to be a mild ~40 CPM; Fairbanks AK hit 150 CPM May 22; Phoenix AZ May Day was perhaps a good watch-word on May 1 with a ~520 CPM spike; Tuscon AZ hit a four month high May 12 with a sizzling ~435 CPM May 12; Little Rock AR registered ~135 CPM May 5; Fort Smith AR registered 100 CPM June 1; Anaheim CA‘s beta graph shows just ~45 CPM June 1 which is small consolation for their Anaheim Ducks’ historic debacle; Fresno CA smashed through previous highs hitting ~970 CPM November 11 and then the graph died December 2 leaving a huge hole in California airborne beta monitoring – as of June 1 it’s still blank but it’s gamma graph is active; Bakersfield CA hit ~440 CPM May 28; Los Angeles CA‘s beta graph stopped in March 2014 never to return in America’s second largest metropolitan. Our June 1 HEPA filter debris test found hot dust registering positive for alpha radiation which came in alone at 168.4% of background higher which is astonishing; Riverside CA‘s graph gave out September 15, 2014 never to return; San Bernardino County CA smashed through a four month high of ~610 CPM on May 8 which is about twenty times normal; San Diego no longer has a working beta graph because it died January 15 after months of erratic fits and starts but gone for good in a town with a huge Navy base which makes the station’s inoperability careless in the extreme; Hartford CT jumped to a four month high May 30 with ~125 CPM; Washington DC registered just ~35 CPM June 1; still not one beta monitor out of five works in Florida which is amazing and maybe because the gamma’s high activity suggests something really hot in the Sunshine State where citrus has tested positive for Fukushima-originated Cesium-134 since the meltdowns began; Augusta GA no longer has a working beta graph in a very active environment, unfortunately, giving out August 25, 2014 never to return; Ft. Wayne IN had a malfunctioning beta station from February 5 through March 9 but hit a four month high May 24 with a jolting ~340 CPM; Baton Rouge LA was just ~20 CPM June 1; Orono ME is the farthest functioning beta station away from the triple meltdowns at Fukushima Dai-ichi, Japan, and this lovely town has the lowest readings sometimes down into the single digits for days at a time like June 28 with it in the single digits around 9 CPM; Baltimore MD‘s beta and gamma graphs are now ‘on’ and functioning properly with the city hitting 200 CPM May 18, a four month high; Worcester MA blew through ~320 CPM September 28 and has spiked three times in November over 200 CPM and then its beta station died December 9 and then briefly be reborn Christmas Day only to die, for good, the next day and joined Boston in the dead beta graphs group; Grand Rapids MI got up to a four month high May 15 with ~175 CPM; St. Paul MN was blowing through 300-350 CPM regularly before its beta station died October 16, 2014 not to return in this important upper Midwest center until the last two days where it read a scant ~35 CPM June 1; St. Louis tested ~40 CPM June 1; Lincoln NE topped 300 CPM on May Day; Concord NH registered a four month high May 12 with ~195 CPM in an area with normal background around ~25 CPM; Albuquerque NM registered ~260 CPM May 7; Buffalo NY tested at 150 CPM May 30; New York City NY is not functioning as it hasn’t for years but its gamma gross count is sort of jumping around like LA’s gamma is – just one difference, NYC’s gamma is much more active which is one thing New Yorkers can brag about: they’re hotter than Los Angelenos even if their crucial beta station is on the fritz; Syracuse NY showed ~160 CPM November 26 and then the beta graph died December 1 and never came back plus its gamma station is poorly maintained as evidenced by the scant and inaccurate readings, dying once again completely May 5; Charlotte NC‘s graph died January 13 but came alive May 6 hitting ~145 CPM May 19; Raleigh NC hit ~170 CPM July 24, 2014 and cut out and still hasn’t come back on, a real loss in the South; Toledo OH hit a four month high May 8 with ~210 CPM; Corvalis OR was ~105 CPM June 1Pittsburgh PA soared to a four month high May 7 topping ~225 CPM; Puerto Rico‘s beta graph doesn’t work but the gamma remains somewhat active; Amarillo TX is one of the hottest sites in the country was just ~80 CPM last night after topping ~910 CPM April 27; Dallas TX spiked to ~245 CPM May 28; Ft. Worth was just ~40 June 1; Salt Lake City UT‘s beta station is still down since a huge beta increase over 200 CPM in early May 2014 and remains knocked out; and Madison WI hit peaked at a four month high May 25 with a chart-topping 350 CPM.
ARCHIVES
April 7, 2015 Nationwide Radiation Report:
 2015/04/07 at 10:45 am PDST
While EnviroReporter.com‘s Spring investigations up the southern and central California coast, testing Pacific waters at multiple locations, yielded repeated samples reading at background, the April 6, 2015 edition of the Salem Oregon Statesman Journal newspaper reported that Fukushima radiation has reached North American shores much farther north off a dock in Victoria Island in British Columbia, Canada. While this unfortunate development isn’t surprising to any of the readers, viewers and listeners of EnviroReporter.com over the last four years, one quote from a self-proclaimed Fukushima radiation expert quoted in the article rang out loud and clear to us:
“Even if the levels were twice as high, you could still swim in the ocean for six hours every day for a year and receive a dose more than a thousand times less than a single dental X-ray,” said Woods Hole chemical oceanographer Ken Buesseler. “While that’s not zero, that’s a very low risk.”
Buesseler’s claim is patently false. The cesium-134 and cesium-137 in the Pacific water is not dangerous from its gamma radiation like the immense gamma blasts of “a single dental X-ray” because these beta-emitters can be swallowed when swimming in the ocean or ingested from marine life exposed to the radioactive ‘goo.’ Comparing swimming in an ocean with Fuku goo to a dental X-ray is ludicrous but easily slipped past most readers.
This reckless claim was made out of ignorance or something worse but to have this person repeatedly quoted in mainstream media saying this kind of misleading nonsense gives the reader, and especially the users of the Pacific, the less than true notion that everything is A-Okay. Unfortunately, reporters in this country are usually so inept at radiation science that Fuku hooey blown their way goes by unchallenged.
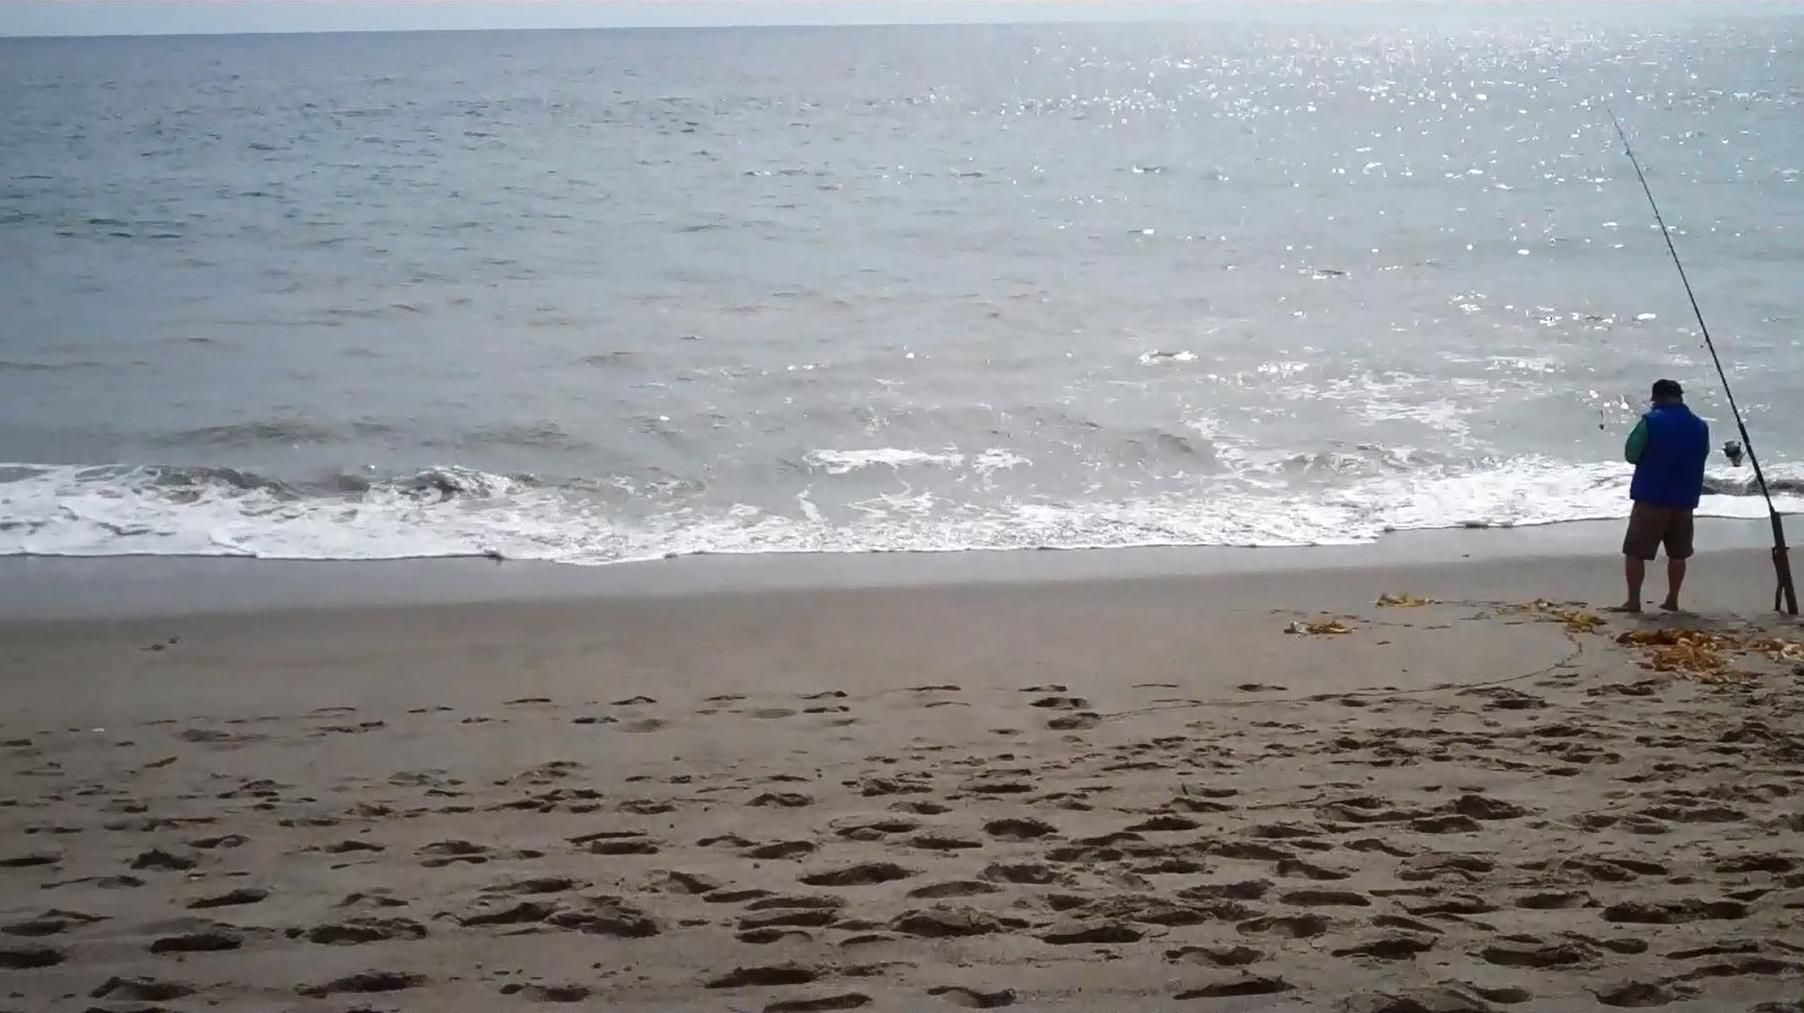
EnviroReporter.com actually knows its radiation so when we say there is no goo in the water we tested along the central and southern California coast – so far – you can trust it. We reported our results March 24 (which are followed here by our April 7 Nationwide Radiation Report).
March 24, 2015
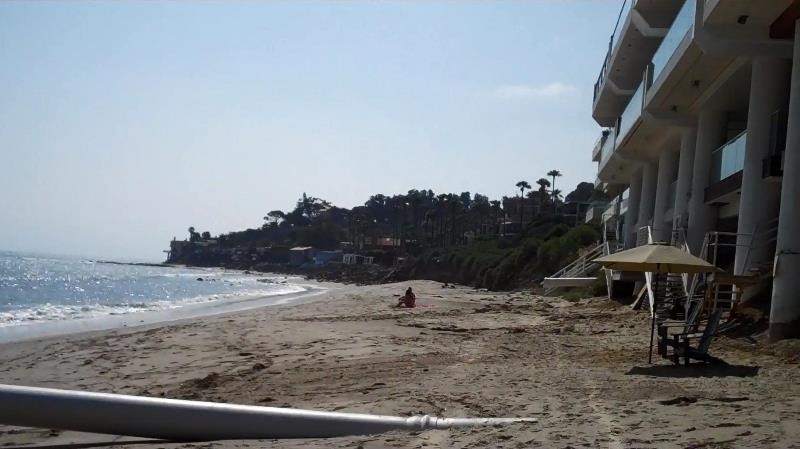
Below are five different Pacific Ocean measurements that were taken between March 6 and March 21, 2015. From north to south, Carmel River State Beach to Topanga State Beach, is a distance of over 300 miles. Three samples from Topanga State Beach, Latigo Canyon beach and Sycamore Canyon Beach were tested wet from sampling towels dipped into the Pacific and then allowed to naturally dry over three days and retested. All six tests for these three sites came in at or below background. It is important to note that natural radiation in Pacific Ocean samples we tested did not register above background. This is crucial information as it will impact discussion of future Pacific Ocean tests at these sites that come in significantly over background. In other words, any future overages will not be able to be dismissed as the water’s “natural” radioactive content.
 March 24, 2015
5:35 pm INT RSSM *DRY TOWEL* PACIFIC OCEAN SAMPLE drawn at Sycamore Canyon Beach at at 3:10 pm March 21: 43.8 CPM^^ (background)
5:20 pm INT RSSM *DRY TOWEL* PACIFIC OCEAN SAMPLE drawn at beach at bottom of Latigo Canyon at 2:30 pm March 21: 39.1 CPM^^ (background)
5:05 pm INT RSSM *DRY TOWEL* PACIFIC OCEAN SAMPLE drawn at Topanga State Beach at 2:00 pm March 21: 37.2 CPM^^ (background)
4:50 pm INT RADIATION STATION SANTA MONICA BACKGROUND (BG): 39.6 CPM^^
March 21, 2015
10:05 pm INT RSSM *WET* PACIFIC OCEAN SAMPLE drawn at Sycamore Canyon Beach at at 3:10 pm earlier in day: 43.2 CPM^^ (background)
9:50 pm INT RSSM *WET* PACIFIC OCEAN SAMPLE drawn at beach at bottom of Latigo Canyon at 2:30 pm earlier in day: 39.7 CPM^^ (background)
9:35 pm INT RSSM *WET* PACIFIC OCEAN SAMPLE drawn at Topanga State Beach at 2:00 pm earlier in day: 42.3 CPM^^ (background)
9:20 pm INT RADIATION STATION SANTA MONICA BACKGROUND (BG): 38.9 CPM^^

 March 8, 2015
2:25 pm EXT Carmel River State Beach Pacific Ocean water: 55.3 CPM^
2:10 pm EXT Carmel River State Beach background: 64.7 CPM^^

March 6, 2015
4:20 pm EXT Spooner’s Cove at Montana Del Oro California State Park PACIFIC OCEAN WATER: Background
Readings across the United States were not as encouraging as the results of EnviroReporter.com‘s Spring investigation up the California coast. It is important to remember the following when reviewing our April 7, 2015 report following:
Readings of 100 CPM or more indicate significant beta radiation activity. Three times background readings could mean a hazardous situation exists and protocols discussed and reported on in EnviroReporter.com since March 11, 2011 should be noted. See that below the tilde symbol (~) before some rad readings means mathematically approximate.
April 7, 2015 Nationwide Radiation Report (continued):
Since February 2, 2015 (below in archives), Montgomery AL hit ~205 CPM April 1 but has eased to 55 CPM by April 7; Anchorage AK saw its crucial beta monitoring cease March 24; Fairbanks AK hit ~240 CPM February 15; Phoenix AZ hit a four-month high March 1 with a solid 750 CPM; Tuscon AZ, which nearly topped 380 CPM February 19; Little Rock AR registered ~155 CPM March 16; Fort Smith AR went nuts, beta-wise, and nearly hit 400 CPM twice in the last week; Anaheim CA‘s beta graph shows just ~25 CPM April 7; Fresno CA smashed through previous highs hitting ~970 CPM November 11 and then the graph died December 2 leaving a huge hole in California airborne beta monitoring; Bakersfield CA has gone off the charts – in excess of 1,000 CPM – March 15 but the April 7 reading is a low 100 CPM in comparison; Los Angeles CA‘s beta graph stopped in March 2014 never to return in America’s second largest metropolitan. On the 4-year anniversary of the ongoing triple meltdowns in Fukushima Japan, March 11, RSSMC triple HEPA filter debris test found hot dust coming in at 3.9 times background; Riverside CA‘s graph gave out September 15, 2014; San Bernardino County CA almost hit a four month high of ~340 CPM on April Fools Day which is no joke to anyone breathing that concentration compared to normal levels; San Diego no longer has a working beta graph because it died January 15 after months of erratic fits and starts; Hartford CT was an enviable ~60 CPM April 7; Washington DC registered ~135 CPM February 15-16; still not one beta monitor out of five works in Florida which is amazing; Augusta GA no longer has a working beta graph in a very active environment, unfortunately, giving out August 25, 2014 never to return; Ft. Wayne IN had a malfunctioning beta station from February 5 through March 9 so the latest period’s high is ~155 CPM April 4; Baton Rouge LA was just ~20 CPM April 7; Orono ME is the farthest functioning beta station away from the triple meltdowns at Fukushima Dai-ichi, Japan, and this lovely town has the lowest readings sometimes down into the single digits for days at a time like today with it in the single digits around 9 CPM; Baltimore MD‘s beta and gamma graphs are now ‘on’ and functioning properly with the city hitting~160 CPM on the beta scale which is nothing to be raven about; Worcester MA blew through ~320 CPM September 28 and has spiked three times in November over 200 CPM and then its beta station died December 9 and then briefly be reborn Christmas Day only to die, for good, the next day; Grand Rapids MI got up to ~165 CPM April 1; St. Paul MN was blowing through 300-350 CPM regularly before its beta station died October 16, 2014 not to return in this important upper Midwest center; viroreporter.com/radnet-air-monitoring-data/-data//missouri/#st.louis”>St. Louis tested ~45 CPM April 7; Lincoln NE flirted with ~375 CPM March 21; Concord NH hit ~130 CPM March 8; Albuquerque NM registered ~460 CPM February 24; Buffalo NY tested at ~110 CPM March 26 settling down a bit from the last report period; New York City NY is not functioning as it hasn’t for years but its gamma gross count is sort of jumping around like LA’s gamma is – just one difference, NYC’s gamma is much more active which is one thing New Yorkers can brag about: they’re hotter than Los Angelenos even if the crucial beta station is kaput; Syracuse NY showed ~160 CPM November 26 and then the beta graph died December 1 and never came back plus its gamma station is poorly maintained as evidenced by the scant and inaccurate readings; Charlotte NC topped 220 CPM Christmas Eve bringing with it the gift of a four month high though the graph died January 13 so who knows now; Raleigh NC hit ~170 CPM July 24 and cut out and still hasn’t come back on, a real loss in the South; holy Toledo OH was ~135 CPM March 14; Corvalis OR was ~135 CPM March 15 trending lowerPittsburgh PA was ~160 CPM April 7; Puerto Rico‘s beta graph doesn’t work but the gamma has picked up in the last few weeks; Amarillo TX hit 1,000 CPM several times in the last few months and is one of the hottest sites in the country for reasons not fully understood though we are getting close to some astonishing new answers that will be published soon though we can happily report that the Texas Panhandle hub was just ~30 CPM last night; Dallas TX reached over 305 CPM on the Ides of March, March 15; Ft. Worth hit ~265 CPM February 15; Salt Lake City UT‘s beta station is still down since a huge beta increase over 200 CPM in early May 2014 and remains offline; and Madison WI hit ~170 CPM April 7, 2015 which is considerable but nothing like the highs of the last period for this Midwest center.
ARCHIVED RADIATION REPORTS
2015/02/02 at 12:01 am

The system that brought hot rain to Southern California January 30, covered in High radiation detected in L.A. rain, chugged east through the American southwest and southeastward over Mexico.
Dale Ramicone of Radiation Station Glendale California had virtually the same amount of beta-emitting radiation in his rain sample, 3.2 times background coming in at 121.2 Counts Per Minute (CPM) that we did at Radiation Station Santa Monica California. Our results were 3.3 times background at 131.7 CPM.
We noticed several interesting phenomena with the storm’s advance over Arizona. During the rains, beta radiation levels in Phoenix and Tuscon actually went down. This may be due to the fact that the storm system could have washed out the high airborne radiation while it was raining. The EPA RadNet stations are air sensors, after all, and seemed to pick up less beta during the precipitation.
The object of our attention is beta radiation. Once again, several significant beta stations have gone offline while a couple of crucial ones are sputtering to life.
Readings of 100 CPM or more indicate significant beta radiation activity. Three times background readings could mean a hazardous situation exists and protocols discussed and reported on in EnviroReporter.com since March 11, 2011 should be noted. See that below the tilde symbol (~) before some rad readings means mathematically approximate.
Since November 23, 2014 (below in archives), Montgomery AL hit ~170 CPM December 16 but has settled down around 50 CPM in the last few days; Anchorage AK also hit a four month high reaching ~165 CPM December 13 which is the first time it has reached that dubious milestone since EnviroReporter.com began tracking its beta radiation totals in this increasingly active area; Fairbanks AK also hit a four-month high inching past the previous ~245 CPM October 31, topping ~255 CPM Christmas Day 2014; Phoenix AZ in the Grand Canyon State is getting hammered with beta rads and hit a four-month high November 27 with ~735 CPM; Tuscon AZ, which nearly topped 450 CPM October 31 also hit the beta jackpot November 27 with a solid 700 CPM in an area where folks move to breath the clean and dry desert air; Little Rock AR has been settling down and hovered just under 100 CPM February 1; Fort Smith AR hit 250 CPM December 1; Anaheim CA‘s beta graph started working August 7 then went dead completely August 15, and now has been back since November 25 showing three 300 CPM days in this latest period; Fresno CA smashed through previous highs hitting ~970 CPM November 11 and then the graph died December 2 leaving a huge hole in California airborne beta monitoring; Bakersfield CA has gone off the charts – in excess of 1,000 CPM – half a dozen times in early to mid-November, and then blazed though 1,000 CPM again in this latest period seven times; Los Angeles CA‘s beta graph stopped in March 2014 but the gamma seemed quite jumpy in late December through mid-January 2015. A January 10 RSSMC triple HEPA filter debris test found hot dust coming in at 10.1 times background; Riverside CA‘s graph gave out September 15 after repeatedly slamming through the ‘Oh NO!’ threshold of 250 CPM and has stayed out leaving Southern California in the dark about a basic need-to-know environmental concern; San Bernardino County CA hit a four month high of ~345 CPM January 21; San Diego no longer has a working beta graph because it died January 15 after months of erratic fits and starts; Hartford CT is back to humming along at low numbers with ~22 CPM February 1; Washington DC was just ~35 CPM yesterday but hit 150 CPM twice December 17 and 26; still not one beta monitor out of five works in Florida which is why EnviroReporter.com editor Denise Anne Duffield and I don’t buy Sunshine State citrus; Augusta GA no longer has a working beta graph in a very active environment, unfortunately, giving out August 25, 2014 never to return; Ft. Wayne IN has exceeded 200 CPM twice for this reporting period which is actually an improvement; Baton Rouge LA‘s four-month high was hit November 10-11 with ~290 CPM but it has settled down registering ~35 CPM February 1; Orono ME is the farthest functioning beta station away from the triple meltdowns at Fukushima Dai-ichi, Japan, and this lovely town has the lowest readings sometimes down into the single digits for days at a time; Baltimore MD‘s beta and gamma graphs are now ‘on’ and functioning properly which is great news and shows that the New Year is getting busy with four days over 100 CPM; Worcester MA blew through ~320 CPM September 28 and has spiked three times in November over 200 CPM and then its beta station died December 9 and then briefly be reborn Christmas Day only to die, for good, the next day; Grand Rapids MI got up to ~315 CPM December 1; St. Paul MN was blowing through 300-350 CPM regularly before its beta station died October 16 not to return in a place where beta has soared since the triple meltdowns began according EnviroReporter.com’s extensive archive of beta readings for this important upper Midwest center; St. Louis tested ~310 CPM December 16, a four month high; Lincoln NE hit a four-month high January 3 soaring to ~460 CPM; Concord NH hit ~195 CPM December 17; Albuquerque NM also hit a four-month high December 17 with a whopping ~860 CPM; Buffalo NY tested at ~210 CPM November 18 and jumped around going over 100 CPM half a dozen times in the latest period; New York City NY is not functioning as it hasn’t for years but its gamma gross count is sort of jumping around like LA’s gamma is – just one difference, NYC’s gamma is much more active which is one thing New Yorkers can brag about: they’re hotter than Los Angelenos; Syracuse NY showed ~160 CPM November 26 and then the beta graph died December 1; Charlotte NC topped 220 CPM Christmas Eve bringing with it the gift of a four month high though the graph died January 13 so who knows now; Raleigh NC hit ~170 CPM July 24 and cut out and still hasn’t come back on, a real loss in the South but we do have Radiation Station Harrisburg North Carolina for occasional rain radiation tests including one November 17 which showed hot rain radiating at 9.9 times background; holy Toledo OH was ~210 CPM December 17; Corvalis OR is trending higher in 2015 with ~205 CPM January 9Pittsburgh PA was ~215 CPM December 16; Puerto Rico‘s beta graph doesn’t work but the gamma remains low and steady; Amarillo TX hit 1,000 CPM January 7 and 15 at one of the hottest sites in the country for reasons not fully understood; Dallas TX goes Texas-big topping 350 CPM twice in the period before the monitor mysteriously began registering in the single digits January 20 until now; Ft. Worth hit a four month high with 360 CPM January 20; Salt Lake City UT‘s beta station is still down since a huge beta increase over 200 CPM in early May 2014 and remains offline in a state that could use the now-available Mitt Romney’s guiding hand to get that beta station up and atom; and Madison WI hit a four-month high November 25 charting ~460 CPM and was only ~40 CPM February 1.
2014/11/23 at 5:40 pm
Only 39 out of 124 USEPA beta monitors are functional as of this date. That is success rate of just 31.5 percent for America’s front line defense against airborne beta radiation like cesium-134 & 137, strontium-90 and plutonium-239. The failure of this taxpayer-funded program to maintain anything near a success rate approaching acceptable is extraordinary. Nevertheless, these radiation stations are invaluable, producing the best data in the United States.
Manmade beta emitters, the kind of radiation pouring out of the ongoing triple meltdowns at Fukushima Dai-ichi, Japan, are the most dangerous to the health and genetic integrity of flora and fauna in both sea and on land. That includes humans. That’s what these stations are monitoring for, stations that by in large have operating gamma radiation sensors which are far less effective in detecting the kind of radiation we’re looking for.
Again, several significant beta stations have gone offline while a couple of crucial ones are sputtering to life. There have been a number of startling developments since our last report, some of which have been also detected by the Nuclear Emergency Tracing Centre and reported by Peter Dailey who also runs Radiation Food Lab and Radiation Station Sunshine Coast Australia.
Readings of 100 CPM or more indicate significant beta radiation activity. Three times background readings could mean a hazardous situation exists and protocols discussed and reported on in EnviroReporter.com since March 11, 2011 should be noted. See that below the tilde symbol (~) before some rad readings means mathematically approximate.
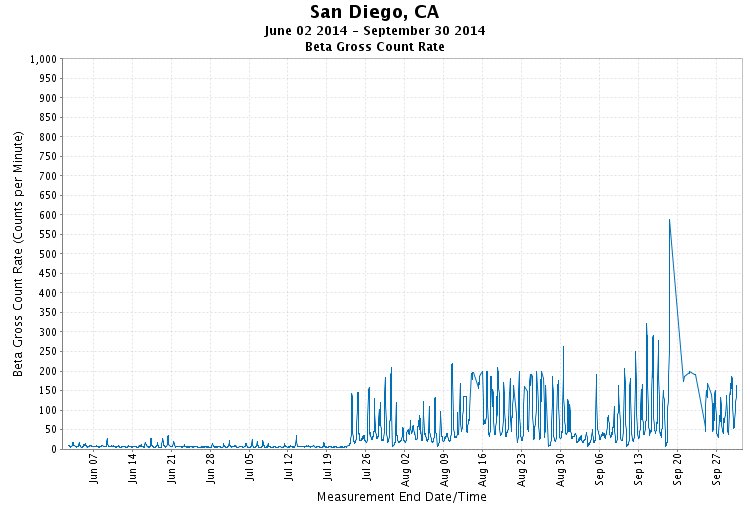
Since October 1, 2014 (below in archives), Montgomery AL hit a four-month high reaching 400 CPM October 17; Anchorage AK also hit a four month high reaching 100 CPM November 1 which is the first time it has reached that dubious milestone since EnviroReporter.com began tracking its beta radiation totals; Fairbanks AK hit a four-month high smashing through the previous ~190 CPM September 28, topping ~245 CPM October 31; Phoenix AZ blew through its previous ~210 CPM four-month high hitting over 650 CPM November 23 in a state where most voters probably would support funding these radiation stations that bring the harsh, and hot, reality home that the Grand Canyon State is getting hammered with beta rads; Tuscon AZ nearly topped 450 CPM October 31 which was over 25% higher than its last period high; Little Rock AR rocketed to 450 CPM October 27 exceeding past records; Fort Smith AR calmed down a bit to ‘just’ 300 CPM October 27; Anaheim CA‘s beta graph started working August 7 then went dead completely August 15; Fresno CA smashed through previous highs hitting ~970 CPM November 11; Bakersfield CA has gone off the charts – in excess of 1,000 CPM – half a dozen times in early to mid-November; Los Angeles CA‘s beta graph stopped in March but the gamma seemed quite jumpy in November so EnviroReporter.com relied on its HEPA filters dust sampling and detection and found that autumn dust in Los Angeles was eight times higher in beta radiation than late summer dust; Riverside CA‘s graph gave out September 15 after repeatedly slamming through the ‘Oh NO!’ threshold of 250 CPM and has stayed out; San Bernardino County CA hit a four month high October 18 pegging ~335 CPM; San Diego remains extremely active hitting ~580 CPM September 20 and then hit 650 CPM October 1 as this once ‘cool’ city has turned beta ‘hot’ though the last week has settled down a bit to around 150 CPM; Hartford CT is trending upward tying a four-month high September 28 of ~215 CPM which is over ten times its normal background but was about ~60 CPM yesterday; Washington DC was just ~35 CPM yesterday; still not one beta monitor out of five works in Florida; Augusta GA no longer has a working beta graph in a very active environment, unfortunately, giving out August 25 never to return, yet; Ft. Wayne IN has dropped a bit with a ~280 CPM high November 13 for this reporting period; Baton Rouge LA‘s four-month high was hit November 10-11 with ~290 CPM; Orono ME hit a whopping 55 CPM October 6 which is high for this usually down in the teens community; Baltimore MD‘s beta and gamma graphs are now ‘on’ and functioning properly which is great news and promptly soared to ~210 CPM October 1, went offline for two weeks and now is back registering just 55 CPM yesterday; Worcester MA blew through ~320 CPM September 28 and has spiked three times in November over 200 CPM; Grand Rapids MI got up to ~260 CPM November 5; St. Paul MN was blowing through 300-350 CPM regularly before its beta station died October 16 not to return so far; St. Louis tested ~235 CPM October 14; Lincoln NE hit a four-month high August 3 with ~360 CPM and then its graph died but came back October 23 with 350 CPM being exceeded November 23; Concord NH hit ~245 CPM October 7 then the graph literally flatlined until November 14 but at nicely lower readings around 130 CPM; Albuquerque NM also hit a four-month high October 19 with a sizzling ~540 CPM; Buffalo NY tested at ~210 CPM November 18 before the massive snowstorm dropped seven feet on the city; New York City NY is not functioning as it hasn’t for years but its gamma gross count is sort of jumping around like LA’s gamma is – just one difference, NYC’s gamma is much more active all through the summer into the fall; Syracuse NY showed ~240 CPM November 6; Charlotte NC topped 200 CPM November 13; Raleigh NC hit ~170 CPM July 24 and cut out and still hasn’t come back on, a real loss in the South but we do have Radiation Station Harrisburg North Carolina for occasional rain radiation tests including one November 17 which showed hot rain radiating at 9.9 times background; holy Toledo OH has calmed down somewhat and was 50 CPM today; Corvalis OR hit 375 CPM October 9 and over 200 yesterday before plunging to ~20 CPM today; Pittsburgh PA was ~165 CPM today; Puerto Rico‘s beta graph doesn’t work but the gamma remains low and steady; Amarillo TX hit 1,000 CPM October 20-21 then died November 1 which is truly a shame since it has been the most inexplicably active beta graph in the nation, certainly a dubious honor; Dallas TX goes Texas-big topping 400 CPM October 15, a four-month high; Ft. Worth nearly hit 250 CPM November 20; Salt Lake City UT‘s beta station is still down since a huge beta increase over 200 CPM in early May and remains offline in a state that prides itself on efficiency; and Madison WI hit a four-month high September 30 charting an astounding ~555 CPM and was ‘just’ 300 CPM last night.
2014/10/01 at 1:00 am
40 out of 124 beta monitors are functional as of this date out of the 124 areas covered, the same number as last month but with a changing line-up: station stoppage combined with station start-up. Several significant beta stations have gone offline while a couple of crucial ones are sputtering to life. Many stations are measuring very high beta readings with four-month highs in what turned out to be a very “hot” period.
Readings of 100 CPM or more indicate significant beta radiation activity. Three times background readings could mean a hazardous situation exists and protocols discussed and reported on in EnviroReporter.com since March 11, 2011 should be noted. See that below the tilde symbol (~) before some rad readings means mathematically approximate.
Since September 1, 2014 (below in archives), Montgomery AL topped 250 CPM twice before calming down in the last week; Anchorage AK‘s beta graph is getting more active going over 50 CPM in the last week but the last two days have eased off; Fairbanks AK hit a four-month high with ~190 CPM September 28, part of a continuing uptick in beta activity at the station; Phoenix AZ tied a three-month high ~August 25 with ~210 CPM hitting the same peak September 26 right during the rains – perhaps mist impacted these very high numbers; Tuscon AZ nearly hit 345 CPM Sept. 27 remaining quite active; Little Rock AR had two strong pulses, one hitting ~350 CPM Sept. 19 with the whole period hovering around 200 CPM in a place used to 20 CPM – an increase of ten times; Fort Smith AR suddenly went even nuttier ~August 22 after having been calmer in the second week of Sept. 30 hitting 450 CPM, the highest we have recorded in a long long time in an area used to readings in the teens; Anaheim CA‘s beta graph started working August 7 then went dead completely August 15 – your tax dollars at work because a private company is supposed to keep RadNet running and clearly isn’t; Fresno CA charted ~270 CPM Sept. 12 in a town with very active beta; Bakersfield CA went berserk right after we put the last report to bed and soared to ~820 CPM and then kept jumping around but tonight is about 90 CPM; Los Angeles CA‘s beta graph stopped in March but the gamma seemed quite jumpy in September; Riverside CA‘s graph gave out September 15 after repeatedly slamming through the ‘Oh NO!’ threshold of 250 CPM; San Bernardino County CA smashed through to a four-month high August 30 and went over 250 CPM three times in this latest period; San Diego remains extremely active hitting ~580 CPM September 20 which is over FIFTY times background for the city – look at the graph and see yourself: the background is on the left hand side of the graph and the radically-higher readings on the right; Hartford CT is trending upward tying a four-month high September 28 of ~215 CPM which is over ten times its normal background; Washington DC was not too bad with it hitting ~140 CPM yesterday; not one beta monitor out of five works in Florida even after us reporting it for months – Floridians are breathing beta blind; Augusta GA no longer has a working beta graph in a very active environment, unfortunately, giving out August 25 never to return, yet; Ft. Wayne IN continues a radical trend upward hitting a one-month high Sept. 24 of ~365 CPM which is over ten times background; Baton Rouge LA‘s four-month high was hit Sept. 14 with ~225 CPM; Orono ME looks nice and cool but is marginally more active with ~30 CPM August 30 but hit 50 CPM yesterday; Baltimore MD‘s beta and gamma graphs are now ‘on’ and functioning properly which is great news and promptly soared to ~210 CPM yesterday; Worcester MA blew through ~320 CPM September 28; Grand Rapids MI hit ~295 CPM September 30; St. Paul MN went up to ~360 CPM three times in the last few days but dropped off today; St. Louis is really moving up hitting ~335 CPM September 30; Lincoln NE hit a four-month high August 3 with ~360 CPM and then its graph died and hasn’t come back, a real loss since this station is in the middle of the country and the folks there are getting significant readings of beta radiation which is oft-times man-made; Concord NH hit ~275 CPM Sept. 18, a four-month high; Albuquerque NM also hit a four-month high Sept. 19 with a sizzling ~345 CPM; Buffalo NY is increasing active hitting ~305 CPM Sept. 29 – a four-month high – when its normal background is about 20-25 CPM; New York City NY is not functioning as it hasn’t for years but its gamma gross count is sort of jumping around like LA’s gamma is – just one difference, NYC’s gamma is much more active; Syracuse NY‘s beta graph hit a new record for the year – ~240 CPM today; Charlotte NC hit a four-month high Sept. 18 with ~215 CPM; Raleigh NC hit ~170 CPM July 24 and cut out and still hasn’t come back on, a real loss in the South but we do have Radiation Station Harrisburg North Carolina for occasional rain radiation tests; holy Toledo OH is dropping and was ‘just’ ~140 CPM today; Corvalis OR hit a four-month high Sept. 15 smashing past 450 CPM in a place that has a background of under 20 CPM; Pittsburgh PA is going up in active ionizing and has remained active hitting 300 CPM yesterday; Puerto Rico‘s beta graph doesn’t work but the gamma remains low and steady; Amarillo TX went literally off the chart August 3 blasting through 1,000 CPM and is the most active beta station in the country that functions topping 890 CPM September 25/26; Dallas TX was exactly 400 CPM Sept. 21, a four-month high CPM; Ft. Worth, is trending active hitting 350 CPM, the highest in memory; Salt Lake City UT‘s beta station is still down since a huge beta increase over 200 CPM in early May and it’s gamma bears watching as it has pulses of spikes; and Madison WI hit a four-month high September 30 charting an astounding ~555 CPM.
2014/09/01 at 4:00 pm
40 out of 124 beta monitors are functional as of this date out of the 124 areas covered, a drop of 10 percent. Several significant beta stations have gone offline while a couple of crucial ones are sputtering to life. There is a noticeable sharp beta radiation trend upwards at a number of stations across the country but not as bad as the last reporting period. The following three-week summation allows for a larger data set to apprise than the last weekly report.Readings of 100 CPM or more indicate significant beta radiation activity. Three times background readings could mean a hazardous situation exists and protocols discussed and reported on in EnviroReporter.com since March 11, 2011 should be noted. See that below the tilde symbol (~) before some rad readings means mathematically approximate.
Since August 6 (below in archives), Montgomery AL hit its highest reading since May 26 with a ~270 CPM August 15; Anchorage AK‘s beta graph is still at under 20 CPM all three weeks but burped up into the 40 CPM area twice around August 20-25; Fairbanks AK hit a four-month high with ~150 CPM August 14, part of a continuing uptick in beta activity at the station; Phoenix AZ hit a three-month high ~August 25 with ~210 CPM; Tuscon AZ was over ~350 CPM August 28 remaining quite active; Little Rock AR hit over 380 CPM August 10 trending more active in pulses in an area used to ~20 CPM background; Fort Smith AR suddenly went nuts ~August 22 after having been calmer in the second week of August hitting ~265 CPM~August 24; Anaheim CA‘s beta graph started working August 7 then went dead completely August 15; Fresno CA charted ~270 CPM August 27; Bakersfield CA still coming back online with both beta and gamma in a most welcome development with the beta hitting ~545 CPM August 7; Los Angeles CA‘s beta graph stopped in March but the gamma remains normal and EnviroReporter.com‘s regular test of sea water at Manhattan Beach and Playa Del Rey in Southern California came back normal with no signs of the Sea of Fuku Goo having arrived yet; Riverside CA hit 300 CPM twice in the last period August 12 and August 30; San Bernardino County CA smashed through to a four-month high August 30; San Diego remains extremely active hitting ~200 CPM several times in the last three weeks which is a dozen times background for the city; Hartford CT is trending upward hitting a four-month high August 12 of ~215 CPM which is over ten times its normal background; Washington DC also notched a two-week high August 27 with ~145 CPM; not one beta monitor out of five works in Florida even after us reporting it three weeks in a row – Floridians are breathing beta blind; Augusta GA no longer has a working beta graph in a very active environment, unfortunately; Ft. Wayne IN continues a radical trend upward hitting a four-month high August 24 of 405 CPM which is over ten times background; Baton Rouge LA‘s four-month high was hit August 25 with ~145 CPM; Orono ME looks nice and cool but is marginally more active with ~30 CPM August 30; Baltimore MD‘s beta and gamma graphs are now ‘on’ and functioning properly which is great news; Worcester MA blew through ~235 CPM August 10; Grand Rapids MI hit ~260 CPM August 25; St. Paul MN went up to ~400 CPM August 20, a four-month high by far; St. Louis is trending active hitting ~230 CPM August 25; Lincoln NE hit a four-month high August 3 with ~360 CPM and then its graph died and hasn’t come back, a real loss since this station is in the middle of the country; Concord NH hit ~195 CPM August 27; Albuquerque NM spiked to ~350 CPM several times in the last three weeks with greatly heightened activity and frequency; Buffalo NY is increasing active hitting ~208 CPM August 21 when its normal background is about 20-25 CPM; New York City NY is not functioning as it hasn’t for years but its gamma gross count is sort of settling down; Syracuse NY‘s beta graph went out before hitting ~135 CPM July 27 but came back on going down to ~65 CPM the night of August 3 before stopping then coming on again only to totally die August 24; Charlotte NC hit a four-month high August 29 with ~180 CPM; Raleigh NC hit ~170 CPM July 24 and cut out and still hasn’t come back on, a real loss in the South; holy Toledo OH is going through the roof right at the same time as their drinking water crisis eases with the beta peaking at ~370 CPM August 5, a four-month high and stayed active while dropping off a bit; Corvalis OR hit ~200 CPM August 26 in a place that has a background of under 20 CPM; Pittsburgh PA‘s beta graph hit ~205 CPM August 5 in active ionizing and has remained active; Puerto Rico‘s beta graph doesn’t work but the gamma remains low and steady which makes it even cooler even with the one-day major hiccup August 25; Amarillo TX went literally off the chart August 3 blasting through 1,000 CPM and is the most active beta station in the country that functions; Dallas TX was ~300 CPM August 28; Ft. Worth, is trending active hitting ~150 CPM August 25; Salt Lake City UT‘s beta station is still down since a huge beta increase over 200 CPM in early May and it’s gamma bears watching as it has pulses of spikes; and Madison WI hit a four-month high August 22 charting an astounding 500 CPM.
2014/08/06 at 1:00 am
44 out of 124 beta monitors are functional as of this date out of the 124 areas covered. There is a noticeable sharp beta radiation trend upwards at a number of stations across the country. Such a wide distribution of rising beta detections suggests a major source ‘upwind’ of the nation. The ongoing triple meltdowns at Fukushima Dai-ichi are such a major source.
Readings of 100 CPM or more indicate significant beta radiation activity. Note that below, the tilde symbol (~) before some rad readings means mathematically approximate.
Since July 28 (below in archives), Montgomery AL hit its highest reading since May 26 with a robust ~250 CPM August 4; Anchorage AK‘s beta graph is still at under 20 CPM all week which is terrific but its beta graph seems to have stalled on ~August 2; Fairbanks AK hit a four-month high with ~137 CPM August 4 which is a strong uptick for the station; Phoenix AZ was a mere ~115 CPM August 4; Tuscon AZ was over ~310 CPM August 4 remaining quite active; Little Rock AR hit over 200 CPM in the last week trending upward in an area used to ~20 CPM background – now ten times background readings; Fort Smith AR has been settling down hitting ~52 CPM August ~35 CPM August 5; Anaheim CA was nice and cool at ~45 CPM July 28 or so it seemed – actually the station has been flatlining since July 23 with it blanking out entirely August 1 through now; Fresno CA soared to ~540 CPM August 1 and looks to be trending aggressively upward with Bakersfield CA still coming back online with both beta and gamma in a most welcome development with the beta hitting ~170 CPM August 5; Los Angeles CA‘s beta graph stopped in March but the gamma remains normal and EnviroReporter.com‘s regular test for beta radiation in HEPA filter/ionizer dust showed lower ionization August 5; Riverside CA was way over 150 CPM every day in the last week with increasing activity; San Bernardino County CA was ~100 CPM August 5; San Diego remains very active but off its highs of 220 CPM ~August 1 which is a dozen times background for the city; Hartford CT is trending upward hitting a four-month high August 5 of 130 CPM which is over six times its normal background; Washington DC also notched a four-month high August 5 with ~160 CPM; not one beta monitor out of five works in Florida even after us reporting it three weeks in a row – Floridians are breathing beta blind; Augusta GA was over ~160 CPM twice in the last week; Ft. Wayne IN continues a radical trend upward hitting a four-month high August 4 of 450 CPM which is over a dozen times background; Baton Rouge LA‘s graph is thankfully A-okay with a high of ~140 CPM in the last week; Orono ME looks nice and cool but is marginally more active with ~30 CPM August 5; Baltimore MD‘s beta and gamma graphs are now ‘on’ but not functioning properly; Worcester MA blew through ~235 CPM July 28 and hit ~152 CPM August 4; Grand Rapids MI dropped then went higher hitting ~345 CPM July 28 but was ‘just’ ~200 CPM August 5; St. Paul MN went up to ~300 CPM in the last week; St. Louis is trending active hitting ~175 CPM August 4; Lincoln NE hit a four-month high August 3 with ~360 CPM; Concord NH hit ~220 CPM August 5 nearly tying a four-month high; Albuquerque NM spiked to ~325 CPM July 26 then its graph seems to have stopped the night of August 3 which is not good since this site is one of the closest in the nation to the troubled WIPP facility in same; Buffalo NY is increasing active hitting ~170 CPM August 5 when its normal background is about 20-25 CPM; New York City NY is not functioning as it hasn’t for years but its gamma gross count is sort of settling down; Syracuse NY‘s beta graph went out before hitting ~135 CPM July 27 but came back on going down to ~65 CPM the night of August 3 before stopping as of the time of this report; Charlotte NC is picking up repeatedly hitting over 100 CPM and was ~130 CPM July 27 at its height but has eased to just ~35 CPM the evening of August 5; Raleigh NC hit ~170 CPM July 24 and cut out and still hasn’t come back on; holy Toledo OH is going through the roof right at the same time as their drinking water crisis eases with the beta peaking at ~370 CPM August 5, a four-month high; Corvalis OR hit ~145 CPM July 26 and has kept going up hitting a four-month high August 4 with a whopping ~235 CPM August 4 in a place that has a background of under 20 CPM; Pittsburgh PA‘s beta graph hit ~205 CPM August 5 in active ionizing; Puerto Rico‘s beta graph doesn’t work but the gamma remains low and steady which makes it even cooler even with the one-day data hiccup August 3; Amarillo TX went literally off the chart August 3 blasting through 1,000 CPM and you can tell this is no anomaly; Dallas TX was ~270 CPM August 4; Ft. Worth, is trending upward hitting ~180 CPM August 3; Salt Lake City UT‘s beta station is still down since a huge beta increase over 200 CPM in early May and it’s gamma bears watching as it has pulses of spikes; and Madison WI hit a four-month high August 4 nearly hitting 500 CPM.
2014/07/28 at 10:45 pm
43 out of 124 beta monitors are functional as of this date out of the 124 areas covered. Two very important California stations – Fresno and San Diego – are online which is terrific. Sometimes these beta graphs will appear to have stopped only to start up again. One important graph in Riverside California has been down since about July 23 which would be a real loss for folks in the Inland Empire. Hopefully, like Fresno and San Diego, the Riverside station comes back up. San Diego continues its (almost) inexplicable march higher in the beta readings as are a number of stations nationwide.Readings of 100 CPM or more indicate significant beta radiation activity. Note that below, the tilde symbol (~) before some rad readings means mathematically approximate.
Since July 21 (below in archives), Montgomery AL is still bouncing around hitting ~160 CPM July 26; Anchorage AK‘s beta graph is still at under 20 CPM all week which is terrific; Fairbanks AK hit ~48 CPM July 28; Phoenix AZ was a mere ~60 CPM July 28 though it was over 100 CPM four times in the last week; Tuscon AZ hit nearly ~320 CPM July 26; Little Rock AR topped out at ~270 CPM July 24; Fort Smith AR was just ~45 CPM July 28; Anaheim CA was nice and cool at ~45 CPM July 28; Fresno CA soared to ~270 CPM in the last week with Bakersfield CA still being MIA with Bakersfield beta and gamma; Los Angeles CA‘s beta graph stopped in March but the gamma remains normal; Riverside CA hit ~110 CPM July 23, the day of its last beta reading showing now; San Bernardino County CA was a reasonable 50 CPM yestertoday; San Diego reached ~155 CPM July 26; Hartford CT was ~110 CPM July 28; Washington DC hit ~110 CPM July 25; not one beta monitor out of five works in Florida even after us reporting it three weeks in a row – Floridians are breathing beta blind; Augusta GA rose to ~230 CPM July 25; Ft. Wayne IN smashed through ~255 CPM July 18 and then nearly matched that twice in the last week; Baton Rouge LA‘s graph seems to have gone on the fritz Jlu 25; Orono ME looks nice and cool showing how the farthest away station from Fukushima usually has the lowest beta radiation but hit a negligible ~15 July 28; Baltimore MD‘s beta and gamma graphs are still out; Worcester MA blew through ~235 CPM July 28; Grand Rapids MI dropped then went higher hitting ~345 CPM July 28; St. Paul MN went soared to ~170 CPM July 25 but settled to 50 CPM July 27; St. Louis is up hitting ~180 CPM July 28; Lincoln NE registered 350 CPM in the last week; Concord NH smashed through ~225 CPM July 26 setting a four-month high; Albuquerque NM spiked to ~325 CPM July 26; Buffalo NY hit to ~150 CPM July 26; New York City NY is not functioning as it hasn’t for years but its gamma gross count is settling down; Syracuse NY‘s beta graph went out before hitting ~135 CPM July 27; Charlotte NC is picking up repeatedly hitting over 100 CPM and was ~130 CPM July 27 at its height; Raleigh NC hit ~170 CPM July 24 and cut out; holy Toledo OH reached ~145 CPM July 26; Corvalis OR hit ~145 CPM July 26; Pittsburgh PA‘s beta graph hit ~95 CPM July 27; Puerto Rico‘s beta graph doesn’t work but the gamma remains low and steady which makes it even cooler; Amarillo TX was ‘only’ ~147 CPM July 26 in a week that saw the beta blast past 660 CPM July 24; Dallas TX was ~195 CPM July 25; Ft. Worth, was just 40 CPM July 26; Salt Lake City UT‘s beta station is still down since a huge beta increase over 200 CPM in early May and it’s gamma bears watching though it settled down in the last few days; and Madison WI hit ~320 CPM July 27 on a higher beta trajectory.
2014/07/21 at 11:20 pm
42 out of 124 beta monitors are functional as of this date out of the 124 areas covered. Two very important California stations – Fresno and San Diego – seem to have gone offline which is very problematic as the beta radiation we’re looking for flows from west to east and California is on, obviously, the Left Coast. What comes here first heads east. Overall, there is a significant trend sharply upwards this week as the following readings show.
Readings of 100 CPM or more indicate significant beta radiation activity. Note that below, the tilde symbol (~) before some rad readings means mathematically approximate.
Since July 14 (below in archives), Montgomery AL is bouncing around hitting 155 CPM July 18; Anchorage AK‘s beta graph is working again and still at under 20 CPM July 21; Fairbanks AK hit ~90 CPM in the last week; Phoenix AZ‘s graph looks to be live again with ~90 CPM July 20 which is still way lower than before; Tuscon AZ is still bouncing around and hitting nearly ~195 CPM in this latest period; Little Rock AR dropped to ~60 CPM July; Fort Smith AR is getting busy too but a a lot cooler at under 50 CPM since July 17; Anaheim CA is nice and cool at ~20 CPM today but our very own Radiation Station Glendale California is showing marked jumps in the low 40s CPMs hitting 47 CPM in the last hour; Fresno CA‘s graph cut our July 18 joining Bakersfield CA as being MIA with Bakersfield not even having a gamma graph in this town that read extremely high before the monitors cut out long ago; Radiation Station Pacifica California, about a 100 miles to the west, is showing ~32 CPM July 21; Los Angeles CA‘s beta graph stopped in March but the gamma is still not very active; Riverside CA remains active hitting ~90 CPM July 21; San Bernardino County CA was a reasonable 50 CPM yestertoday; San Diego is bottoming out nicely at ~25 CPM July 18 and then the graph stopped; Hartford CT was ~60 CPM July 21; Washington DC hit ~110 CPM in the last week; not one beta monitor out of five works in Florida even after us reporting it two weeks in a row; Augusta GA rose to ~147 CPM July 21; Ft. Wayne IN smashed through ~255 CPM July 18 and then the graph cuts out; Baton Rouge LA hit ~73 CPM in an active week trending upward; Orono ME looks nice and cool showing how the farthest away station from Fukushima usually has the lowest beta radiation but hit a negligible ~20 today; Baltimore MD‘s beta and gamma graphs are still out which is troubling but apparently not enough to anyone to do something about it; Grand Rapids MI is radically trending higher hitting ~260 CPM today; St. Paul MN went soared to ~150 CPM July 21; St. Louis is heading up and up hitting over 200 CPM today; Lincoln NE sailed over ~360 CPM in the last week; Albuquerque NM peaked at ~370 CPM in the last week; Buffalo NY jumped to ~180 CPM in this latest period; New York City NY is not functioning as it hasn’t for years but its gamma gross count is getting busy; Syracuse NY‘s beta graph is getting jumpy hitting ~125 CPM in the last week; Charlotte NC is picking up repeatedly hitting over 100 CPM and was ~120 CPM today at its height; Raleigh NC eased to ~50 CPM today after a jumpy week; holy Toledo OH jumped to over 150 CPM three times in the last few days; Corvalis OR hit ~150 CPM July 19; Pittsburgh PA‘s beta graph hit ~150 CPM today; Puerto Rico‘s beta graph doesn’t work but the gamma remains low and steady; Amarillo TX continues to astound with ~640 CPM July 20; Dallas TX was “just” ~80 CPM today; the whole state of Texas, save Ft. Worth, is getting hammered but lack of beta information – OOPS! Ft. Worth his ~125 CPM today; Salt Lake City UT‘s beta station is still down since a huge beta increase over 200 CPM in early May and it’s gamma bears watching; Charleston WV is still out after nearly hitting 400 CPM in March then the beta graph going belly up March 13 but the gamma graph works and is getting very active; and Madison WI hit ~192 CPM July 19.
2014/07/14 at 5:05 pm
Up five stations since last week, 44 out of 124 beta monitors are functional as of this date out of the 124 areas covered. Albuquerque, New Mexico is back online. That station is one of the closest to the troubled, and radiation-leaking WIPP facility in the Land of Enchantment.Readings of 100 CPM or more indicate significant beta radiation activity. Note that below, the tilde symbol (~) before some rad readings means mathematically approximate.
Since July 7 (below in archives), Montgomery AL has settled down to ~30 CPM today; Anchorage AK‘s beta graph is working again and so nicely low; Fairbanks AK eased up and is ~40 CPM today; Phoenix AZ‘s graph looks to be live again with ~40 CPM which is way lower than before; Tuscon AZ is still bouncing around considerably over 100 CPM hitting ~385 CPM July 12; Little Rock AR is still picking up hitting ~165 CPM today; Fort Smith AR is getting busy too but a little cooler at ~90 CPM today; Anaheim CA is nice and cool at ~30 CPM today but our very own Radiation Station Glendale California is showing marked jumps in the low 30 CPMs; Fresno CA has is coming in at 35 CPM this afternoon, which is quite low for the scenic city; Radiation Station Pacifica California, about a 100 miles to the west, is showing tangible heightened radiation today coming in at about 3 times its background at 40 CPM; Los Angeles CA‘s beta graph stopped in March but the gamma is not very active; Riverside CA remains active but eased up to ~60 CPM today; San Bernardino County CA was a reasonable ~60 CPM today; San Diego is bottoming out nicely at ~19 CPM today; Hartford CT hit the threshold 100 CPM July 12; Washington DC at ~65 CPM today; not one beta monitor out of five works in Florida even after us reporting it last week; Augusta GA settled down to 65 CPM today; Ft. Wayne IN hit ~155 CPM today; Baton Rouge LA topped a three month high July 13 with a whopping 150 CPM; Orono ME looks nice and cool showing how the farthest away station from Fukushima has the lowest beta radiation with ~7 CPM today (!!!); Baltimore MD‘s beta and gamma graphs are still out; Grand Rapids MI dipped to just ~24 CPM July 12; St. Paul MN went soared to ~180 CPM July 12; St. Louis remains active with ~75 CPM today; Lincoln NE hitting a sizzling 250 CPM today in a state known for beef production and high beta radiation in its atmosphere judging from the numbers; Albuquerque NM‘s beta station is now online after peaking at ~335 CPM June 22 with the previous high being ~417 CPM April Fools Day – today was a mere ~65 CPM even with the continuing reports out of the nearby WIPP; Buffalo NY was ~70 CPM yesterday; New York City NY is not functioning as it hasn’t for years but its gamma gross count has leveled out somewhat; Syracuse NY‘s beta graph is getting jumpy hitting ~115 CPM today; Charlotte NC is picking up repeatedly hitting over 100 CPM but is ~60 CPM today; Raleigh NC eased to ~40 CPM today; holy Toledo OH jumped to ~177 CPM ~July 5 but is ~97 CPM today; Corvalis OR is just ~38 CPM today; Pittsburgh PA‘s beta graph hit a hot ~260 CPM July 12; Puerto Rico‘s beta graph doesn’t work but the gamma is still low and steady; Amarillo TX continues to amaze with ~475 CPM July 12; Dallas TX hit ~270 CPM on the 4th of July but dropped to ~25 CPM today in a most welcome reversal; the whole state of Texas, save Ft. Worth, is getting hammered but lack of beta information; Salt Lake City UT‘s beta station is still down since a huge beta increase over 200 CPM in early May; Charleston WV is still out after nearly hitting 400 CPM in March then the beta graph going belly up March 13 but the gamma graph works and is getting active; and Madison WI hit ~265 CPM July 13 but had reached ~295 CPM May 28, 2014.
2014/07/07 at 3:54 pm
Just 39 out of 124 beta monitors are functional as of this date out of the 124 cities covered. Three stations went off line in just the last week including Albuquerque, New Mexico which has seen heightened activity. That station is one of the closest to the troubled, and radiation-leaking WIPP facility in the same state. At least the gamma graphs are working which is some consolation, but not much. See our June 30, 2014 report for deeper analysis on gamma graphs.
Readings of 100 CPM or more indicate significant beta radiation activity. Note that below, the tilde symbol (~) before some rad readings means mathematically approximate.
Since June 30 (below in archives), Montgomery AL started trending up again up to ~165 CPM yesterday; Anchorage AK‘s beta graph stopped producing data July 3; Fairbanks AK is picking up hitting 100 CPM in the last week; Phoenix AZ‘s graph is still offline since June 10 when it was ranging up to 165 CPM the week before outage; Tuscon AZ is still bouncing around considerably over 100 CPM; Little Rock AR is picking up hitting 200 CPM today; Fort Smith AR is getting busy too hitting ~220 CPM today; Anaheim CA is nice and cool at ~25 CPM today; Fresno CA has is coming in at 90 CPM this afternoon; Los Angeles CA‘s beta graph stopped in March but the gamma is not active; Riverside CA remains quite active marking ~135 CPM today; San Bernardino County CA keeps crossing the 100 CPM threshold but is a reasonable 75 CPM today; San Diego is chillin’ at just 30 CPM today which is higher than normal for the beach city; Washington DC is somewhat active at ~90 CPM today; not one beta monitor out of five works in Florida; Augusta GA settled down to 50 CPM today; Ft. Wayne IN hit ~225 CPM again in the last week; Orono ME looks nice and cool showing how the farthest away station from Fukushima has the lowest beta radiation with ~19 CPM today; Baltimore MD‘s beta and gamma graphs are still out; Grand Rapids MI hit ~180 CPM July 5 up from ~20 CPM July 4; St. Paul MN went soared to ~255 CPM yesterday; St. Louis is trending active with ~75 CPM today; Albuquerque NM‘s beta station is now offline after peaking at ~335 CPM June 22 with the previous high being ~417 CPM April Fools Day; Buffalo NY was ~70 CPM yesterday; New York City NY is not functioning as it hasn’t for years but its gamma gross count has picked up somewhat; Syracuse NY‘s beta graph settled down to ~40 CPM today; Charlotte NC is picking up repeatedly hitting over 100 CPM but is ~60 CPM today; Raleigh NC jumped to 160 one day in the latest period; holy Toledo OH jumped to ~177 CPM ~July 5; Corvalis OR is up to ~80 CPM today; Pittsburgh PA‘s beta graph stopped ~July 1 after activity increase; Puerto Rico‘s beta graph doesn’t work but the gamma is still low and steady; Amarillo TX continues to amaze with ~420 CPM today; Dallas TX hit ~270 CPM on the 4th of July; the whole state of Texas, save Ft. Worth, is getting hammered but lack of beta information means the Lone Star State is still nearly blind but nevertheless hot; Salt Lake City UT‘s beta station is still down since a huge beta increase over 200 CPM in early May; Charleston WV is still out after nearly hitting 400 CPM in March then the beta graph going belly up March 13; and Madison WI hit ~175 CPM today but had reached ~295 CPM May 28, 2014.
2014/06/30 at 6:54 pm
Our EPA RadNet Air Monitoring shows that 42 beta monitors are functional as of this date out of the 124 cities covered. That’s up from 40 but about half a dozen of them seem to have stopped on June 27. We are still counting these as active just in case it has to do with it being the end of June. Even without beta graphs, one can glean data out of the gamma graphs – take note of the radiation reading patterns in locations that do have both beta and gamma graphs. They often move together. So this could help at least give an idea of the beta readings at a site if only the gamma information is available. Note that below, the tilde symbol before some rad readings “~” means mathematically approximate.Some places got hotter since June 19 (below in archives): Montgomery AL started settling down but zoomed up to ~140 CPM yesterday; Anchorage AK is very low; Phoenix AZ‘s graph has stayed out since June 10 when it was ranging up to 165 CPM the week before outage; Tuscon AZ was over 200 CPM today; Fresno CA has cooled down to 90 CPM; Los Angeles CA‘s beta graph crapped out in March but the gamma is not active; Riverside CA dropped to 100 CPM today; Augusta GA settled down to 100 CPM by today; Ft. Wayne IN hit 225 CPM in the last week; Orono ME looks nice and cool showing how the farthest away station from Fukushima has the lowest beta radiation with ~17 CPM today; Baltimore MD‘s beta and gamma graphs are still out; St. Paul MN went nuts and hit 340 CPM in the last week; St. Louis has dropped to ~50 CPM even with that burning radioactive dump; Albuquerque NM‘s beta station is back online and trending down with only ~55 CPM today after peaking at ~335 CPM June 22; Buffalo NY is trending up hitting ~140 CPM June 28; New York City NY is not functioning as it hasn’t for years; Syracuse NY‘s beta graph settled down to ~65 CPM today; Charlotte NC is picking up repeatedly hitting over 100 CPM; Raleigh NC jumped to 150 today; holy Toledo OH jumped to ~140 CPM today; Corvalis OR really cooled off to ~20 CPM today; Pittsburgh PA hit ~105 CPM yesterday; Puerto Rico‘s beta graph doesn’t work but the gamma is low and steady; Amarillo TX continues to amaze with 450 CPM June 27; Dallas TX down to 55 CPM today; the whole state of Texas, save Ft. Worth, is getting hammered but lack of beta information means the Lone Star State is nearly blind but nevertheless hot; Salt Lake City UT‘s beta station is still down; Charleston WV is still out after nearly hitting 400 CPM in March; and Madison WI hit ~145 CPM June 28 after topping out at ~295 CPM May 28, 2014.
2014/06/19 at 8:35 pm
Our EPA RadNet Air Monitoring shows that only 40 beta monitors are functional as of this date out of the 124 cities covered. Last July 9, 60 stations were operable meaning there has been a 33% loss even as the Fukushima and WIPP fiasco’s continue unabated. These stations are run by volunteers who deserve our gratitude. They also deserve compensation because we deserve 100 percent functionality of these beta graphs.
Of particular concern are some locales that caught our attention today on the working beta graphs: Montgomery AL is at 165 CPM; Phoenix AZ’s graph is out since June 10; Tuscon AZ was over 500 CPM June 1; Fresno CA is picking up hitting over 350 CPM this month; Los Angeles CA’s beta graph crapped out in March; Riverside CA keeps cookin’; Augusta GA hit 350 CPM in the last week; Orono ME looks nice and cool showing how the farthest away station from Fukushima has the lowest beta radiation; Baltimore MD’s beta and gamma graphs are out; Albuquerque NM was trending down before its beta station, not too far from WIPP, went belly up; Buffalo NY is trending up hitting 110 CPM June 10 but Syracuse NY’s beta station quit in the last month; Corvalis OR is picking up topping 150 CPM in the last week; Pittsburgh PA continues to trouble; Amarillo TX is trending down ‘only’ hitting 300 CPM in the last week; the whole state of Texas, save Ft. Worth, is getting hammered to various degrees but El Paso TX, which is close to WIPP, has lost both beta and gamma monitors; Salt Lake City UT’s beta crapped out a month ago; Olympia WA is looking sweet with low beta and hot Charleston WV has lost both graphs when they least needed being radiation blind.
EnviroReporter.com thanks the volunteers that run these USEPA RadNet radiation stations. We only hope that the beta stations were all operable as beta-emitting radionuclides are the ones of concern continuously gushing into the Pacific Ocean in Fukushima Japan. Also of concern is the radioactive air from the burning of radioactive rubble throughout the country as well as the re-suspension of radiation already released from the triple meltdown that began March 11, 2011.
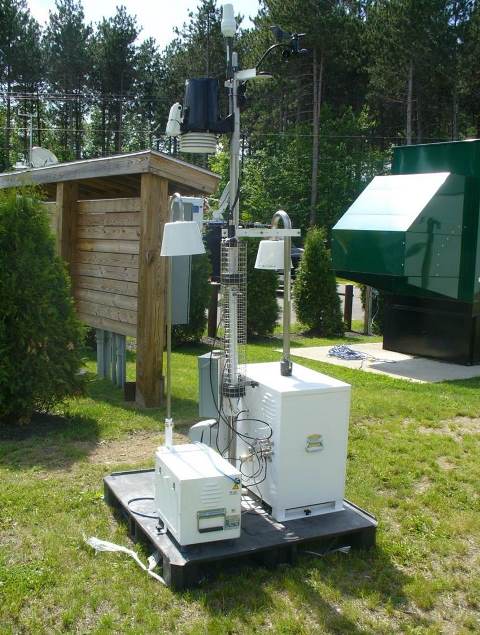
The EPA RadNet system is run by volunteers according to the US EPA’s “Day in the Life of a Rad Sample.” EnviroReporter.com will continue to monitor RadNet to make it possible for the public and government to have quick and easy access to this important data.


Recent Comments