« 1 2 3 4 5 6 7 8 9 10 11 12 13 14 15 16 17 18 19 20 21 22 23 24 25 26 27 28 29 30 31 32 33 34 35 36 37 38 39 40 41 42 43 44 45 46View All»
ACTIVE

EnviroReporter.com has in-depth databases of information from Spring 2011 to the present including Special Radiation Station Testing along with food and drink radiation testing from over a dozen nations in Radiation Food Lab.
We have been measuring in CPM because it is easier for most people to see the difference in radiation levels. The baseline external radiation background we’ve established for this location is 42 to 46 CPM which equals 0.012 to 0.013 mR/hr.
Over 10,000 multi-media radiation tests across America since 2011
Note that none of our readings at Radiation Station Santa Monica California [RSSMC] are impacted by radon progeny as we discuss in Beta Watch.
RADIATION TESTS
June 3, 2022
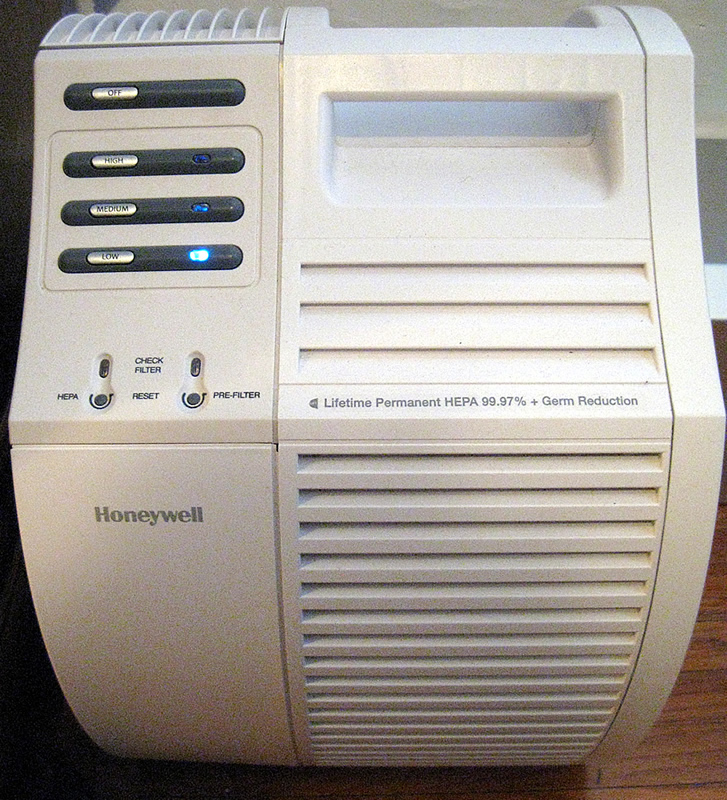
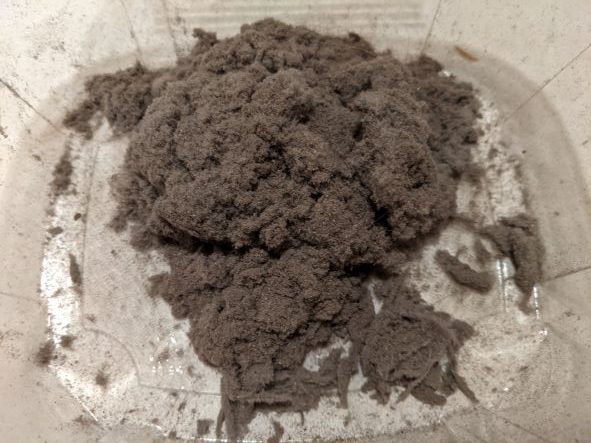
2:40 pm PDST INT RSSMC DUST AGGREGATE FROM 3 HEPA FILTER MACHINES: 55.3 CPM OR 47.9% ABOVE BACKGROUND^^ which is negligible and a substantial drop since the last measurement in identical conditions just over two months ago on March 30, 2022.
2:00 pm PDST INT RADIATION STATION SANTA MONICA CALIFORNIA OFFICE BACKGROUND: 37.4 CPM^^
March 30, 2022
9:35 pm PDST INT RSSMC DUST AGGREGATE FROM 3 HEPA FILTER MACHINES: 95.9 CPM OR 2.3 TIMES BACKGROUND^^
9:20 pm PDST INT RADIATION STATION SANTA MONICA CALIFORNIA OFFICE BACKGROUND: 41.3 CPM^^
February 21, 2022
6:45 pm PT INT RSSMC DUST AGGREGATE FROM 3 HEPA FILTER MACHINES: 92.3 CPM OR 2.4 TIMES BACKGROUND^^
6:25 pm PT INT RADIATION STATION SANTA MONICA CALIFORNIA OFFICE BACKGROUND: 38.5 CPM^^
January 17, 2022
2:15 pm PT INT RADIATION STATION SANTA MONICA RAIN: 44.9 CPM^^ or normal background
2:00 pm PT INT RADIATION STATION SANTA MONICA OFFICE BACKGROUND: 43.5 CPM^^
BEGINNING 2021
« 1 2 3 4 5 6 7 8 9 10 11 12 13 14 15 16 17 18 19 20 21 22 23 24 25 26 27 28 29 30 31 32 33 34 35 36 37 38 39 40 41 42 43 44 45 46View All»


Recent Comments